Play all audios:
To understand better the factors contributing to keratoconus (KTCN), we performed comprehensive transcriptome profiling of human KTCN corneas for the first time using an RNA-Seq approach.
Twenty-five KTCN and 25 non-KTCN corneas were enrolled in this study. After RNA extraction, total RNA libraries were prepared and sequenced. The discovery RNA-Seq analysis (in eight KTCN and
eight non-KTCN corneas) was conducted first, after which the replication RNA-Seq experiment was performed on a second set of samples (17 KTCN and 17 non-KTCN corneas). Over 82% of the genes
and almost 75% of the transcripts detected as differentially expressed in KTCN and non-KTCN corneas were confirmed in the replication study using another set of samples. We used these
differentially expressed genes to generate a network of KTCN-deregulated genes. We found an extensive disruption of collagen synthesis and maturation pathways, as well as downregulation of
the core elements of the TGF-β, Hippo, and Wnt signaling pathways influencing corneal organization. This first comprehensive transcriptome profiling of human KTCN corneas points further to a
complex etiology of KTCN.
Keratoconus (KTCN, OMIM 148300) is a degenerative eye disorder characterized by progressive stromal thinning, resulting in a conical shape of the cornea. Structural changes in the corneal
layers cause optical aberrations, leading to a loss of visual function.1 The estimated frequency of KTCN in the general population is 1 in 2000 individuals.1 Corneal transplant surgery
becomes necessary in advanced KTCN, because of a progression of stromal thinning or scarring.2
KTCN development may be related to environmental factors such as constant eye rubbing or contact lens wear, or it may be genetically controlled.3 Recently, it was suggested that KTCN could
be a quasi-inflammatory condition.4 However, the exact causes of this disease are not well characterized, and its complexity and heterogeneity make it difficult to discover the factors that
unambiguously trigger the KTCN phenotype.
Over the years, numerous functional and positional candidate genes for KTCN have been proposed, including VSX1, HGF, and mir-184.5, 6, 7 Also, numerous sequence variants in our KTCN research
were identified.8, 9, 10, 11, 12 However, because variations in these genes were specific to particular families or populations only, they could not be recognized as causative for KTCN in
the general population. The one possible explanation for the absence of genetic KTCN marker(s) is that the studied genes constitute only a minor fraction of the total genetic load and the
number of genes altered in KTCN may be higher. It is also possible that the KTCN phenotype is not linked to variations in the nucleotide sequence. Thus, it has been assumed that in addition
to DNA-based analysis, RNA studies may provide important insights into KTCN etiology.13, 14
Herein, we present the results of comprehensive transcriptome profiling of KTCN corneas and non-KTCN corneas, obtained for the first time using an RNA-Seq approach. Distinct differences in
gene expression patterns between the KTCN and non-KTCN corneas were found. The categorization of the upregulated and downregulated genes into functionally relevant groups identified
molecular pathways deregulated in KTCN corneas – the TGF-β, Hippo, and Wnt pathways – and allowed a better understanding of the molecular bases of this disease.
All study participants were recruited and examined in the Department of Ophthalmology, Medical University of Warsaw, Warsaw, Poland. The clinical characteristics of all individuals are shown
in Supplementary Table 1. The ophthalmic examination consisted of a best-corrected visual acuity evaluation, intraocular pressure assessment, slit-lamp examination, and corneal topography
and pachymetry assessments. Patients were considered affected if they had at least one clinical sign – corneal thinning, Vogt’s striae, or Fleischer rings – in slit-lamp biomicroscopy
concurrent with the characteristic deviation from normal parameters based on the topography and pachymetry assessments. The study protocol was approved by the Institutional Review Board at
Poznan University of Medical Sciences, Poznan, Poland. The possible consequences of the study were explained, and informed consent was obtained from all participants before participation,
according to the Declaration of Helsinki.
The 25 KTCN corneal tissues were derived from non-related Polish patients during a keratoplasty procedure for KTCN. The 25 non-KTCN corneas, used as controls, were collected from patients
who were referred for corneal transplantation for different reasons, such as bullous keratopathy, corneal scarring, ulcers, and perforations. The corneas were submersed in an RNA
stabilization solution (RNAlater; Qiagen, Hilden, Germany) directly after corneal button excision during the surgical procedure, and stored at −20 °C until RNA extraction.
The whole corneal buttons were transferred to lysis solution (Norgen Biotek, Thorold, ON, Canada) in a microtube with Lysing Matrix D (MP Biomedicals, Irvine, CA, USA) and homogenized using
a FastPrep-24 Instrument (MP Biomedicals). Further total RNA extraction and purification steps were performed according to the instructions supplied with a Total RNA Purification Kit (Norgen
Biotek). Next, an on-column DNase I (Zymo Research, Irvine, CA, USA) treatment was performed. The quality and quantity of the purified RNA samples were assessed using an RNA 6000 Nano Kit
(Agilent Technologies, Waldbronn, Germany). The concentrated samples of total RNA were stored frozen at −80 °C until further analysis.
Libraries were prepared with a TruSeq Stranded Total RNA LT with Ribo-Zero Human/Mouse/Rat Kit (Illumina, San Diego, CA, USA) according to the manufacturer’s protocol, with slight
modifications. Briefly, total RNA samples were depleted of both cytoplasmic and mitochondrial rRNA using biotinylated, target-specific oligos combined with Ribo-Zero rRNA removal beads.
Then, the total RNA samples were fragmented to generate inserts ranging in size from 120 to 200 bp (median size, 150 bp); fragmentation time was adjusted to sample RNA integrity number (RIN)
to avoid RNA over-fragmentation. SuperScript II Reverse Transcriptase (Invitrogen, Carlsbad, CA, USA) and random hexamer primers were used to synthesize the first-strand cDNA, and DNA
polymerase I and RNase H were used to synthesize the second-strand cDNA. Double-stranded cDNA samples were subjected to classical library preparation steps, including end repair, 3′ end
adenylation, indexed adapter ligation, and 12 cycles of PCR enrichment amplification. The generated libraries were assessed using an Agilent DNA 1000 Kit (Agilent Technologies) and
quantified using a Qubit dsDNA High Sensitivity Kit (Life Technologies, Eugene, OR, USA). Finally, cluster generation was performed using a TruSeq PE Cluster Kit v3 or v4 (Illumina) on a
cBot instrument (Illumina). A 75- or 100-bp paired-end run was performed on a HiSeq1500 platform (Illumina). RIN scores, RNA input, RNA fragmentation time, and sequencing conditions are
summarized in Supplementary Table 2.
The cornea samples were assessed in two independent RNA-Seq experiments. The first case–control study (the discovery study) was performed in the direction of novel transcript discovery and
differential expression analysis. The tested materials were eight KTCN corneas and eight non-KTCN corneas sequenced at a depth of 150–250 million read pairs per sample. The second
case–control study (the replication study) was used for replicating the differential expression analysis. The tested materials were 17 KTCN and 17 non-KTCN samples sequenced with coverage of
50–70 million read pairs per sample.
Short reads obtained during sequencing were processed using Trimmomatic15 to remove adapter sequences and poor quality regions. Reads that were similar to human rRNA sequences were removed
using a Bowtie 2 short read mapper.16 Filtered reads from the discovery study were mapped to the reference human genome (GRCh38) using the STAR 2-pass mapping approach.17
Transcripts were assembled from mapped reads using StringTie software,18 requiring minimum coverage of 10 reads for assembled transcripts and detected splicing junctions. Assembled
transcripts shorter than 200 bp were discarded. The mitochondrial genome was excluded from the transcript assembly as suggested in the StringTie documentation.18
Assembled transcripts were merged with reference GENCODE 21 annotations using Cuffmerge19 to detect novel genes and isoforms. Novel transcripts were only kept if they contained at least one
intron. The protein-coding potential of the transcripts was predicted using TransDecoder.20
The expression of analyzed genes and transcripts, both reference and novel, was estimated with Kallisto.21 Differential expression analyses were performed separately for the discovery and
replication data sets using DESeq2 and edgeR packages.22, 23 Only genes and transcripts with at least 10 reads assigned to them in each compared sample were tested for differential
expression, in accordance with the bioinformatics analysis guide by Cofactor Genomics (https://cofactorgenomics.com/6-changes-thatll-make-big-difference-rna-seq-part-6/). Genes and
transcripts were considered to be differentially expressed if they had a 1.5-fold change. Diagnostic charts, such as heat maps and PCA and MA plots, were created using functionality provided
by the DESeq2 package.
The overrepresentation analysis of molecular pathways among genes upregulated and downregulated in KTCN was performed using the ConsensusPathDB server.24 Only genes that were consistently
classified as differentially expressed by both DESeq2 and edgeR in the discovery and replication studies were used for overrepresentation analysis. Genes expressed in the cornea with a mean
expression level of at least 1 transcripts per million (TPM) were used as the background gene set. We were only interested in pathways sharing at least five genes with our gene sets, and we
used a q-value cutoff of 0.01.
RNA-Seq data for selected genes, including TGFB3, CTGF, and COL21A1, were verified using the LightCycler 96 system (Roche Diagnostics, Penzberg, Germany) and the RealTime ready Custom Panel
96 (Roche), according to the manufacturer’s protocol. The expression levels of our targets of interest in six KTCN and six non-KTCN corneas were quantify by GenEx Enterprise version 6
software (MultiD Analyses AB, Gothenburg, Sweden).
The discovery RNA-Seq analysis (in eight KTCN and eight non-KTCN corneas) was conducted first, after which the replication RNA-Seq experiment was performed on a second set of samples (17
KTCN and 17 non-KTCN corneas). Short reads obtained during the discovery and replication studies were subjected to quality control and removal of rRNA sequences. In all cases, >80% of the
read pairs passed the quality filtering, and in the vast majority of samples, the fraction of rRNAs did not exceed 5%. Short reads from the discovery study were mapped to the reference human
genome, with only 1–2% failing to map. Quality filtering and mapping statistics for the discovery and replication analyses are presented in Supplementary Table 3.
Overall, 59 795 novel transcripts and 108 previously unannotated genes were found. The protein-coding potential of the novel transcripts was predicted, and different classes of detected
novel transcripts (‘class codes’ in Cufflinks terminology) turned out to have various protein-coding preferences. The novel intergenic loci contained a much greater proportion of noncoding
RNAs than the novel isoforms of the known genes (Supplementary Table 4). The final merged annotations obtained in this study are provided in Supplementary File 1. The expression values of
genes and transcripts are provided in Supplementary File 2.
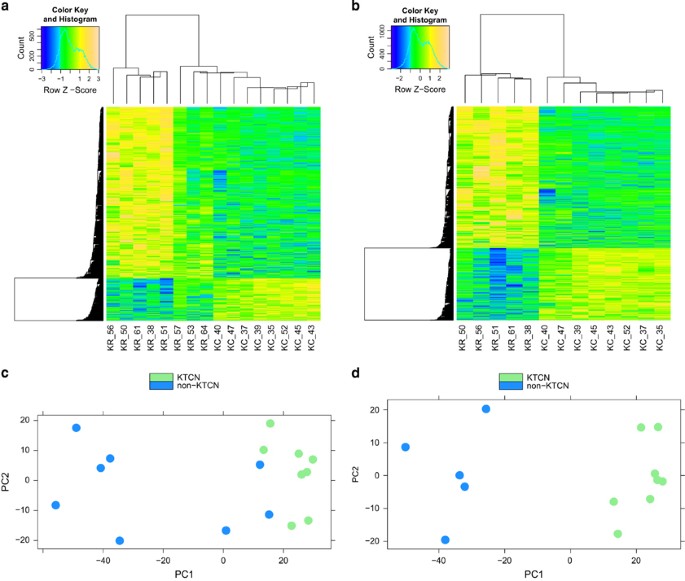
Sample clustering and principal component analysis (PCA) based on detected differentially expressed genes showed that three of eight non-KTCN samples in the discovery study (KR_53, KR_57,
KR_64) and two of 17 non-KTCN samples in the replication study (KR_08, KR_35) clustered with the KTCN samples, not with other non-KTCN samples (Supplementary File 3). This pattern may have
been the result of high heterogeneity among the non-KTCN samples; the samples were excluded from further analysis, as recommended in the RNA-Seq analysis protocol of the EpiGeneSys project
(http://www.epigenesys.eu/images/stories/protocols/pdf/20150303161357_p67.pdf). Removing the samples resulted in a distinct separation between non-KTCN and KTCN samples, as shown in the heat
maps and PCA plots provided (Figure 1). All diagnostic plots for the final differential expression analysis are presented in Supplementary File 4.
Hierarchical clustering of KTCN and non-KTCN samples and PCA plots in the discovery study. Heat maps indicate hierarchical clustering of KTCN and non-KTCN samples based on the expression
values of differentially expressed genes before removing the samples (a) and after removing the samples (b). PCA plots are based on the expression values of all genes before removing the
samples (c) and after removing the samples (d).
In the discovery study, 2650 genes exhibiting differential expression were identified, of which 795 (30%) were upregulated and 1855 (70%) were downregulated. In addition, 1937 (73.09%) of
the genes had coverage (≥10 reads) sufficient to be tested in the discovery and replication studies; 1599 (82.55%) genes were recognized by both packages (DESeq2 and edgeR), 33 (1.70%) were
recognized by only one package, and 305 (15.75%) were not observed in the replication study. Similarly, 5235 differentially expressed transcripts (1578 upregulated and 3657 downregulated)
were found in the discovery analysis, 2744 (52.42%) of which were also tested during replication. Of those, 2057 (74.96%) were recognized by both packages, 56 (2.04%) were recognized by only
one package, and 631 (23%) were not found in the replication study. Detailed results of the differential expression analyses of both gene and transcript levels are presented in
Supplementary File 5.
Quantitative real-time PCR analysis of selected genes in KTCN and non-KTCN individuals showed a 2.13-fold and 2.88-fold lower expression of TGFB3 and CTGF genes, respectively, and 2.47-fold
higher expression of COL21A1 gene in KTCN patients (Figure 2).
Relative quantification and comparison of the expression of TGFB3, CTGF, and COL21A1 genes in KTCN and non-KTCN individuals. Bars indicate mean expression (white in KTCN, black in non-KTCN);
the error bar show SD, P-value