Play all audios:
ABSTRACT Various methods have been developed for calling single-nucleotide polymorphisms from next-generation sequencing data. However, for satisfactory performance, most of these methods
require expensive high-depth sequencing. Here, we propose a fast and accurate single-nucleotide polymorphism detection program that uses a binomial distribution-based algorithm and a
mutation probability. We extensively assess this program on normal and cancer next-generation sequencing data from The Cancer Genome Atlas project and pooled data from the 1,000 Genomes
Project. We also compare the performance of several state-of-the-art programs for single-nucleotide polymorphism calling and evaluate their pros and cons. We demonstrate that our program is
a fast and highly accurate single-nucleotide polymorphism detection method, particularly when the sequence depth is low. The program can finish single-nucleotide polymorphism calling within
four hours for 10-fold human genome next-generation sequencing data (30 gigabases) on a standard desktop computer. You have full access to this article via your institution. Download PDF
SIMILAR CONTENT BEING VIEWED BY OTHERS EMPIRICAL BAYES SINGLE NUCLEOTIDE VARIANT-CALLING FOR NEXT-GENERATION SEQUENCING DATA Article Open access 18 January 2024 SEARCHING THOUSANDS OF
GENOMES TO CLASSIFY SOMATIC AND NOVEL STRUCTURAL VARIANTS USING STIX Article Open access 08 April 2022 SYSTEMATIC ANALYSIS OF PARALOGOUS REGIONS IN 41,755 EXOMES UNCOVERS CLINICALLY RELEVANT
VARIATION Article Open access 27 October 2023 INTRODUCTION Detecting genetic variations in human genome is vital to understanding the causes of phenotypic variations, including
susceptibilities to cancers and infectious diseases. Single-nucleotide polymorphisms (SNPs) are one of the most common types of genetic variation in humans. SNPs have been reported to
influence protein coding1, transcriptional regulation2, alternative splicing3 and non-coding RNA regulation4. A large number of SNPs has been identified in the Human Genome Project5,6 and
the Human Haplotype Map Project7,8. In addition, recent advances in next-generation sequencing (NGS) technologies have enabled us to detect even more SNPs. The use of NGS platforms, such as
the Illumina Genome Analyzer, Roche/454 FLX and ABI SOLiD, not only increases the throughput of data but also dramatically reduces the cost of sequencing9. Although SNP detection methods for
conventional sequencing technologies are well developed, new SNP detection methods for NGS technologies are still lacking. Several methods have been developed for SNP calling from NGS data,
and the performances of these SNP calling programs have been evaluated10. For example, the SNP calling method by Morin _et al._11 used a proportion of bases that matched the reference.
However, this method used an arbitrary threshold and did not provide confidence estimates for the predicted results. Other methods such as MAQ12 and SOAPsnp13,14 are based on Bayesian-based
posterior probabilities, and SNVmix15 uses a mixed binomial model to discover SNPs, giving a confidence score for each SNP called. These methods perform better for loci with high sequence
depths, but their accuracy decreases for sequence depths lower than 10. Other SNP callers used in NGS analysis are integrated into pipelines or are structured into software libraries, such
as Bcftools16 in samtools and UnifiedGenotyper in GATK17. Both of these tools use Bayesian likelihood to infer the posterior probability of a locus being a SNP and to call the genotype.
Furthermore, both methods can use pooled data to improve the accuracy of the SNP calling. A recent software tool18 was developed for SNP calling of lower sequencing depths. However, the SNP
filtering parameters were manually defined and the program accepted inputs from only the Solexa platform. This software performed better when known SNPs of the target genome were available.
We have designed a fast and accurate SNP detection (FaSD) program that uses a binomial distribution-based algorithm and a mutation probability to detect SNPs from NGS data. We compared our
method with existing software using both cancer and normal tissue data from The Cancer Genome Atlas (TCGA)19 and trios data from 1,000 Genomes Project20. Using SNP arrays and high-depth
sequencing data as benchmarks, we found that our method had higher SNP calling accuracy compared with other methods, especially with low-depth sequencing data. Furthermore, our program
completed the SNP calling from 10-fold human genome NGS data (30 gigabases) within four hours on a standard desktop computer compared with the GATK method that takes double the time. RESULTS
PERFORMANCE EVALUATION ON SNPS COVERED BY ARRAYS To assess the SNP calling quality of the tools, we compared the results from our FaSD method with GATK17, SOAPsnp13,14, MAQ12, SNVmix2 (15)
and Bcftools16 using data sets derived from a Glioblastoma multiforme (GBM) tumour sample and the corresponding blood normal sample from the same individual, which were both sequenced on a
Illumina Genome Analyzer II platform. We used genotype calling results from both Affymetrix and Illumina SNP arrays as gold standards, which were obtained from the same samples. Because of
the poor accuracy of SNP calling for data with very low sequencing depths12,13, we included only the loci that were covered by at least four reads. We compared the genotype concordances17
(Supplementary Table S1) among the SNP calling tools and the two SNP arrays for both normal and tumour data sets. Looking at the normal data set with either Bowtie (Table 1) or BWA
(Supplementary Table S2) as the aligner, the genotypes called by both Affymetrix SNP array 6.0 and Illumina humanhap550 genotyping beadchip array were very similar with concordance rates of
more than 0.95 (0.997 for bowtie and 0.957 for BWA). SOAPsnp and MAQ, both developed by the Beijing Genome Institute in Shenzhen, China, also showed high concordances of 0.997 with either
Bowtie or BWA as the aligner. The genotypes called by GATK and Bcftools were very similar when using Bowtie as the aligner giving a concordance of 0.979. The concordance drops to 0.924 when
BWA was used as the aligner, but this value was still high compared with other genotype calling methods. By comparing the results from the SNP calling programs with those from the two arrays
used as our gold standards, we found that FaSD and Bcftools were the best methods. FaSD was better than Bcftools when Illumina array was used as the benchmark (Table 1 and Supplementary
Table S2), as shown by a concordance of 0.882 for FaSD vs. 0.865 for Bcftools when aligned by Bowtie, and 0.833 vs. 0.674 when aligned by BWA. We also evaluated the performance of these
methods on the tumour data set, because tumour tissues are highly heterogeneous compared with normal tissue. With either Bowtie or BWA as the aligner, FaSD showed a higher concordance of
about 3–5% with benchmarks in the tumour tissue compared with normal tissue (Table 1 and Supplementary Table S2). Similar concordance increases were observed in Bcftools with both Bowtie and
BWA, but this was not the case for others. In contrast, MAQ and SOAPsnp showed a slight drop in concordance for tumour tissue compared with normal tissue. The area under the curve (AUC) of
a receiver operating characteristic (ROC) curve is widely used as a measure of the overall classification performance of a program without needing to consider the specific cutoffs. We
independently evaluated the performances by comparing the AUCs of different programs using both normal and tumour data sets. Because the sequencing depth has a large impact on SNP calling
quality, we separated all the data sets into four sub-data sets according to the sequencing depth of each position. The subsets were named 4_5, 6_10, 11_15 and 16_20, which corresponded to
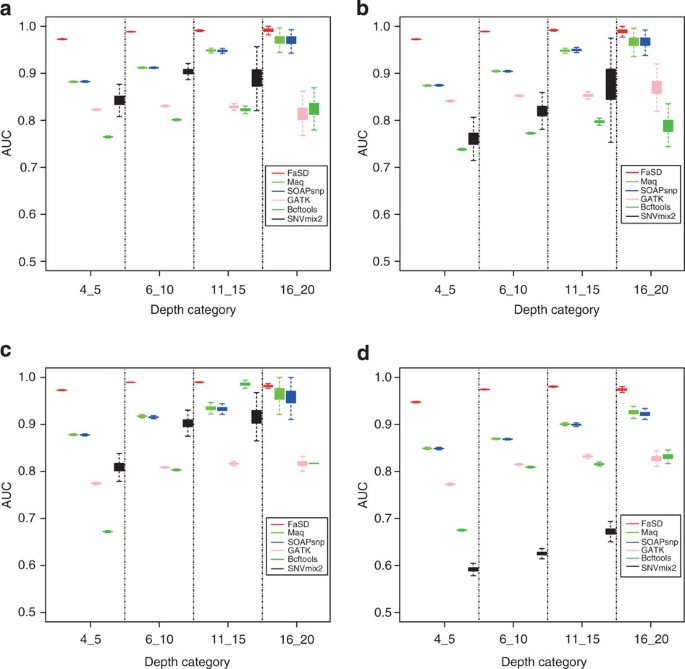
sequence depths of 4–5, 6–10, 11–15 and 16–20, respectively. As shown in Supplementary Tables S3 and S4, FaSD had the largest AUC compared with the other tools for all the sub-data sets of
both the tumour and normal data sets, regardless of the array platform used as the benchmark. We further tested the performances by the stability of AUCs (bootstrapped 1,000 times), and the
result confirmed that FaSD significantly outperformed the other methods, especially in low coverage categories (Fig. 1, one tail unpaired Wilcox test _P_<2.2e−16 for each depth category,
in both GBM tumour and normal data sets, benchmarked by either Illumina or Affymetrix array). We compared the results from FaSD, GATK, Bcftools and MAQ on both normal and tumour data sets.
For the tumour samples using Affymetrix SNP array as the benchmark, SNPs were divided into several groups: SNPs detected by a single tool, two tools, three tools and by all four tools (Fig.
2). For a SNP called by FaSD and by either Bcftools or GATK, over 99.7% could be confirmed by the Affymetrix array. However, if a SNP was called by both Bcftools and GATK, but not by FaSD,
only 46.2% could be confirmed by the Affymetrix array. We further looked at the SNPs that were called uniquely by each tool: 63.3% of SNPs detected by only FaSD could be confirmed by the
Affymetrix array, whereas the number was 43.3% for GATK, 35.9% for Bcftools and 2.0% for MAQ. MAQ made the largest number of SNP calls, but the accuracy was the lowest for uniquely called
SNPs. We analysed the normal data set and found similar results (Supplementary Fig. S1). PERFORMANCE EVALUATION ON SNPS NOT COVERED BY ARRAYS Both Illumina and Affymetrix SNP arrays contain
less than one-tenth of the total number of current SNPs in the human genome, so evaluations based on the SNP arrays will be biased for common SNPs selected by these platforms. To avoid this
bias, we evaluated the performance of the tools using high coverage multi-source-merged sequencing data (chromosomes 21 and 22 from a Yoruba with average 35-fold whole genome coverage).
Because this data set has high sequence depth and MAQ has been proven to have high SNP calling accuracy for high sequence depth data12, we used the results of MAQ SNP calling (named
High_MAQ) on this data set as our benchmark. We randomly sampled 10% of reads four times to form four sub-data sets. FaSD, MAQ, SOAPsnp, GATK and Bcftools were then used to call SNPs on
these sub-data sets and their results were compared with the benchmark. The majority of loci (>99.5%) in the human genome have the genotype of AA, whose inclusion could overwhelm any
differences, that is, the overall genotype concordance won’t differ much among the various caller methods. Therefore, we used non-reference concordances to assess the quality of SNP calling
by excluding the concordant AA genotypes (Supplementary Table S1). As shown in Table 2, with default cutoffs, FaSD called 69,768 SNPs in chromosome 21 and 78,240 SNPs in chromosome 22. The
numbers are close to the SNPs called by the benchmark, which were 78,679 and 68,017, respectively. SOAPsnp and MAQ called 25–40% more SNPs than the benchmark, whereas Bcftools and GATK
called 40–50% less SNPs than the benchmark. To call a similar number of SNPs as Bcftools and GATK, we adjusted FaSD’s cutoff from the default 3.2 to 5.0, which reduced numbers of SNPs called
in chromosomes 21 and 22 to 45,845 and 45,211, respectively. We then compared the non-reference concordances of FaSD at this cutoff with the other tools and with the benchmark. For
chromosome 21, FaSD had the highest non-reference concordance with the benchmark (Table 3). Consistent with our previous evaluation, the performance of SOAPsnp was almost the same as MAQ10.
The non-reference concordances of both GATK and Bcftools with the benchmark were also around 0.4, which was close to that of FaSD. For chromosome 22, GATK had the best non-reference
concordance with the benchmark. However, the non-reference concordances of both FaSD and Bcftools were only around 0.5% and 2.5% lower than GATK, respectively (Supplementary Table S5).
PERFORMANCE EVALUATION ON POOLED DATA The detection of rare variants is important because common genetic variants can explain only a small proportion of heritability21. However, rare
variants have low minor allele frequencies and are very hard to separate from genotype errors22. Pooled data from multiple individuals can improve the discovery of rare variants. Both GATK
and Bcftools have the function to utilize pooled data. Therefore, we compared the performance of FaSD on pooled samples with the performance of both GATK and Bcftools. The pooled samples are
composed of low coverage (~4 × ) whole genome sequencing data of 40 CEU (Utah residents with ancestry from Northern and Western Europe) individuals from pilot 1 of 1,000 Genomes Project.
Sequencing data on chromosome 21 of three CEU individuals in one trio were picked as the evaluation objects. MAQ calling results of corresponding high coverage data (30 × ) from pilot 2 of
1,000 Genomes Project were used as the gold standard. As expected, the calling results on the individual’s low coverage 4 × data had limited SNPs discovery. Even using FaSD as the caller, we
could not exceed the non-reference concordance of 0.6 (Table 4 and Supplementary Tables S6 and S7). Using a multi-sample SNPs calling function to genotype multiple samples simultaneously
from aggregated 40-sample data, GATK and Bcftools showed at least 20% improvement in terms of the non-reference concordance. FaSD also showed a slight increase in the non-reference
concordance because it also incorporated genotype information from the pooled data sets. For all individuals investigated from that trio, FaSD had the best non-reference concordances of
0.557 (NA12878), 0.585 (NA12891) and 0.556 (NA12892) benchmarked by High_MAQ. In the GATK pipeline, imputation23,24 could help to refine and recover genotypes at sites with little or no
coverage. Following this recommendation, we used Beagle25 to impute the 40-sample call set. It should be noted that imputation not only recovered an additional 36% of the non-reference sites
for FaSD, 26% for GATK and 3% for Bcftools (average of three individuals, Supplementary Table S8), but also improved the non-reference concordance from an average of 0.566 to an average of
0.706 for FaSD, from 0.477 to 0.632 for GATK and from 0.514 to 0.590 for Bcftools (average of three individuals, Supplementary Tables S9–11). PROCESSING SPEED The time taken for these tools
to process the data is a major bottleneck for NGS data analysis. We compared the running time of FaSD, GATK and Bcftools for SNP calling on a standard 10-fold tumour genome (total 30
gigabases) NGS data. All three programs were tested on a server (based on a 2.13-GHz Intel Xeon Processor E5506 CPU with 4 MB cache, 32 GB memory and 4 TB storage) and on a standard personal
computer (running a 2.66-GHz Intel Core2 Quad Processor Q9400 CPU with 6 MB cache, 6 GB memory and 1 TB storage). On the server using only a single core, GATK took 29,757 s to finish the
job and Bcftools took 19,286 s, whereas FaSD took only 13,484 s, which was 120% faster than GATK and 43% faster than Bcftools (Fig. 3). On the personal computer, FaSD finished the job in
14,042 s, which was 92% faster than GATK and 72% faster than Bcftools. DISCUSSION Our FaSD method could rapidly call SNPs after the NGS data are aligned to the reference genome. FaSD uses a
single score (FaSD_score) to determine the loci’s genotype. For all the experiments, we used a default cutoff of 3.2 for separating AA and AB, and a cutoff of 15.8 for separating AB and BB.
Users can adjust these cutoffs in our program to obtain different numbers of SNPs depending on their purpose. As shown in Supplementary Table S12, a higher cutoff will result in less SNPs
being reported, and vice versa. If the default cutoff of 3.2 is applied, the false positive rate and true positive rate are 0.0011 and 0.83 in the normal data set and 0.0015 and 0.82 for the
tumour data set, respectively. To assess the AUC of each SNP caller, we assigned a SNP locus as class 1, and a non-SNP locus as class 0. The 0/1 ratio is the ratio between the numbers of
loci in class 0 and class 1. The loci were determined to be truly class 0 or class 1 based on the gold standard used. An imbalanced data set could reduce the classification performance and
make the classifications deviate to the prevalent class26,27. The 0/1 ratios of both the normal data set and tumour data set were close to 1 (Supplementary Table S13), indicating little
classification bias in our array-based data sets. Our FaSD algorithm is comprised of two parts, the alternative_score and the mutation probability (equations 1 and 2 in the methods section).
The mutation probability model has been used in many other SNP detection programs. We report here for the first time the use of our unique alternative_score model. To assess the
contributions of these two models to the overall performance of the FaSD method, we evaluated the AUCs separately and in combination from the normal data set benchmarked by the Affymetrix
array. In the 4_5 depth category (Table 5), the combined model had an AUC of 0.973, which decreased by 0.033 to 0.940 when only the mutation probability model was used but only decreased by
0.003 to 0.970 when only the alternative_score model was used, indicating the alternative_score model contributed about 90% to FaSD’s performance. At high depth, the AUC decreased by 0.009
using only the mutation probability model but decreased by 0.001 using only the alternative_score model, indicating the alternative_score contributed about 70–80% to FaSD’s performance.
Similar results were obtained when the two components were evaluated using the Illumina array (Table 5). To assess the effects of different aligners on FaSD’s performance, we used BWA as
alternative aligner for the tumour and normal data set (BWA is the recommended aligner for GATK). On the basis of concordance, we showed that FaSD was the superior method (Supplementary
Table S2). Although with BWA the AUC of GATK increases by about 10% in each sub-category, FaSD still has the largest AUCs (Supplementary Table S14), indicating FaSD’s superior performance
regardless of the aligner. We then assessed the effects of the sequencing platform on FaSD’s performance. We used the six tools to call SNPs from data sequenced using ABI-SOLiD sequencing
platform. With the Affymetrix SNP array as the gold standard, FaSD outperforms all the other programs using the corresponding Serous Cystadenocarcinoma (OV) data set (One tail paired
Wilcoxon test _P_-value <2.2e-16 in each depth category, Fig. 4 and Supplementary Fig. S2). This result confirmed that FaSD SNP calling is reliable even for data from different sequencing
platforms. The developers of GATK proposed a unified analytic framework that included realigning the sequences before SNP calling to reduce the effects of inaccurate base quality scores and
mapping errors23. We adopted this framework for locally realigning regions around indels and for recalibrating the base quality score to check how the pre-process affected the SNP calling
quality. Realignment had significant effects on GATK’s performance, particularly when using the Affymetrix array as the gold standard. Realignment caused GATK’s concordance rates with the
Affymetrix array to increase from 0.839 to 0.912 for normal tissue and increase from 0.875 to 0.930 for tumour tissue. Changes in FaSD performance resulted in a moderate concordance increase
from 0.891 to 0.922 for normal tissue and an insignificant increase from 0.926 to 0.929 for tumour tissue (Tables 1 and 6). On the other hand, realignment with Illumina Array as the gold
standard had an overall negative effect. After realignment, the concordance rates between Illumina and Affymetrix arrays dropped from 0.997 to 0.949 for normal and from 0.996 to 0.942 for
tumour tissues. The effects were most pronounced for Bcftools, dropping from 0.865 to 0.735 for normal and from 0.898 to 0.734 for tumour tissues. For FaSD, changes were 0.882 to 0.864 for
normal and 0.927 to 0.867 for tumour tissues. Both MAQ and SOAPsnp had better concordance rates with the Illumina array after realignment. For MAQ, changes were 0.397 to 0.439 for normal and
0.401 to 0.469 for tumour tissues, and for SOAPsnp, changes were 0.417 to 0.439 for normal and 0.409 to 0.472 for tumour tissues (Tables 1 and 6). We further evaluated the AUC of the
different tools after realignment. We found that FaSD performed better than the other tools regardless of whether the data was pre-processed or not, or whether the Affymetrix or Illumina
array benchmarks were used (Supplementary Tables S15–18). We evaluated the performance of the different tools using the three criteria of concordance rate, AUC and non-reference concordance
rate. These criteria were applied in different situations (Supplementary Table S1). When one of the two callers is used as the benchmark, the concordance rate is used to measure the
proportion of correctly called AA, AB and BB genotypes in the results. The SNP caller must use a specific cutoff for genotype calls, so the concordance will only be valid under this cutoff.
In contrast, AUC measures the overall performance of two classification groups, AA and non-AA (non-SNP and SNP). It is a comprehensive measurement because it is not limited to a specific
cutoff, but it does not distinguish between AB and BB. Therefore, the concordance and AUC measurements may not always be consistent. For example, Bcftools has high concordance rates (Table 1
and Supplementary Table S2) but poor AUC (Supplementary Tables S3 and S4). When a program is applied on genome-wide data, the SNP calling result will be highly unbalanced because the chance
of calling a SNP is less than 1% (predominately AA). Under this situation, the non-reference concordance rate is more appropriate than concordance rate for performance assessment, because
it focus on measuring the quality of called AB and BB genotypes. FaSD can be used as good complementary program to either GATK or Bcftools. The accuracy rate for SNPs called by both FaSD and
Bcftools was the highest at 99.9% (Fig. 2). For SNPs called by both FaSD and GATK, the rate was also high at 99.7%. In contrast, the accuracy is far less for SNPs called by any other two
programs. For example, SNPs called by both FaSD and MAQ (but not by others) had an accuracy rate of 65.6%, and for GATK and Bcftools the accuracy was 46.2%. SNPs called individually by FaSD,
GATK, Bcftools and MAQ had accuracies of 63.3%, 43.3%, 35.9% and 2.0%, respectively. We further investigated SNP loci called uniquely by FaSD and confirmed by both Affymetrix and Illumina
SNP arrays (some examples are shown in Supplementary Figs S3–S5). In general, FaSD made accurate SNP calls even at loci with low-depth reads, with intermediate sequencing quality, and at the
two ends of the read, compared with other programs that failed to make SNP calls. In summary, we recommend using both FaSD with either GATK or Bcftools for SNP calls. If the user requires a
larger number of SNP calls, we suggest using FaSD on its own or FaSD and MAQ combined. The next best option would be to use GATK on its own or GATK and Bcftools combined. The FaSD program
was implemented in C++, which can easily be compiled to run on all platforms. Once the result of alignment is obtained, our model is able to detect SNP sites with high speed based on the
pileup files. The compiled programs for Linux or Windows and demonstration data can be downloaded freely at http://jjwanglab.org/FaSD. METHODS DATA SETS We used NGS data from both a
blood-derived normal sample and GBM tumour sample sequenced in the TCGA project. The reads (Sequence Read Archive (SRA) accession code: SRX006325) of the blood-derived normal sample (TCGA
accession code: TCGA-06-0188-10B-01D-0373-08) were from a male with untreated GBM (TCGA accession code: TCGA-06-0188). The reads (SRX006310) of the GBM tumour sample were from primary tumour
tissue (TCGA-06-0188-01A-01D-0373-08) from the same male with untreated GBM (TCGA-06-0188)19. Both the samples were sequenced on the Illumina Genome Analyzer II platform: the normal sample
was prepared by 2 × 76 bp paired-end library construction (Solexa-8304) and the GBM sample was prepared by 2 × 76 bp paired-end library construction (Solexa-8303). To evaluate NGS data from
the SOLiD platform, reads (SRX015368) from the primary tumour tissue (TCGA-13-0720-01A-01D-0445-10) of a female OV patient (TCGA-13-0720) were used (~6-fold). The sequences, all in fastq
format (csfastq for SOLiD), were extracted from the NCBI database of genotype and phenotype (dbGap) using the SRA toolkit. The raw data obtained using SRA was not filtered or modified
(besides trimming). We merged the results from several runs to reach 30 gigabases at 10 × coverage for each data set. These data sets were also genotyped using Illumina humanhap550
genotyping beadchip array and Affymetrix genome-wide human SNP array 6.0. The genotype data were downloaded from TCGA portal and used as our gold standards. To test the SNP callers’
performance without using SNP arrays as the benchmark, we used data from one Yoruba individual (1,000 genomes accession code: NA19240) with high coverage MAQ alignment data of chromosome
21(39 × ) and 22(40 × ) generated by the pilot 2 phase of 1,000 Genomes Project28. To compare the performance of FaSD on pooled samples with the performance of GATK and Bcftools, we used the
publically available sequencing data from 40 CEU individuals in the pilot 1 phase of 1,000 Genomes Project. All 40 individuals were sequenced to ~4 × coverage genome-wide on a variety of
platforms and from a variety of sequencing centres29. Sequencing data on chromosome 21 of a CEU trio (NA12878, NA12891 and NA12892) out of the 40 individuals was chosen as our evaluation
subjects. This trio was also sequenced to ~30 × coverage genome-wide in the pilot 2 phase of 1,000 Genomes Project. We used MAQ’s SNPs calling result on chromosome 21 of this high-depth
trio, NA12878 (37 × , rounded sequencing depth of chromosome 21), NA12891 (36 × , rounded) and NA12892 (30 × , rounded) as the evaluation benchmark. THE FASD MODEL After obtaining alignments
from pileup file, we used FaSD to call SNPs for each aligned position. A FaSD_score was used to measure the polymorphism probability that a certain locus is a SNP location and to determine
its corresponding genotype. If the FaSD_score was greater than the cutoff score, we called the locus a SNP and gave its corresponding genotype. The FaSD_score was calculated using the
alternative_score and the geometric mean of a mutation probability of reads (equation 1): The alternative_score was calculated according to equation 2. The is the probability of getting a
read genotype when the reference allele is known30. At each position, there could be three possible genotypes: AA, AB and BB. AA is homozygous and matches the reference allele, AB is
heterozygous and BB is homozygous but does not match the reference allele. For positions with depth _N_, _n_ reads will match the reference and the other _N_−_n_ reads will not match the
reference. We assumed that the number of reads matching and not matching the reference will follow binomial distributions. We then calculated the probability of the observed read frequency
for each of the three possible genotypes. If the genotype is AA, then the probability of not matching the reference should be very low (to be consistent with the error rate in the mutation
probability formula we set this to 0.001), and thus the probability of matching the reference should be very high (we set this to be 1–0.001=0.999). If the genotype is AB, the probability of
matching the reference and non-reference should be equal (both set to 0.500). Similarly, if the genotype is BB, the probability of matching the reference should be 0.001 and of matching the
non-reference should be 0.999 (equation 2). We then used the probability mass function of binomial distributions to calculate the joint probability of all _N_ reads. We then compared the
joint probabilities from all three possible genotypes. The genotype with the highest probability was selected and the alternative_score was assigned (equation 2). The three different
binomial distributions corresponding to AA, AB and BB were assigned the _P_ parameter 0.001, 0.500 and 0.999, respectively. We then checked whether these parameters fitted our data. Taking
into account the possible flaws in the sequencing, alignment or construction of the data sets, the parameters for the three binomial distributions appeared to be acceptable. The assigned
alternative_score of 0, 1 and 2 represents the number of loci that are different from the reference allele for two allele loci. Positions with genotype AB or BB are considered as SNP
locations. _N_ is the depth of the reads, and _m_ is the occurrence of reference allele at the position. We added a pseudo_score to avoid an alternative_score of 0. By default, we set the
pseudo_score to 0.01. The alternative_score depends on which one of the three possible genotypes/models (reference homozygote, non-reference homozygote, and heterozygote) explain the data
the best. For example, if the locus has a total of five reads, with three Gs and two Cs, and the corresponding reference is G: the probability of getting the above reads with the reference
homozygote model is ; the probability for the heterozygote model is ; the probability for the non-reference homozygote model is . We choose the heterozygote model because it has the highest
probability of 0.31, and we assign an alternative_score=1+0.01=1.01. Using equation 1, we obtain a FaSD_score of 5.07, which is between our default cutoffs of 3.2 and 15.8, so we assign
heterozygous genotype GC to this locus. The estimated SNP rate between two distinct human haploid chromosomes has been reported to be close to 0.001 (30), and transitions are almost four
times more frequent than transversions among substitutions31. The different frequencies of transitions and transversions mean they would have different contributions to the SNP calling. To
discriminate these contributions, we integrated a for each read into our final FaSD_score. We calculated the SNP rate and transition/transversion ratio in our GBM tumour and normal data
sets, and found similar ratios (data not shown). Therefore, we used the above reported values to calculate (Supplementary Table S19). For each read, we compared the base at current loci with
the reference allele to obtain a . From this table, we calculated the geometric mean of the mutation probability using equation 1. We incorporated the effects of transitions and
transversions into our FaSD model. The average of log-odd of all the _N_ reads was obtained, and the product of this value with the alternative_score was combined to form a FaSD_score, which
was used to call SNPs. The higher the FaSD_score, the more likely a site is a SNP position. The default cutoffs of FaSD are determined mathematically. Because different types of errors such
as sequencing or mapping errors during NGS could raise the FaSD_score of a non-SNP site, we suggest the use of a cutoff value higher than the default to remove false positives, especially
with low quality sequencing data. A user interface for setting the user-specific cutoff has been implemented in our FaSD program. The model has the ability to handle both the individual data
sets and the pooled data sets. PERFORMANCE EVALUATION USING SNP ARRAYS We used Illumina and Affymetrix SNP arrays as gold standards to evaluate the performance of FaSD and other tools. We
excluded all sites whose depths were lower than 4. The quality score is absent for the Illumina HumanHap550 Genotyping BeadChip data, so we accepted all the genotype entries. The Affymetrix
genome-wide human SNP array 6.0 provides confidence scores for genotype quality using the Birdseed algorithm. Here, we chose the high-quality SNP probes as our test data set by removing the
probes with confidence scores above 0.018. For SOAPsnp and MAQ, we assigned the Phred-scaled probability that the genotype is identical to the reference, the so called ‘SNP quality’ as the
predictor. There are several possibilities for the called genotypes: the reference homozygote, the non-reference homozygote, heterozygote and others. For the ROC curve and AUC calculations,
we assigned the reference homozygote genotype as 0, and all other genotypes as 1. SNVmix2 outputs three genotypes, namely homozygous to reference (AA), heterozygous genotype (AB) and
homozygous to the non-reference (BB). We considered AB and BB genotypes as a SNP, we added the probabilities of these two genotypes (AB and BB) together to get the ‘SNP probability’ as the
predicator. The GATK’s UnifiedGenotyper and Bcftools generate SNP calls in the VCF format; the QUAL column is the ‘SNP quality’ and can be used as our predicator. For all callers mentioned
above, the different values of predictor were used to draw the ROC curve, whereas the FaSD_score was used for FaSD. To test the stability of each software, we performed 1,000 times’
bootstrap and obtained 1,000 AUC for each software. We then used Wilcoxon test to determine whether FaSD performed better than the other tools. THE GENOTYPE CONCORDANCE AND NON-REFERENCE
CONCORDANCE To measure the reliability of the different software/platforms for genotypes called from all SNPs (not limited to SNPs in Illumina and Affymetrix arrays), we determined genotype
concordances among tools. Before the calculation of concordance, we restricted the tested loci to be the loci which has been genotyped in benchmark and whose depth were higher than 3 in the
test alignment file to facilitate the reliability of the concordance result. Because GATK and Bcftools only report non-reference sites, we assigned genotype AA, the reference homozygous, to
the loci which are not listed in SNP calling result of the above two tools. The non-reference concordance is measured in the similar way but excludes the concordant AA genotype because they
are usually huge in number and easily detectable, but will greatly influence the measurement. ADDITIONAL INFORMATION HOW TO CITE THIS ARTICLE: Xu, F. _et al._ A fast and accurate SNP
detection algorithm for next-generation sequencing data. _Nat. Commun._ 3:1258 doi: 10.1038/ncomms2256 (2012). ACCESSION CODES ACCESSIONS SEQUENCE READ ARCHIVE * SRX006325 REFERENCES * Ng P.
C. & Henikoff S. Predicting the effects of amino acid substitutions on protein function. _Annu. Rev. Genomics Hum. Genet._ 7, 61–80 (2006). Article CAS Google Scholar * Kim B. C. et
al. SNP@Promoter: a database of human SNPs (single nucleotide polymorphisms) within the putative promoter regions. _BMC Bioinformatics_ 9, Suppl 1S2 (2008). Article Google Scholar * Yang
J. O., Kim W. Y. & Bhak J. ssSNPTarget: genome-wide splice-site single nucleotide polymorphism database. _Hum. Mutat._ 30, E1010–E1020 (2009). Article Google Scholar * Hariharan M.,
Scaria V. & Brahmachari S. K. dbSMR: a novel resource of genome-wide SNPs affecting microRNA mediated regulation. _BMC Bioinformatics_ 10, 108 (2009). Article Google Scholar * Venter
J. C. et al. The sequence of the human genome. _Science_ 291, 1304–1351 (2001). Article CAS ADS Google Scholar * Lander E. S. et al. Initial sequencing and analysis of the human genome.
_Nature_ 409, 860–921 (2001). Article CAS ADS Google Scholar * Frazer K. A. et al. A second generation human haplotype map of over 3.1 million SNPs. _Nature_ 449, 851–861 (2007). Article
CAS ADS Google Scholar * Altshuler D. et al. A haplotype map of the human genome. _Nature_ 437, 1299–1320 (2005). Article Google Scholar * Shendure J., Mitra R. D., Varma C. &
Church G. M. Advanced sequencing technologies: methods and goals. _Nat. Rev. Genet._ 5, 335–344 (2004). Article CAS Google Scholar * Wang W. X., Wei Z., Lam T. W. & Wang J. W. Next
generation sequencing has lower sequence coverage and poorer SNP-detection capability in the regulatory regions. _Sci. Rep-UK_ 1, 55 (2011). Article Google Scholar * Morin R. et al.
Profiling the HeLa S3 transcriptome using randomly primed cDNA and massively parallel short-read sequencing. _Biotechniques_ 45, 81–94 (2008). Article CAS Google Scholar * Li H., Ruan J.
& Durbin R. Mapping short DNA sequencing reads and calling variants using mapping quality scores. _Genome Res._ 18, 1851–1858 (2008). Article CAS Google Scholar * Li R. et al. SNP
detection for massively parallel whole-genome resequencing. _Genome Res._ 19, 1124–1132 (2009). Article CAS Google Scholar * Li R., Li Y., Kristiansen K. & Wang J. SOAP: short
oligonucleotide alignment program. _Bioinformatics_ 24, 713–714 (2008). Article CAS Google Scholar * Goya R. et al. SNVMix: predicting single nucleotide variants from next-generation
sequencing of tumors. _Bioinformatics_ 26, 730–736 (2010). Article CAS Google Scholar * Li H. et al. The Sequence Alignment/Map format and SAMtools. _Bioinformatics_ 25, 2078–2079 (2009).
Article Google Scholar * McKenna A. et al. The Genome Analysis Toolkit: a MapReduce framework for analyzing next-generation DNA sequencing data. _Genome Res._ 20, 1297–1303 (2010).
Article CAS Google Scholar * Malhis N. & Jones S. J. High quality SNP calling using Illumina data at shallow coverage. _Bioinformatics_ 26, 1029–1035 (2010). Article CAS Google
Scholar * Chin L. et al. Comprehensive genomic characterization defines human glioblastoma genes and core pathways. _Nature_ 455, 1061–1068 (2008). Article ADS Google Scholar * Altshuler
D. L. et al. A map of human genome variation from population-scale sequencing. _Nature_ 467, 1061–1073 (2010). Article ADS Google Scholar * Hindorff L. A. et al. Potential etiologic and
functional implications of genome-wide association loci for human diseases and traits. _Pro. Natl Acad. Sci. USA_ 106, 9362–9367 (2009). Article CAS ADS Google Scholar * Wei Z., Wang W.,
Hu P. Z., Lyon G. J. & Hakonarson H. SNVer: a statistical tool for variant calling in analysis of pooled or individual next-generation sequencing data. _Nucleic Acids Res._ 39, (2011).
* DePristo M. A. et al. A framework for variation discovery and genotyping using next-generation DNA sequencing data. _Nat. Genet._ 43, 491 (2011). Article CAS Google Scholar * Nielsen
R., Paul J. S., Albrechtsen A. & Song Y. S. Genotype and SNP calling from next-generation sequencing data. _Nat. Rev. Genet._ 12, 443–451 (2011). Article CAS Google Scholar * Browning
B. L. & Yu Z. X. simultaneous genotype calling and haplotype phase inference improves genotype accuracy and reduces false positive associations for genome-wide association studies.
_Genet. Epidemiol._ 33, 783–783 (2009). Google Scholar * Visa S. R. _A. in IEEE Conference on Fuzzy Systems_ 749–754IEEE (2005). * Weiss G. M. & Provost F. Learning when training data
are costly: the effect of class distribution on tree induction. _J. Artif. Intell. Res._ 19, 315–354 (2003). Article Google Scholar * Via M., Gignoux C. & Burchard E. G. The 1000
Genomes Project: new opportunities for research and social challenges. _Genome Med._ 2, 3 (2010). Article Google Scholar * Langmead B., Trapnell C., Pop M. & Salzberg S. L. Ultrafast
and memory-efficient alignment of short DNA sequences to the human genome. _Genome Biol._ 10, R25 (2009). Article Google Scholar * Sachidanandam R. et al. A map of human genome sequence
variation containing 1.42 million single nucleotide polymorphisms. _Nature_ 409, 928–933 (2001). Article CAS ADS Google Scholar * Zhao Z. & Boerwinkle E. Neighboring-nucleotide
effects on single nucleotide polymorphisms: a study of 2.6 million polymorphisms across the human genome. _Genome Res._ 12, 1679–1686 (2002). Article CAS Google Scholar Download
references ACKNOWLEDGEMENTS This work was supported by funding from the Research Grants Council (781511M, 778609M, N_HKU752/10, AoE M-04/04), Food and Health Bureau (10091262) of Hong Kong,
NSFC of China (91229105) and the University of Hong Kong (10401206 and Genomic SRT). AUTHOR INFORMATION Author notes * Feng Xu and Weixin Wang: These authors contributed equally to this
work. AUTHORS AND AFFILIATIONS * Department of Biochemistry, LKS Faculty of Medicine, The University of Hong Kong, Hong Kong, China Feng Xu, Weixin Wang, Panwen Wang, Mulin Jun Li &
Junwen Wang * Shenzhen Institute of Research and Innovation, The University of Hong Kong, Shenzhen, China Feng Xu, Weixin Wang, Panwen Wang, Mulin Jun Li & Junwen Wang * Centre for
Genomic Sciences, LKS Faculty of Medicine, The University of Hong Kong, Hong Kong, China Pak Chung Sham & Junwen Wang * Department of Psychiatry, LKS Faculty of Medicine, The University
of Hong Kong, Hong Kong, China Pak Chung Sham * State Key Laboratory in Cognitive and Brain Sciences, The University of Hong Kong, Hong Kong, China Pak Chung Sham * HKU-BGI Bioinformatics
Algorithms and Core Technology Research Laboratory, The University of Hong Kong, Hong Kong, China Junwen Wang Authors * Feng Xu View author publications You can also search for this author
inPubMed Google Scholar * Weixin Wang View author publications You can also search for this author inPubMed Google Scholar * Panwen Wang View author publications You can also search for this
author inPubMed Google Scholar * Mulin Jun Li View author publications You can also search for this author inPubMed Google Scholar * Pak Chung Sham View author publications You can also
search for this author inPubMed Google Scholar * Junwen Wang View author publications You can also search for this author inPubMed Google Scholar CONTRIBUTIONS Concept, design and method
development (F.X., P.C.S. and J.W.); data preparation, pipeline design and performance evaluation (W.W., F.X. and J.W.); program implementation and algorithm optimization (F.X., P.W. and
M.J.L.); and manuscript writing and editing (F.X., W.W., P.C.S. and J.W.). CORRESPONDING AUTHOR Correspondence to Junwen Wang. ETHICS DECLARATIONS COMPETING INTERESTS The authors declare no
competing financial interests. SUPPLEMENTARY INFORMATION SUPPLEMENTARY INFORMATION Supplementary Figures S1-S5, Supplementary Tables S1-S19 and Supplementary Methods (PDF 385 kb) RIGHTS AND
PERMISSIONS Reprints and permissions ABOUT THIS ARTICLE CITE THIS ARTICLE Xu, F., Wang, W., Wang, P. _et al._ A fast and accurate SNP detection algorithm for next-generation sequencing data.
_Nat Commun_ 3, 1258 (2012). https://doi.org/10.1038/ncomms2256 Download citation * Received: 12 July 2012 * Accepted: 05 November 2012 * Published: 04 December 2012 * DOI:
https://doi.org/10.1038/ncomms2256 SHARE THIS ARTICLE Anyone you share the following link with will be able to read this content: Get shareable link Sorry, a shareable link is not currently
available for this article. Copy to clipboard Provided by the Springer Nature SharedIt content-sharing initiative