Play all audios:
ABSTRACT Lipid microdomains are postulated to regulate many membrane-associated processes but have remained highly controversial. Here we provide the first direct evidence that the plasma
membrane of intact, live cells is comprised of a sub-resolution mixture of approximately 76% ordered and 24% disordered lipid domains, which correspond to liquid-ordered and -disordered
model membranes. These measurements were based on the unmixing of fluorescence lifetime decays (phasor analysis) obtained from environmentally sensitive membrane dyes that report the degree
of lipid packing. Using the transmembrane protein Linker for Activation of T cells (LAT) as an example, we demonstrate that association with ordered domains retarded LAT diffusion and
decreased clustering in meso-scaled protein domains as analysed by super-resolution microscopy. Our data therefore propose a membrane model in which the majority of the plasma membrane is
covered by cholesterol-dependent, ordered lipid domains that contribute to the non-random distribution and diffusion of membrane constituents. You have full access to this article via your
institution. Download PDF SIMILAR CONTENT BEING VIEWED BY OTHERS A DYNAMIC PARTITIONING MECHANISM POLARIZES MEMBRANE PROTEIN DISTRIBUTION Article Open access 30 November 2023 MAPPING
MEMBRANE BIOPHYSICAL NANO-ENVIRONMENTS Article Open access 07 November 2024 INVESTIGATION OF NANO- AND MICRODOMAINS FORMED BY CERAMIDE 1 PHOSPHATE IN LIPID BILAYERS Article Open access 30
October 2023 INTRODUCTION The lipid raft hypothesis postulates the existence of cholesterol (Chol)-enriched, ordered-phase lipid domains in cell membranes1. As demonstrated for model
membranes2, liposomes reconstituted from cell lipids3 and plasma membrane vesicles and spheres4,5,6, the lipid bilayer can separate into two distinct liquid phases known as the
liquid-ordered and -disordered phases2. Membrane proteins with a differential affinity for lipid domains can therefore be laterally sorted7. However, large-scale lipid-phase separation has
not been observed in native cell membranes, raising the question whether stable lipid rafts exist in this environment8,9,10. It has therefore been suggested that lipid rafts must be below
the resolution of optical microscopes and/or transient in nature1. Analysis of the localization11, oligomerization12,13, transient confinement14 and diffusion properties15,16 of membrane
proteins have been interpreted in this context1, although other explanations have also been provided, such as nanoclusters and proteins islands17, confinements by the actin cytoskeleton18
and membrane topography19. The difficulties in providing direct evidence for lipid domains are twofold. First, lipid organization is best observed in live cells because fixation can induce
artifacts20, but the resolution of optical microscopy is limited. Second, the assumption has to be made that fluorescent lipid analogues behave identically to native lipids. Here we use
common membrane dyes that report lipid packing of the surrounding bilayer in model and cell membranes6,21,22: Laurdan and di-4-ANEPPDHQ. Laurdan, a derivative of Prodan, displays a spectral
red shift in emission between the liquid-ordered and -disordered phases, as well as a shortening of its fluorescence lifetime. These shifts are due to the differential penetration of polar
water molecules into the non-polar bilayer in the two phases. The probe di-4-ANEPPDHQ shows similar environmental sensitivity to Laurdan23,24. In numerous previous studies, the spectral
shifts were quantified in a normalized intensity ratio, known as generalized polarization (GP)22. Here we analysed the fluorescence lifetime shifts with the phasor approach to fluorescence
lifetime imaging microscopy (FLIM) data, which unmixes multi-exponential lifetime decay components of the fluorescence signal in each pixel25,26. The phasor approach is a model-free
assessment of the composition of fluorescence decays without any _a priori_ assumptions of the number of decay components. When applied to FLIM data of membrane-order sensing dyes, it is
therefore possible to evaluate in an unbiased manner whether cellular membranes have a homogenous lipid order or are mixtures of different lipid-order microenvironments in each pixel.
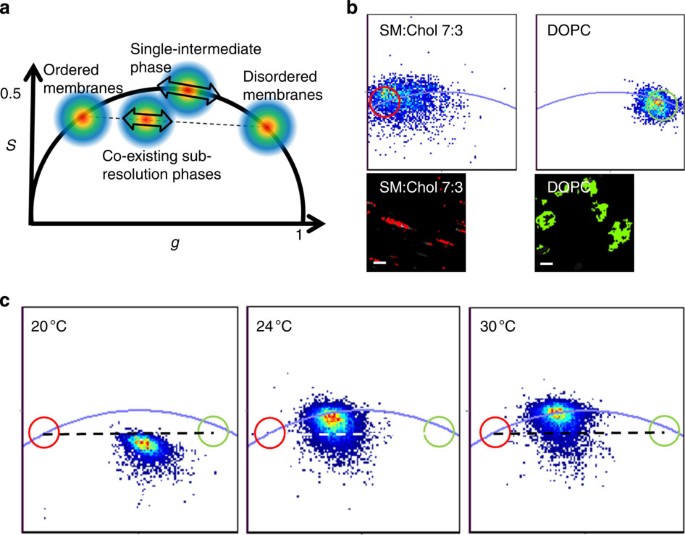
RESULTS PHASE SEPARATION IN MODEL AND CELL MEMBRANES To demonstrate the suitability of the Laurdan FLIM/phasor approach, we first recorded FLIM data from Laurdan-stained lipid vesicles. The
data were converted into the frequency domain and plotted on a phasor plot26, which is a vector-like two-dimensional histogram of sine-cosine transformed lifetime decays from each pixel
(Fig. 1a). If the membrane dye exhibits single-exponential lifetimes from homogenous lipid environments, the values must lie on the universal circle, whereas multi-exponential decays from a
mixture of two or more of these lipid environments lie inside the circle. For a double-exponential decay from two single-exponential profiles, the data must lie on a chord intercepting the
universal circle at the individual two lifetimes (Fig. 1a). Laurdan’s fluorescence decay (when excited at 405 nm and detected through a 430 nm long-pass filter) from homogenous membranes
composed of 100% dioleoylphosphatidylcholine (DOPC), and of 70% palmitoylsphingomyelin (SM) and 30% Chol (SM:Chol 7:3), which reside in the liquid-disordered and -ordered phases,
respectively27, lie on or near to the universal circle (Fig. 1b), indicating that the decays were close to single exponential under these conditions. Data from a lipid mixture (SM:DOPC:Chol
1:1:1) that undergoes phase separation between 20 and 30 °C were close to the chord connecting the positions of the pure liquid-ordered and -disordered phases at low temperature, indicating
the co-existence of lipid phases. At high temperature, the signal is mono-exponential, indicating a homogenous phase of intermediate order (Fig. 1c). We next imaged live HeLa cells with a
confocal FLIM setup at a focal plane where both the plasma membrane and intracellular membranes were visible (an equatorial confocal section, Fig. 2). The lifetime values of Laurdan and
di-4-ANEPPDHQ obtained from these images fell on the chord connecting the pure liquid-ordered (red) and -disordered (green) phases (Fig. 2a, Supplementary Fig. S1). We quantified the
alignment of Laurdan FLIM signals with the chord by extracting the _g_ and _S_ coordinates of the centre of the distribution of data points that correspond to pure liquid-ordered phases,
-disordered phases, the plasma membrane and intracellular membrane. These four coordinates can be fitted to a straight line with an _R_2=0.9003. This strongly indicates that in cell
membranes, order-sensitive dyes exhibited a double-exponential decay representing two distinct lipid phases, and not a homogenous phase of intermediate order. Thus, cell membranes are a
mixture of two immiscible lipid environments corresponding to the two classic liquid-ordered and -disordered phases that have been observed in artificial membranes. This is the first direct
evidence that two phases co-exist on sub-resolution length scales in native cell membranes, despite the absence of large, microscopically visible lipid domains. When we selected a
region-of-interest (blue circle, Fig. 2a) in the phasor plot and marked the pixels from which those signals were derived in the cell image (blue pixels in Fig. 2a), we observed that the
centre of the region-of-interest that corresponds to the plasma membrane (Fig. 2a) was at a position 76±6% (_n_=19 cells) along the chord that connects pure ordered-phase membranes (100%)
and disordered-phase membranes (0%). This means that for the plasma membrane, on average 76% of detected photons derived from ordered-phase membranes. As Laurdan partitions approximately
equally between the two phases6 and assuming a similar quantum yield, the data demonstrate that the majority of the plasma membrane resides in the ordered phase. We reached a similar
conclusion when sparsely seeded cells were imaged at higher magnification (Supplementary Fig. S2) or when the basal plasma membrane adjacent to the glass coverslip was analysed
(Supplementary Fig. S3). To achieve such high coverage, ordered domains either have a large range of sizes to enable close packing of domains or disordered domains exist in a continuous,
percolating liquid-ordered phase. This is contrary to classical models, although similar models were reported previously. The first model was proposed for rabbit red blood cells with ordered
domains ranging from 25 to 300 nm in diameter28, whereas the later conclusion was made for the apical membranes of polarized epithelial cells29 and plasma membrane-derived vesicles30. In
contrast, intracellular membranes contain only 49±16% (_n_=19 cells) ordered membranes (Fig. 2b). Next, we treated the cells with methyl-β-cyclodextrin (mβCD), which removes cellular Chol,
or 7-ketocholesterol (7KC), which reduces membrane order31 (Fig. 2d). As expected, mβCD treatment lowered the percentage of the fluorescence derived from the ordered phase from 76±6% to
70±3% (_P_<0.05), indicating that the ordered-phase domains are indeed Chol-dependent. Similarly, 7KC caused the phasor plot data to move along the chord towards the pure disordered
phase. This represents a conversion of areas of ordered phase to a disordered state, rather than the generation of any intermediate state or an effect on disordered regions themselves.
Hence, 7KC is a potent agent to modulate raft coverage, lowering the ordered-phase-derived fluorescence to 23±11% (_n_=6 cells) of the total signal without affecting cell viability31.
ASSOCIATION WITH ORDERED PHASES RETARDS LAT DIFFUSION The existence and abundance of ordered lipid domains raises the question of whether they modulate protein behaviour. Hence, we
simultaneously recorded membrane order from Laurdan’s emission profile and protein diffusion using fluorescence correlation spectroscopy (FCS) (Fig. 3). We selected the transmembrane protein
LAT as our protein of interest because its two palmitoylation sites are thought to target it to ordered membranes32. This (to our knowledge, first) quantitative correlation between membrane
order and protein diffusion showed a statistically significant negative correlation for wild-type LAT (WT LAT, −0.45, _P_<0.0063) but not for a palmitoylation-deficient mutant (CS LAT;
−0.09, _P_>0.05; Fig. 3a). These correlations were not due to manipulations of the local membrane order by the LAT variants as the mean GP values in the plasma membrane remain unchanged
at 0.41±0.09 and 0.41±0.04 (_P_>0.05) for cells expressing WT and CS LAT, respectively (Supplementary Fig. S4). The data therefore indicate that for WT LAT, diffusion is significantly
hindered in higher-order membrane regions. The interactions of LAT with raft domains are facilitated by the palmitoylation groups because CS LAT diffusion was insensitive to membrane order
(Fig. 3a). Importantly, interactions with sub-resolution lipid domains also influences ensemble measurements, as demonstrated by fluorescence recovery after photobleaching of WT LAT and CS
LAT (Supplementary Fig. S5). To show that the diffusion of WT LAT is indeed dependent on membrane order, we manipulated the abundance of higher-order membrane domains by treating cells with
7KC. As anticipated, 7KC treatment resulted in an increase in the diffusion coefficient of WT LAT (from 0.78±0.33 to 1.18±0.20 μm2 s−1, _P_<0.05) but not for CS LAT (_P_>0.05). The
loss of ordered domains by 7KC treatment also reduced the correlation coefficient for both WT LAT and CS LAT (Fig. 3b), so that there is no significant difference in diffusion coefficient
between WT LAT and CS LAT (_P_>0.05), and neither of the two diffusion coefficients are dependent on the degree of membrane order. These data therefore indicate that higher-order lipid
domains retard WT LAT diffusion. LIPID PHASES REGULATE LAT CLUSTERING To determine whether the modulation of diffusion caused by lipid domains is functionally important, we assessed LAT
distributions and quantified the degree of clustering into meso-scaled domains that facilitate signal transduction17. We employed super-resolution photoactivated localization microscopy
(PALM) to obtain molecular coordinates of WT LAT and CS LAT with <50 nm precision, removed repeatedly excited molecules (Supplementary Fig. S6) and calculated quantitative cluster maps
(Fig. 4a) as previously performed11,33. The Ripley’s _K_-function curves (Fig. 4b) and the corresponding cluster parameters (Fig. 4d) show significant clustering above a random distribution
in all tested conditions. WT LAT was significantly less clustered than CS LAT in untreated cells or when compared with WT LAT in 7KC-treated cells. Hence, contrary to the notion that rafts
are assembly platforms, the interaction of WT LAT with ordered lipid domains not only retards its diffusion but also limits the degree of meso-scaled clustering. In contrast to WT LAT, 7KC
treatment decreased clustering of CS LAT. This behaviour can be explained if the accessible membrane area is considered because CS LAT may be forced to aggregate in the low-abundance
disordered phases in untreated cells, which expand upon 7KC treatment. In summary, we propose a membrane model where the majority of plasma membrane is covered by ordered membranes that
differentially regulate the diffusion and clustering of LAT variants (Fig. 5). DISCUSSION We demonstrated that the phasor approach to FLIM data analysis25,26 is able to unmix the signals
from ordered and disordered phases in cellular membranes that were stained with Laurdan or di-4-ANEPPDHQ. This method has several advantages over other approaches that can also be used to
measure membrane order. Unlike the quantification of the generalized polarization (GP)22, the phasor approach can distinguish between a mixture of immiscible phases and a homogenous
environment with intermediate order. And unlike spectral unmixing or fitting multi-exponential FLIM data, it requires no _a priori_ knowledge of the number of components that need to be
unmixed26. In other words, in our analysis, there is no assumption that the membrane is a two-component system. However, there are also limitations that this approach cannot overcome. For
example, the phasor analysis does not provide information about domain size and distribution, other than that the domains are smaller than the diffraction limit; and hence, the geometry of a
two-component system is not known. In addition, acquisition speed for FLIM data is generally slower than for spectral imaging, making it difficult to study dynamic processes or measure the
lifespan of domains and fluctuations. It should also be noted that phase separation reported by lipid-packing sensing dyes does not exclude the possibilities of domains that are formed by
other principles such as membrane charges34,35 and electrostatic interactions36,37. Our data clearly demonstrate that sub-resolution phases exist in live cell membranes. These phases
correspond to the classical liquid-ordered and -disordered phases that have been observed in artificial membrane systems. Contrary to the classical lipid raft hypothesis, we found that the
majority of the plasma membrane resides in the liquid-ordered phase. Similar observations have been made previously using phase-partitioning dyes in vesicles composed of plasma membrane
lipids30. The raft-majority membrane may constitute a dense array of ordered-phase domains, such as proposed for rabbit red blood cells, in a recent study that employed fluorescence
fluctuation analysis of Laurdan28, or a percolating raft phase containing disordered-phase domains (Fig. 5a) as suggested for the apical membranes of polarized epithelial cells29 and CHO
cells28. It is possible that the plasma membrane of cells can switch between these configurations based on temperature or activation status, for example, during signalling. This would
constitute a novel compartmentalization process that may not be dependent on large-scale changes in the lipid composition but more importantly, would be reversible. For example, membrane
condensation was observed at T-cell activation sites21 and immunological synapses38, and it is such high membrane order that supports the formation of T-cell receptor microclusters and
T-cell activation31. Hence, it is possible that high membrane order at these sites is caused by the delivery of sub-synaptic vesicles33,39, an increase in coverage of ordered phases in the
plasma membrane or large-scale lipid-phase separation. The latter is more unlikely because T-cell activation sites are regions of highly dynamic actomyosin activity, which may cause the
ordered phase to fracture into discreet domains in an ‘active’ energy-dependent process40. More detailed mapping of the coverage of lipid phases and/or domain sizes, possibly in conjunction
with stimulated emission depletion15 and Laurdan GP fluctuation analysis28, may reveal a more complex regulation of lipid domain geometries than previously thought. One of the central tenets
of the lipid raft hypothesis is the ability of microdomains to cluster raft-favouring proteins, and thereby facilitate protein–protein interactions. We observed that ordered lipid domains
are not only the dominant phase in the plasma membrane, but that association with these domains retards diffusion and is likely to randomize the distributions of these proteins. In the case
of LAT, the protein that was associated with the dominant phase, that is, WT LAT in non-treated cells and CS LAT in 7KC-treated cells, was more randomly distributed compared with its
counterpart in the minor phase (Fig. 5). It is possible that the higher clustering observed for the faster diffusing species, for example, CS LAT in control cells, may be in part the result
of fewer collisions between the molecules. If association with dominant versus minor phase is a general rule for protein distribution, it will be important to map the driving forces for
phase coverage and phase association in intact cells. In the case of T-cell activation, phase partitioning of signalling proteins and the geometry of lipid domains may hold the key to which
receptor interactions are prevented or ‘inhibited’ in resting cells and ‘allowed’ in activated cells, simply through spatial reorganization17. It is apparent that the abundance or surface
coverage of ordered lipid phases we measured does not match the abundance of protein domains that have been reported previously, which range from nano-scaled complexes12 to meso-scaled
clusters11,33 and islands17. Although lipid domains contribute to the regulation of protein clustering (see effect of 7KC treatment in Fig. 4), additional factors including weak and strong
protein–protein interactions41, confinement by the actin cytoskeleton18 and actomyosin driven flow40 must also be responsible for protein distributions. The combinations of various
mechanisms of membrane compartmentalization may yield a diverse range of membrane structures scaling from nano-scaled lipid and protein complexes12,41 to meso-scaled domains and long-range
networks42. It is also possible that these membrane-organizing forces are interlinked, so that protein networks, for example, may position lipid phases, which in turn regulate protein
diffusion and localization. It is equally possible that other compartmentalization mechanisms facilitate the switch between dense array of lipid domains of various sizes and a percolating
ordered phase that is discussed above. In summary, we propose that lipid phases ought to be integrated into a holistic view of membrane organization43, for which the phasor analysis of FLIM
data of membrane–order sensing dyes provides an experimental basis. METHODS SAMPLE PREPARATION HeLa cells were cultured in DMEM media (Gibco) in 10% fetal calf serum at 37 °C and 5%
humidity. For FCS, cells were transfected with mCherry fusion proteins of WT LAT or a non-palmitoylated LAT mutant (CS LAT) using Lipofectamine LTX (Invitrogen) and imaged 24 h after
transfection. Cells were left untreated or treated with either 25 μM 7KC complexed to mβCD for 30 min at 37 °C or with unloaded 5 mM mβCD for 20 min. For PALM, cells were transfected with
human WT LAT-mEOS2 and the CS-mutant of LAT fused to mEOS2 (33). For FLIM and FCS measurements, cells were stained with 5 mM Laurdan or di-4-ANEPPDHQ (both Invitrogen) by adding 2 μl of a 5
mM stock in dimethylsulphoxide (DMSO) to the media22. For PALM, cells were fixed with 4% paraformaldehyde for 30 min at 37 °C. Lipid bilayers were formed by drying mixtures of DOPC, SM and
Chol in chloroform, followed by hydration in PBS in a sonicating water bath at 37 °C. FLIM MEASUREMENTS AND PHASOR PLOTTING FLIM measurements were acquired using a Picoquant Microtime200
inverted confocal microscope with a X63 1.2 numerical aperture (NA) water-immersion objective. Laurdan was excited using a 405 nm diode laser at a repetition rate of 40 MHz. Fluorescence was
detected though a 430 nm long-pass filter using a single-photon avalanche diode (PDM, MPD, Bolzano, Italy) and PicoHarp300 TCSPC electronics. Fluorescein solution was used as a calibration
sample. Data were imported into Globals Software (SimFCS 2.0 LFD; Irvine, CA) and displayed as a phasor plot (plot of _S_ against _g_) as previously described26 by applying the
transformations: Where _ω=2πf_ and _f_ is the laser repetition rate, and _I(t)_ is the fluorescence intensity at time _t_. On a plot of _g_ against _S_ (a phasor plot), a single-exponential
decay lies on a semicircle centred on (_g_,_S_)=(0.5,0) and with radius 0.5. Double-exponential decays lie on a chord connecting the two single-exponential positions. DETAILS ON FCS SETUP
AND FITTING FCS measurements were acquired using a Picoquant Microtime200 confocal microscope equipped with a X63 1.2 NA water-immersion objective. Laurdan was excited by a diode laser
operating at 405 nm. Laurdan Fluorescence was separated into 2-channels using a 458 nm long-pass dichroic followed by band-pass filters. Intensity values in each channel were then used to
calculate the Laurdan generalized polarization (GP) value using equation 3: Where _I_ represents the intensity in each channel and _G_ is a calibration factor calculated using equation 4:
Where GPmes is the measured GP value of Laurdan in DMSO and GPref is a reference value for Laurdan in DMSO, defined to be GPref=0.207. 405 and 532 nm lasers for mCherry excitation were used
in a pulsed-interleaved excitation configuration at a total excitation rate of 40 MHz. This eliminated cross-talk between the Laurdan and mCherry channels caused by spectral bleedthrough.
mCherry fluorescence was also spectrally separated from the Laurdan signal using a 580-nm short-pass dichroic and a 581–653 nm band-pass filter. Fluorescence lifetime correlation
spectroscopy of the time-correlated single-photon counting data was used to weight photons according to their arrival time to eliminate correlations due to after-pulsing from the detector.
After correction, FCS curves were fitted to a two-dimensional Brownian diffusion model, and the diffusion coefficient was extracted using Picoquant SymPhoTime software. Rhodamine in water at
room temperature was used as an FCS calibration standard. PALM AND CLUSTER ANALYSIS PALM images of WT LAT-mEos2 and CS LAT-mEos2 were acquired on a Zeiss Elyra PS1 microscope with a X100
1.46 NA oil-immersion objective. Photoconversion of mEOS2 was achieved by irradiation with a 405 nm laser. The converted form was excited at 561 nm. A total of 15,000 frames with an exposure
time of 30 ms were recorded on an electron multiplying CCD camera (iXon DU-897D; Andor). Recorded images were analysed using Zen 2010D (Carl Zeiss MicoImaging). The software fits a
two-dimensional Gaussian distribution to each detected event, thereby determining the centre of each point spread function (PSF) along with the localization precision. Sample drift during
the acquisition was corrected for by tracking several immobile, 100 nm gold fiducial markers. The data were filtered to remove molecules with localization precisions >50 nm and molecules
that were repeatedly excited during the acquisition process, as previously described44,45,46 (Supplementary Fig. S6). Spatial point patterns were analysed using Ripley’s K-function47,
calculated using SpPack48 as equation 5: Here, _n_ is the number of points contained in a field-of-view of area _A_ (a 3 × 3 μm2 square area). _d__ij_ is the distance between two points _i_
and _j_ and _r_ is the analysed spatial scale. This function is a measure of the number of points, _j_, encircled within concentric circles of radius _r_ centred on each point _i_. The
K-function scales with circle area, and for a completely spatially random (CSR) case, scales linearly with area. It is therefore transformed into the L-function, such that scaling is linear
with radius, _r_ using equation 6: For a CSR case, it follows that _L(r)=r_ at all radii. A plot of _L(r)_−_r_ versus _r_, therefore has _L(r)−r=zero_ at all _r_ for a CSR distribution. If
more points have been encircled at a given radius than would have been expected of a random distribution, _L(r)−r_ is positive, and the points are clustered. The 99% confidence intervals for
cluster detection were calculated by simulating 100 CSR distributions with the same average molecular density as the data. Edge effects in the analysis were corrected for by weighting edge
points accordingly. To construct cluster maps, we performed Getis and Franklin’s analysis where the value of _L(r)_ is calculated for each point, _j_, individually at a specific spatial
scale, here, 50 nm. A quantitative, pseudo-coloured cluster map is then interpolated on a 10 nm resolution grid. This map was then thresholded at a value of _L_(50)=80 to generate a binary
cluster map from which clustering parameters (such as number of clusters, cluster size, shape, number of molecules per cluster and so on) could then be extracted33. ADDITIONAL INFORMATION
HOW TO CITE THIS ARTICLE: Owen, D.M. Sub-resolution lipid domains exist in the plasma membrane and regulate protein diffusion and distribution. _Nat. Commun._ 3:1256 doi: 10.1038/ncomms2273
(2012). REFERENCES * Lingwood D. & Simons K. Lipid rafts as a membrane-organizing principle. _Science_ 327, 46–50 (2010). Article ADS CAS PubMed Google Scholar * Simons K. & Vaz
W. L. C. Model systems, lipid rafts and cell membranes. _Annu. Rev. Biophys. Biomol. Struct._ 33, 269–295 (2004). Article CAS PubMed Google Scholar * Dietrich C. et al. Lipid rafts
reconstituted in model membranes. _Biophys. J._ 80, 1417–1428 (2001). Article ADS CAS PubMed PubMed Central Google Scholar * Baumgart T. et al. Large-scale fluid/fluid phase separation
of proteins and lipids in giant plasma membrane vesicles. _Proc. Natl Acad. Sci. USA_ 104, 3165–3170 (2007). Article ADS CAS PubMed Google Scholar * Lingwood D., Ries J., Schwille P.
& Simons K. Plasma membranes are poised for activation of raft phase coalescence at physiological temperature. _Proc. Natl Acad. Sci. USA_ 105, 10005–10010 (2008). Article ADS CAS
PubMed Google Scholar * Kaiser H. -J. et al. Order of lipid phases in model and plasma membranes. _Proc. Natl Acad. Sci. USA_ 106, 16645–16650 (2009). Article ADS CAS PubMed Google
Scholar * Brown D. A. Lipid rafts detergent-resistant membranes, and raft targeting signals. _Physiology_ 21, 430–439 (2006). Article CAS PubMed Google Scholar * Munro S. Lipid rafts:
Elusive or illusive? _Cell_ 115, 377–388 (2003). Article CAS PubMed Google Scholar * Hancock J. F. Lipid rafts: contentious only from simplistic standpoints. _Nat. Rev. Mol. Cell Biol._
7, 456–462 (2006). Article CAS PubMed PubMed Central Google Scholar * Shaw A. S. Lipid rafts: now you see them, now you don't. _Nat. Immunol._ 7, 1139–1142 (2006). Article CAS
PubMed Google Scholar * Sengupta P. et al. Probing protein heterogeneity in the plasma membrane using PALM and pair correlation analysis. _Nat. Methods_ 8, 969–975 (2011). Article CAS
PubMed PubMed Central Google Scholar * Sharma P. et al. Nanoscale organization of multiple gpi-anchored proteins in living cell membranes. _Cell_ 116, 577–589 (2004). Article CAS PubMed
Google Scholar * Goswami D. et al. Nanoclusters of GPI-anchored proteins are formed by cortical actin-driven activity. _Cell_ 135, 1085–1097 (2008). Article CAS PubMed Google Scholar
* Lommerse P. H. M. et al. Single-molecule imaging of the h-ras membrane-anchor reveals domains in the cytoplasmic leaflet of the cell membrane. _Biophys. J._ 86, 609–616 (2004). Article
ADS CAS PubMed PubMed Central Google Scholar * Eggeling C. et al. Direct observation of the nanoscale dynamics of membrane lipids in a living cell. _Nature_ 457, 1159–1163 (2009).
Article ADS CAS Google Scholar * Lenne P. -F. et al. Dynamic molecular confinement in the plasma membrane by microdomains and the cytoskeleton meshwork. _EMBO J_ 25, 3245–3256 (2006).
Article CAS PubMed PubMed Central Google Scholar * Lillemeier B. F. et al. TCR and Lat are expressed on separate protein islands on T cell membranes and concatenate during activation.
_Nat. Immunol._ 11, 90–96 (2010). Article CAS PubMed Google Scholar * Kusumi A. et al. Paradigm shift of the plasma membrane concept from the two-dimensional continuum fluid to the
partitioned fluid: high-speed single-molecule tracking of membrane molecules. _Annu. Rev. Biophys. Biomol. Struct._ 34, 351–378 (2005). Article CAS PubMed Google Scholar * Adler J.,
Shevchuk A. I., Novak P., Korchev Y. E. & Parmryd I. Plasma membrane topography and interpretation of single-particle tracks. _Nat. Methods_ 7, 170–171 (2010). Article CAS PubMed
Google Scholar * Tanaka K. A. K. et al. Membrane molecules mobile even after chemical fixation. _Nat. Methods_ 7, 865–866 (2010). Article CAS PubMed Google Scholar * Gaus K.,
Chklovskaia E., Fazekas de St Groth B., Jessup W. & Harder T. Condensation of the plasma membrane at the site of T lymphocyte activation. _J. Cell Biol._ 171, 121–131 (2005). Article
CAS PubMed PubMed Central Google Scholar * Owen D. M., Rentero C., Magenau A., Abu-Siniyeh A. & Gaus K. Quantitative imaging of membrane lipid order in cells and organisms. _Nat.
Protocol_ 7, 24–35 (2012). Article CAS Google Scholar * Jin L. et al. Characterization and application of a new optical probe for membrane lipid domains. _Biophys. J._ 90, 2563–2575
(2006). Article ADS CAS PubMed PubMed Central Google Scholar * Owen D. M. et al. Fluorescence lifetime imaging provides enhanced contrast when imaging the phase-sensitive dye
di-4-aneppdhq in model membranes and live cells. _Biophys. J._ 90, L80–L82 (2006). Article CAS PubMed PubMed Central Google Scholar * Jameson D. M., Gratton E. & Hall R. D. The
measurement and analysis of heterogeneous emissions by multifrequency phase and modulation fluorometry. _Appl. Spectrosc. Rev._ 20, 55–106 (1984). Article ADS CAS Google Scholar * Digman
M. A., Caiolfa V. R., Zamai M. & Gratton E. The phasor approach to fluorescence lifetime imaging analysis. _Biophys. J._ 94, L14–L16 (2008). Article CAS PubMed Google Scholar * de
Almeida R. F. M., Fedorov A. & Prieto M. Sphingomyelin/phosphatidylcholine/cholesterol phase diagram: boundaries and composition of lipid rafts. _Biophys. J._ 85, 2406–2416 (2003).
Article CAS PubMed PubMed Central Google Scholar * Sanchez S. A., Tricerri M. A. & Gratton E. Laurdan generalized polarization fluctuations measures membrane packing
micro-heterogeneity _in vivo_. _Proc. Natl Acad. Sci._ 109, 7314–7319 (2012). Article ADS CAS PubMed Google Scholar * Meder D., Moreno M. J., Verkade P., Vaz W. L. C. & Simons K.
Phase coexistence and connectivity in the apical membrane of polarized epithelial cells. _Proc. Natl Acad. Sci. USA_ 103, 329–334 (2006). Article ADS CAS PubMed Google Scholar *
Levental I. et al. Cholesterol-dependent phase separation in cell-derived giant plasma-membrane vesicles. _Biochem. J._ 424, 163–167 (2009). Article CAS PubMed PubMed Central Google
Scholar * Rentero C. et al. Functional implications of plasma membrane condensation for T cell activation. _PLoS ONE_ 3, e2262 (2008). Article ADS PubMed PubMed Central Google Scholar
* Zhang W., Trible R. P. & Samelson L. E. LAT palmitoylation: its essential role in membrane microdomain targeting and tyrosine phosphorylation during T cell activation. _Immunity_ 9,
239–246 (1998). Article CAS PubMed Google Scholar * Williamson D. J. et al. Pre-existing clusters of the adaptor Lat do not participate in early T cell signaling events. _Nat. Immunol._
12, 655–662 (2011). Article CAS PubMed Google Scholar * Fairn G. D. et al. High-resolution mapping reveals topologically distinct cellular pools of phosphatidylserine. _J. Cell Biol._
194, 257–275 (2011). Article CAS PubMed PubMed Central Google Scholar * Hammond G. R. V. et al. PI4P and PI(4,5)P2 are essential but independent lipid determinants of membrane identity.
_Science_ 337, 727–730 (2012). Article ADS CAS PubMed PubMed Central Google Scholar * Yeung T. et al. Receptor activation alters inner surface potential during phagocytosis. _Science_
313, 347–351 (2006). Article ADS CAS PubMed Google Scholar * Yeung T. et al. Membrane phosphatidylserine regulates surface charge and protein localization. _Science_ 319, 210–213
(2008). Article ADS CAS PubMed Google Scholar * Owen D. M. et al. High plasma membrane lipid order imaged at the immunological synapse periphery in live T cells. _Mol. Membr. Biol._ 27,
178–189 (2010). Article CAS PubMed Google Scholar * Purbhoo M. A. et al. Dynamics of subsynaptic vesicles and surface microclusters at the immunological synapse. _Sci. Signal_ 3, ra36
(2010). Article PubMed Google Scholar * Gowrishankar K. et al. Active remodeling of cortical actin regulates spatiotemporal organization of cell surface molecules. _Cell_ 149, 1353–1367
(2012). Article CAS PubMed Google Scholar * Suzuki K. G. N. et al. Transient GPI-anchored protein homodimers are units for raft organization and function. _Nat. Chem. Biol._ 8, 774–783
(2012). Article CAS PubMed Google Scholar * Douglass A. D. & Vale R. D. Single-molecule microscopy reveals plasma membrane microdomains created by protein-protein networks that
exclude or trap signaling molecules in T cells. _Cell_ 121, 937–950 (2005). Article CAS PubMed PubMed Central Google Scholar * Owen D. M., Magenau A., Williamson D. & Gaus K. The
lipid raft hypothesis revisited – New insights on raft composition and function from super-resolution fluorescence microscopy. _BioEssays_ 34, 739–747 (2012). Article CAS PubMed Google
Scholar * Annibale P., Scarselli M., Kodiyan A. & Radenovic A. Photoactivatable fluorescent protein mEos2 displays repeated photoactivation after a long-lived dark state in the red
photoconverted form. _J. Phys. Chem. Lett._ 1, 1506–1510 (2010). Article CAS Google Scholar * Annibale P., Vanni S., Scarselli M., Rothlisberger U. & Radenovic A. Identification of
clustering artifacts in photoactivated localization microscopy. _Nat. Methods_ 8, 527–528 (2011). Article CAS PubMed Google Scholar * Annibale P., Vanni S., Scarselli M., Rothlisberger
U. & Radenovic A. Quantitative photo activated localization microscopy: unraveling the effects of photoblinking. _PLoS ONE_ 6, e22678 (2011). Article ADS CAS PubMed PubMed Central
Google Scholar * Ripley B. D. Modelling spatial patterns. _J. Royal Stat. Soc. B_ 39, 172–192 (1977). MathSciNet Google Scholar * Perry G. L. W. SpPack: spatial point pattern analysis in
excel using visual basic for applications (VBA). _Environ. Modell. Soft_ 19, 559–569 (2004). Article Google Scholar Download references ACKNOWLEDGEMENTS We thank the Australian Research
Council (ARC), National Health and Medical Research Council (NHMRC) of Australia and the Human Frontier Science Programme (HFSP) for providing funds. We also thank Professor David Jameson
(University of Hawai’i at Mānoa) for helpful discussions. WT LAT and CS LAT were obtained from Thomas Harder (University of Oxford, UK). We also thank the Biomedical Imaging Facility (BMIF)
at UNSW for continuing support. AUTHOR INFORMATION AUTHORS AND AFFILIATIONS * Centre for Vascular Research and Australian Centre for Nanomedicine, University of New South Wales, High Street,
Sydney, 2052, New South Wales, Australia Dylan M. Owen, David J. Williamson, Astrid Magenau & Katharina Gaus Authors * Dylan M. Owen View author publications You can also search for
this author inPubMed Google Scholar * David J. Williamson View author publications You can also search for this author inPubMed Google Scholar * Astrid Magenau View author publications You
can also search for this author inPubMed Google Scholar * Katharina Gaus View author publications You can also search for this author inPubMed Google Scholar CONTRIBUTIONS D.M.O.
conceptualized and performed FLIM and FCS experiments and phasor analysis, and prepared the manuscript; D.J.W. performed molecular biology and PALM imaging and analysis; A.M. contributed to
PALM experiments; K.G. wrote the manuscript and is responsible for conceptualization. CORRESPONDING AUTHOR Correspondence to Katharina Gaus. ETHICS DECLARATIONS COMPETING INTERESTS The
authors declare no competing financial interests. SUPPLEMENTARY INFORMATION SUPPLEMENTARY INFORMATION Supplementary Figures S1-S6 (PDF 280 kb) RIGHTS AND PERMISSIONS Reprints and permissions
ABOUT THIS ARTICLE CITE THIS ARTICLE Owen, D., Williamson, D., Magenau, A. _et al._ Sub-resolution lipid domains exist in the plasma membrane and regulate protein diffusion and
distribution. _Nat Commun_ 3, 1256 (2012). https://doi.org/10.1038/ncomms2273 Download citation * Received: 21 June 2012 * Accepted: 07 November 2012 * Published: 04 December 2012 * DOI:
https://doi.org/10.1038/ncomms2273 SHARE THIS ARTICLE Anyone you share the following link with will be able to read this content: Get shareable link Sorry, a shareable link is not currently
available for this article. Copy to clipboard Provided by the Springer Nature SharedIt content-sharing initiative