Play all audios:
ABSTRACT Glutathione (GSH) is depleted early in the course of Parkinson’s disease (PD), and deficiency has been shown to perpetuate oxidative stress, mitochondrial dysfunction, impaired
autophagy, and cell death. GSH repletion has been proposed as a therapeutic intervention. The objective of this study was to evaluate whether intranasally administered reduced GSH, (in)GSH,
is capable of augmenting central nervous system GSH concentrations, as determined by magnetic resonance spectroscopy in 15 participants with mid-stage PD. After baseline GSH measurement, 200
mg (in)GSH was self-administered inside the scanner without repositioning, then serial GSH levels were obtained over ~1 h. Statistical significance was determined by one-way repeated
measures analysis of variance. Overall, (in)GSH increased brain GSH relative to baseline (_P_<0.001). There was no increase in GSH 8 min after administration, although it was
significantly higher than baseline at all of the remaining time points (_P_<0.01). This study is the first to demonstrate that intranasal administration of GSH elevates brain GSH levels.
This increase persists at least 1 h in subjects with PD. Further dose–response and steady-state administration studies will be required to optimize the dosing schedule for future trials to
evaluate therapeutic efficacy. SIMILAR CONTENT BEING VIEWED BY OTHERS PARKINSON’S DISEASE IS CHARACTERIZED BY VITAMIN B6-DEPENDENT INFLAMMATORY KYNURENINE PATHWAY DYSFUNCTION Article Open
access 26 April 2025 NEUROMETABOLITE LEVELS IN THE BRAINS OF PATIENTS WITH AUTISM SPECTRUM DISORDERS: A META-ANALYSIS OF PROTON MAGNETIC RESONANCE SPECTROSCOPY STUDIES (_N_ = 1501) Article
28 April 2023 CLINICAL AND BRAIN VOLUMETRIC CORRELATES OF DECREASED DTI-ALPS, SUGGESTIVE OF LOCAL GLYMPHATIC DYSFUNCTION, IN IRBD Article Open access 23 April 2025 INTRODUCTION Glutathione
(GSH) deficiency is one of the earliest biochemical perturbations in Parkinson’s disease (PD),1,2 leading to the hypothesis that GSH supplementation may have therapeutic value in alleviating
PD symptoms or modifying progression.3 Reduced GSH (GSH; γ-L-glutamyl-L-cysteinylglycine) is a tripeptide involved in the scavenging of hydroxyl radical (*OH) and singlet oxygen, the
reduction of H2O2, and for cellular detoxification through GSH-_S_-transferases.4,5 Deficient GSH synthesis has been associated with oxidative stress in aging,6 and GSH concentrations
decrease with age, a factor thought to explain, in part, why the elderly are at greater risk of neurodegenerative diseases.7,8 Two major factors have limited progress toward investigating
the utility of GSH supplementation as a therapeutic strategy in PD. First, GSH bioavailability is very low following oral administration. Alternative repletion strategies have focused on
oral administration of GSH precursors (e.g., cysteine and glycine supplementation9), and intravenous administration of GSH,10 which although promising, is invasive and inconvenient, and
therefore unlikely to be a practical solution. Second, the inability to quantify central nervous system (CNS) GSH concentrations _in vivo_ has substantially hindered therapeutic trials
targeting CNS augmentation. The current study addressed these limitations by testing a noninvasive nasal GSH repletion strategy, and measuring CNS uptake via proton magnetic resonance
spectroscopy (1H-MRS). 1H-MRS is a noninvasive approach that enables the determination of _in vivo_ concentrations of specific neurochemicals, including GSH. GSH brain concentrations are not
commonly measured using 1H-MRS, because relative to other 1H-MRS-detectable neurochemicals (e.g., creatine (Cr), choline, _N_-acetylasparate), GSH concentrations are substantially lower. In
addition, the GSH signal from 1H protons of the cysteinyl β-CH2, which forms a resonance peak at 2.95 p.p.m., is obscured by nearby spectral peaks from other neurochemicals. The development
of editing techniques such as Meshcher-Garwood point resolved spectroscopy (MEGA-PRESS) to effectively suppress nearby resonance peaks of other neurochemicals (e.g., Cr: 3.03 p.p.m.;
aspartate: 2.82 p.p.m.; GABA: 3.01 p.p.m.) has provided a practical method for the measurement of GSH concentrations by 1H-MRS.11 MEGA-PRESS editing has been used to demonstrate alterations
in GSH brain concentrations in a handful of conditions, including normal aging,12 Alzheimer’s disease,13 and schizophrenia.14 Little is known about the capacity of exogenously administered
GSH, or its precursors, to modify CNS GSH levels. In a 2013 study,15 the GSH precursor _N_-acetyl cysteine (NAC) was administered as a single 60-min intravenous infusion (150 mg/kg) to
individuals with PD and healthy controls. NAC administration increased brain GSH concentrations by 55% in subjects with PD, and 34% in healthy controls (_n_=3). The authors reported that
maximal brain GSH concentrations were measured ~90–110 min after the start of the infusion, and had not returned to baseline levels by 120 min after the start of the infusion.15 These
results support the hypothesis that NAC is capable of crossing the blood–brain barrier and providing cysteine substrate to CNS cells, thus enhancing GSH synthesis. Although these findings
appear promising, the utility of intravenous NAC repletion as a therapeutic strategy in PD is greatly limited by invasiveness and inconvenience of intravenous delivery. Recently, a
dose-dependent increase in cerebrospinal fluid (CSF) total and reduced NAC concentrations was demonstrated in association with oral NAC administration.16 Despite increases in NAC
concentrations, there was no observed increase in CSF total or reduced GSH concentrations, presumably because the conversion of NAC to GSH occurs intracellularly. Under normal physiologic
conditions, intracellular GSH concentrations of neurons are 250- to 500-fold higher than in the CSF,17 thus limiting the utility of CSF to serve as a biomarker of cellular GSH status. In
spite of their limitations, these studies are the first to demonstrate a capacity of exogenously administered NAC to reach the CNS. An oral NAC supplementation trial is underway to assess
changes in brain GSH levels using similar 1H-MRS.18 Intranasal administration of reduced GSH, (in)GSH, could be an effective approach for delivery of GSH to the CNS. Many studies suggest
that small, polar molecules may be able to “bypass” the blood–brain barrier with nasal delivery, as the interface between the nasal cavity and brain is considered a potential point of
vulnerability in the blood–brain barrier. On the basis of the biological plausibility and anecdotal case reports of clinical improvement, (in)GSH has been recommended as an off-label therapy
for GSH augmentation in PD since 2004.19–21 Recently, a double-blind, placebo-controlled randomized clinical trial of phase I study of (in)GSH in PD (_n_=30) demonstrated (in)GSH was safe
and tolerable, and both active study arms demonstrated an improvement over placebo in total Unified PD Rating Scale scores, specifically in activities of daily living and motor Unified PD
Rating Scale subscores.22 The current proof-of-concept study was designed to evaluate whether (in)GSH is capable of augmenting CNS GSH concentrations, as measured by 1H-MRS. RESULTS SUBJECT
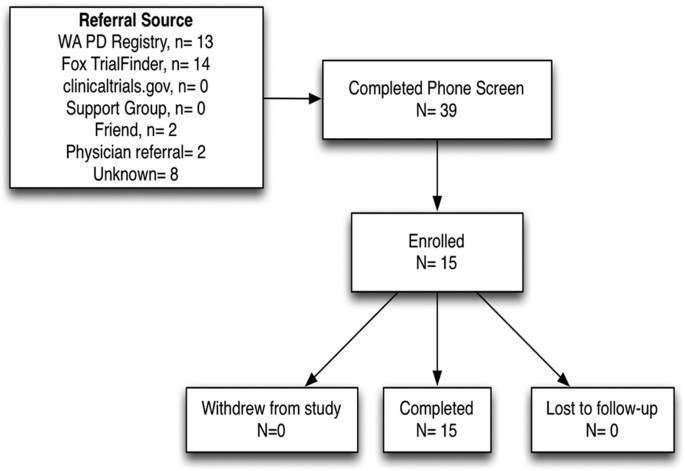
SCREENING AND ENROLLMENT In all, 31 individuals were screened in order to identify 15 who qualified. Most study referrals came from the Michael J Fox Foundation Trial Finder (45%) and
Washington State PD Registry (42%), with health-care providers and friends contributing to the remaining referrals (13%). The subject population was highly diverse in terms of age,
socioeconomic status, education, and geographic neighborhoods throughout the Pacific Northwest, although all participants were Caucasian. The characteristics of study participants are
presented in Table 1 and the enrollment algorithm is presented in Figure 1. STUDY MEDICATION QUALITY AND TOLERABILITY Independent analysis of three separate samples compounded to contain 200
mg/ml demonstrated the product potency to be 190 mg/ml (95%) upon receipt, and potency reduced to 144 mg/ml (72%) at 4 weeks in one sample, and 161 mg/ml (80.5%) at 6 weeks in a separate
batch. One participant experienced a single adverse reaction to the study medication, cephalgic paresthesia, which resolved within 1 h. CHANGES IN BRAIN GSH LEVELS AFTER (IN)GSH
ADMINISTRATION The duration of post-dose measurements was driven by participant comfort and scheduled time in scanner, up to the duration of time approved by the institutional review board.
Six subjects underwent three post-dose measurements, eight subjects underwent four post-dose measurements, and one subject underwent a fifth measurement (Table 2). GSH-edited spectra were
successfully obtained from all 15 subjects (representative spectrum, Figure 2). For one subject, the spectrum obtained at the second post-dose time point was of insufficient quality, and was
omitted from analysis. For six subjects, baseline GSH peaks were undetectable. For these six subjects, baseline GSH levels were all assigned the same value (the lowest measured GSH/Cr ratio
value across all subjects and scans, divided by 2), in order to calculate the absolute change in GSH/Cr ratio relative to baseline. Thus, of the 70 spectra acquired, a total of 7 spectra
were omitted from analysis. For the remaining 63 spectra, mean fit error was 38%. The combined fit error for GSH and Cr varied by less than a factor of 2 over the course of each subject’s
serial scans. For point-resolved spectroscopy (PRESS) spectra, all scans met the stated quality control criteria. CSF fraction within the voxel ranged from 7 to 25% (mean 17%, ±4.9% s.d.).
Mean GSH levels increased consistently with time relative to baseline (Table 2 and Figure 3a,b), although levels fluctuated somewhat among individual subjects (Figure 3c,d). GSH/Cr (as well
as absolute GSH levels) were significantly different from each other (one-way repeated measures analysis of variance, _P_<0.001). The increase in GSH/Cr or absolute GSH immediately after
(in)GSH administration (7.5 min) was not significantly different from baseline, however, GSH levels were significantly higher than baseline at all of the remaining time points (_P_<0.05;
Figure 3a,b). Between the baseline and the 45-min scan, there was a mean 269% increase in GSH/Cr (240% increase in absolute GSH). DISCUSSION To our knowledge, this is the first study to
demonstrate an increase in CNS GSH levels with a noninvasive GSH augmentation strategy. GSH augmentation as a potential therapeutic strategy in CNS disease has been suggested for decades,23
although repletion efforts have been hindered by inability to assess human CNS GSH concentrations _in vivo_ and poor oral absorption of GSH.24 Here we demonstrate that both of these
obstacles are surmountable by using a 1H-MRS editing method to measure CNS GSH levels, and a noninvasive (in)GSH administration strategy. GSH augmentation deserves investigation as a
beneficial therapeutic approach for not only PD but also numerous other CNS disorders for which GSH deficiency and GSH-related enzyme deficits have been documented (multiple sclerosis,25,26
autism,27–29 Alzheimer’s disease,30,31 schizophrenia,32,33 and bipolar disease34). Previously, i.v. NAC was demonstrated by magnetic resonance spectroscopy (MRS) to augment CNS GSH
concentrations.15 Although effective, i.v. therapy requires trained medical personnel for administration, thus raising costs, patient burden for clinic visits, and risk of discomfort and
phlebitis. Ours is the first study to demonstrate CNS GSH augmentation using a noninvasive, self-administered therapy in humans. The single dose, short (1 h) observation period, and lack of
placebo arm are limitations in this proof-of-concept study and provide direction for follow-up studies. GSH levels were calculated both relative to Cr (GSH/Cr peak area ratio) and as
absolute (water-referenced) GSH concentrations. Although water-referenced neurochemical concentrations are considered by some as the “gold standard” approach for MRS, there are numerous
technical challenges and assumptions that can limit the utility of water-referenced measurements.35 Alternatively, reporting of neurochemical levels relative to a reference neurochemical in
the same voxel is a common approach, as measurements are technologically uncomplicated (only a single spectrum must be collected) and no correction for partial-volume effects is required.
However, a ratio approach can complicate interpretation of data, if it is unclear whether the reference neurochemical is altered by treatment as well. For this reason, both GSH/Cr ratios and
absolute GSH concentrations are reported. We observed good correspondence between the relative and absolute GSH levels (Figure 3), and the statistical significance of GSH level changes with
time post dose was the same regardless of the quantitation approach. In addition, although comparison of absolute MRS neurochemical concentrations across different instruments and sites is
highly challenging, the baseline absolute GSH levels that we observed (mean 0.109 IU (institutional units); range 0.0183–0.435) are within the ranges reported in the literature for
postmortem CNS concentrations of GSH in subjects with PD.2 Of note, the range of reported brain GSH concentrations is extremely variable, ranging over an order of magnitude.15,36 The
strength of this study lies in the demonstration of a consistent increase in brain GSH levels with time post dose. Absolute Cr concentration in the voxel (mean 6.09 IU) were also comparable
to reported values.37 It should be noted that this study was not designed to differentiate between GSH in brain tissue versus CSF. However, as reported concentrations of GSH are in the range
of 0.2 μmol/l in CSF and 1 mmol/l in brain tissue,7 GSH in CSF would not appreciably change the MRS determination of GSH in brain tissue. Owing to the velocity of blood movement through the
voxel, MRS does not detect GSH signal from blood, thus, the measured GSH values reflect only GSH in brain parenchyma or CSF. This pilot study was designed to demonstrate that (in)GSH
results in an increase in the GSH signal in brain, and not to generate a comprehensive pharmacokinetic profile of the increased brain GSH signal. In light of the data generated in this
study, a more complete pharmacokinetic investigation designed to quantify the magnitude and duration of increase in GSH is warranted. Additional studies could be directed toward optimizing
delivery techniques, dosing schedules, product stability, and intranasal formulations. Recently, a small phase I/IIa study of (in)GSH in PD demonstrated a mild symptomatic improvement in PD
symptoms as measured by the Unified PD Rating Scale, with return of symptoms upon withdrawal of (in)GSH.38 Although numerous questions remain about the mechanism by which GSH may ameliorate
PD symptoms, this study demonstrates that a single dose of (in)GSH does, in fact, reach the target tissue. In addition to biological activity as an essential intracellular antioxidant, GSH
facilitates the clearance of metabolic waste via GSH-_S_-transferases and may function as a neuropeptide.39 In astrocytes, GSH serves as a reservoir for cysteine, glycine, and glutamic acid,
each with their own biochemical activities. Glycine, a _N_-methyl-D-aspartate receptor agonist, has been shown to significantly improve negative symptoms in patients with schizophrenia when
supplemented.40 Cysteine availability has been shown to regulate extracellular glutamate concentrations, and thus neuronal excitability, via the cystine–glutamate antiporter.41 Using
123-IFP-CIT single-photon emission computed tomography, high doses of (iv)GSH significantly influenced putamen dopamine transporter in PD patients.42 A follow-up study is underway to
evaluate the effects of 3 months of (in)GSH on PD symptom status and MRS GSH concentrations. Considering the potential for therapeutic development of (in)GSH, the established safety and
tolerability data, biological plausibility, and pilot level clinical evidence of benefit are further supported with this demonstration that (in)GSH is able to augment brain GSH levels.
MATERIALS AND METHODS Institutional Review Board approval was obtained at the University of Washington for this single-center study of 15 participants with mid-stage PD. Recruitment occurred
through the Michael J. Fox Foundation Trial Finder,43 the Washington PD Registry,44 ClinicalTrials.gov (NCT02324426), and referral from local health-care providers. Inclusion criteria
required participants to be over age 18, read and speak English, have a Hoehn & Yahr score between 2 and 3 (bilateral disease, not severely disabled), and have three or more of the
required positive criteria for the diagnosis of definite PD from Step 3 of the UK Brain Bank Diagnostic Criteria for PD.45 Exclusion criteria included any contraindication to MRI, history of
epilepsy, stroke, brain surgery, or structural brain disease, pregnancy, history of sulfur sensitivity, ongoing asthma or drug dependence, ongoing chronic diseases, history of mental
illness, or acute infection during the prior 30 days. Informed consent was obtained from all participants. In light of evidence from animal models that brain GSH concentrations peak in the
morning,46 the single study visit was scheduled at 0700 hours for each participant in an attempt to control for circadian fluctuations. BRAIN GSH ASSESSMENT IMAGING AND VOXEL SELECTION Brain
GSH levels were determined using a Philips Achieva 3.0-T whole-body scanner (Best, The Netherlands) equipped with a 32-channel SENSE phased-array head coil. From each subject, a detailed
brain image was first acquired, using a magnetization-prepared rapid gradient echo47 high-resolution T1-weighted sequence (repetition time=6.6 ms, echo time=3.0 ms, flip angle=8°,
matrix=256×240, slices =170, and slice thickness=1 mm). Images were evaluated in real-time to select a cubic volume of interest, 4×4×5 cm, centered over the left dorsal putamen at the level
of the lentiform nucleus. As CNS GSH concentrations are thought to be reduced in PD, a relatively large voxel size was selected in order to maximize signal to noise. The dorsal putamen was
selected as the center of the volume of interest due to its relatively homogenous mix of neurons and astrocytes, and suitable distance from bone and other regions that could compromise
signal quality. The voxel was positioned to avoid the skull and, to the extent possible, the left lateral ventricle (Figure 4). 1H-MAGNETIC RESONANCE SPECTROSCOPY The cysteinyl β-CH2 of GSH
exhibits a characteristic chemical shift at 2.95 p.p.m., which distinguishes it from other cysteine-based molecules.48 GSH levels were determined within the volume of interest using
MEGA-PRESS double-editing for the cysteinyl β-CH2 residue of GSH7 (repetition time=2,000 ms, echo time=122 ms, free induction decay points=2,048, spectral width=2,000 Hz, number of
averages=8 per phase cycle ON or OFF, 320 acquisitions total requiring just under 11 min). Spectral editing was accomplished by refocusing GSH J-evolution during every other acquisition
(ON), using a 43-ms Gaussian pulse centered at the cysteinyl α-CH resonance of GSH at 4.56 p.p.m. During the alternate acquisitions (OFF), the pulse was applied symmetrically about the water
peak. The difference-edited GSH spectrum was generated by subtraction of the OFF and ON spectra. To facilitate quantification of GSH, additional spectra were collected from the same volume
of interest (Figure 4) using a short-echo PRESS sequence with vapor water suppression (repetition time=2,000 ms, echo time=36 ms; free induction decay points= 2,048, spectral width=2,000 Hz,
number of averages=64). To account for T2-weighting differences, PRESS water spectra were also collected using both echo times (echo time=122 or 68 ms, repetition time=2,000 ms, free
induction decay points=2,048, spectral width=2,000 Hz, number of averages=8). After baseline MEGA-PRESS and PRESS spectra were acquired, 200 mg GSH was self-administered into the left
nostril by each subject inside the scanner without repositioning. Immediately after administration (within 2 min), serial GSH MEGA-PRESS spectra were obtained over the course of up to 62 min
post dose (11 min per scan, for a total of three to five measurements post dose). For consistency, the study medication was always administered in the left nostril and spectra were
collected ipsilaterally. QUANTIFICATION For each subject, brain GSH levels were quantified from difference-edited spectra using the Gannet 2.0 Toolkit, a Matlab-based automated program for
analyzing MEGA-PRESS spectra.49 Gannet processing steps include 3 Hz exponential line broadening, and frequency- and phase-correction of individual spectra. The edited spectra are fit with
Gaussian models, and the GSH signal is expressed relative to the Cr signal; GSH/Cr ratio. Assessment of inter-and intra-subject data quality was accomplished by comparing fit errors
(calculated as the s.d. of the residual of the analyte peak, expressed as a percentage of the analyte peak amplitude). In cases where the GSH peak was undetectable, a value (the lowest
measured GSH/Cr ratio value across all subjects and scans, divided by 2) was assigned. To calculate absolute (i.e., water-referenced) GSH levels from GSH/Cr ratios, concentrations of total
Cr (Cr plus phosphocreatine) were calculated. Cr concentrations were determined from PRESS spectra using standard model-fitting procedures (LCModel software version 6.2-0T (ref. 50)). A
decomposition-fitting algorithm was used to subtract residual water signals. Free induction decays were zero-filled, smoothed with a 1.1-Hz exponential-dampening filter, and then zero- and
first-order phase corrected. Quality control criteria included a peak width ⩽0.1 p.p.m., signal-to-noise ratio ⩾5, and Cramer–Rao lower bounds <20% (as percentage of the estimated
concentration). Absolute (water-referenced) Cr concentrations were determined by scaling the spectrum to the unsuppressed water peak, resulting in values with IU that approximate millimolar
(mmol/l) concentrations. To correct for the partial-volume effect, fractions of CSF and brain tissue (gray and white matters) were determined within the voxel using FSL FAST segmentation.51
As GSH is known to be present in CSF at very low concentrations (~0.2 μmol/l in both healthy and PD subjects),52 relative to brain tissue concentrations (~1 mmol/l),7 LCModel-calculated Cr
concentrations (_C_measured) were corrected (_C_corrected) using the following formula, which assumes negligible contribution of CSF GSH to the total GSH signal: C corrected = C measured − (
1 fraction CSF in voxel ) Absolute GSH levels (IU) were calculated by multiplying GSH/Cr ratios by CSF-corrected absolute Cr concentrations (IU). Changes in GSH levels with time post dose
were calculated as the difference in GSH/Cr peak ratios for each subject at each time point (GSH/Crpost dose−GSH/Crbaseline), or similarly, the difference in absolute GSH for each subject at
each time point. STUDY MEDICATION Powdered GSH was obtained from MEDISCA (Plattsbergh, New York, USA) and compounded by Key Pharmacy (Federal Way, WA, USA). The study medication was stored
in a study refrigerator and protected from light until 30 min before administration, when it was allowed to come to room temperature, for participant comfort during administration. All
participants were administered an identical intervention (1cm3 of saline containing 200 mg GSH) using a syringe attached to a Mucosal Atomization Device supplied by Wolfe-Tory Medical (Salt
Lake City, UT, USA). This dose is the highest dose meeting tolerability and safety criteria in the phase I study of (in)GSH in PD.38 As a quality control measure, medication samples were
sent for independent potency analysis (Eagle Analytical, Houston, TX, USA) upon receipt, and at 4 and 6 weeks after production. STATISTICAL ANALYSIS Using data generated from a pilot study
and G*Power 3.1 software (Düsseldorf, Germany), it was determined that a sample size of 15 would provide 80% power to detect an increase in CNS GSH concentrations between pre- and
post-administration values, with an accepted alpha value of 0.2. Descriptive statistics for study participants are listed in Table 1. A single brain GSH level was determined from each 11-min
MEGA-PRESS acquisition. For the purpose of illustrating changes in GSH level with time, levels were treated as corresponding to the midpoint of each scan. Changes in brain GSH levels over
time were determined as the difference between the GSH/Cr ratio (or absolute GSH) at each time point, relative to baseline. Significance was determined by one-way repeated measures analysis
of variance, and the Holm–Sidak method for multiple comparisons versus the control group, using SigmaPlot 10.0 software (Systat Software, San Jose, CA, USA). Variance among all groups was
not statistically different. REFERENCES * Sian, J. et al. Alterations in glutathione levels in Parkinson’s disease and other neurodegenerative disorders affecting basal ganglia. _Ann.
Neurol._ 36: 348–355 (1994). Article CAS Google Scholar * Sofic, E., Lange, K. W., Jellinger, K. & Riederer, P. Reduced and oxidized glutathione in the substantia nigra of patients
with Parkinson’s disease. _Neurosci. Lett._ 142: 128–130 (1992). Article CAS Google Scholar * Sechi, G. et al. Reduced intravenous glutathione in the treatment of early Parkinson’s
disease. _Prog. Neuropsychopharmacol. Biol. Psychiatry_ 20: 1159–1170 (1996). Article CAS Google Scholar * Coyle, J. T. & Puttfarcken, P. Oxidative stress, glutamate, and
neurodegenerative disorders. _Science_ 262: 689–695 (1993). Article CAS Google Scholar * Pocernich, C. B., Cardin, A. L., Racine, C. L., Lauderback, C. M. & Butterfield, D. A.
Glutathione elevation and its protective role in acrolein-induced protein damage in synaptosomal membranes: relevance to brain lipid peroxidation in neurodegenerative disease. _Neurochem.
Int._ 39: 141–149 (2001). Article CAS Google Scholar * Bains, J. S. & Shaw, C. A. Neurodegenerative disorders in humans: the role of glutathione in oxidative stress-mediated neuronal
death. _Brain Res. Brain Res. Rev._ 25: 335–358 (1997). Article CAS Google Scholar * Emir, U. E. et al. Noninvasive quantification of ascorbate and glutathione concentration in the
elderly human brain. _NMR Biomed._ 24: 888–894 (2011). Article CAS Google Scholar * Currais, A. & Maher, P. Functional consequences of age-dependent changes in glutathione status in
the brain. _Antioxid. Redox Signal._ 19: 813–822 (2013). Article CAS Google Scholar * Sekhar, R. V. et al. Deficient synthesis of glutathione underlies oxidative stress in aging and can
be corrected by dietary cysteine and glycine supplementation. _Am. J. Clin. Nutr._ 94: 847–853 (2011). Article CAS Google Scholar * Hauser, R. A., Lyons, K. E., McClain, T., Carter, S.
& Perlmutter, D. Randomized, double-blind, pilot evaluation of intravenous glutathione in Parkinson’s disease. _Mov. Disord._ 24: 979–983 (2009). Article Google Scholar * Satoh, T.
& Yoshioka, Y. Contribution of reduced and oxidized glutathione to signals detected by magnetic resonance spectroscopy as indicators of local brain redox state. _Neurosci. Res._ 55:
34–39 (2006). Article CAS Google Scholar * Emir, U. E., Deelchand, D., Henry, P. G. & Terpstra, M. Noninvasive quantification of T2 and concentrations of ascorbate and glutathione in
the human brain from the same double-edited spectra. _NMR Biomed._ 24: 263–269 (2011). Article CAS Google Scholar * Mandal, P. K., Saharan, S., Tripathi, M. & Murari, G. Brain
glutathione levels—a novel biomarker for mild cognitive impairment and Alzheimer’s disease. _Biol. Psychiatry_ 78: 702–710 (2015). Article CAS Google Scholar * Matsuzawa, D. et al.
Negative correlation between brain glutathione level and negative symptoms in schizophrenia: a 3T 1H-MRS study. _PLoS One_ 3 _e1944_ (2008). * Holmay, M. J. et al. N-acetylcysteine boosts
brain and blood glutathione in Gaucher and Parkinson diseases. _Clin. Neuropharmacol._ 36: 103–106 (2013). Article CAS Google Scholar * Katz, M. et al. Cerebrospinal fluid concentrations
of N-acetylcysteine after oral administration in Parkinson’s disease. _Parkinsonism Relat. Disord._ 21, 500–503 (2015). Article Google Scholar * Johnson, W. M., Wilson-Delfosse, A. L.
& Mieyal, J. J. Dysregulation of glutathione homeostasis in neurodegenerative diseases. _Nutrients_ 4: 1399–1440 (2012). Article CAS Google Scholar * University WMCoC.
_N-Acetylcysteine for Neuroprotection in Parkinson_ _’_ _s Disease (NAC for PD)_. (ClinicalTrialsgov, U.S. National Institutes of Health, 2015). * Mischley, L. K. Glutathione deficiency in
Parkinson’s disease: intranasal administration as a method of augmentation. _J. Orthomol. Med._ 26: 32–36 (2011). Google Scholar * Seymour, J . Use of compounded glutathione by CAM
practitioners in the Pacific Northwest. Mischley LK, ed. personal communication; Las Vegas, NV (2007). * Mischley, L. K., Vespignani, M. F. & Finnell, J. S. Safety survey of intranasal
glutathione. _J. Altern. Complement Med._ 19: 459–463 (2013). Article Google Scholar * Mischley L. K. S. L., Samii A., Pollisar N., Lau R., Leverenz J. . _Phase I Study of Intranasal
Glutathione in Parkinson' Disease_. (Bastyr University Research Institute, Seattle, WA, USA, 2013). Google Scholar * Perry, T. L., Godin, D. V. & Hansen, S. Parkinson’s disease: a
disorder due to nigral glutathione deficiency? _Neurosci. Lett._ 33: 305–310 (1982). Article CAS Google Scholar * Allen, J. & Bradley, R. D. Effects of oral glutathione
supplementation on systemic oxidative stress biomarkers in human volunteers. _J. Altern. Complement. Med._ 17: 827–833 (2011). Article Google Scholar * Chi, L., Ke, Y., Luo, C., Gozal, D.
& Liu, R. Depletion of reduced glutathione enhances motor neuron degeneration _in vitro_ and _in vivo_. _Neuroscience_ 144: 991–1003 (2007). Article CAS Google Scholar * Srinivasan,
R., Ratiney, H., Hammond-Rosenbluth, K. E., Pelletier, D. & Nelson, S. J. MR spectroscopic imaging of glutathione in the white and gray matter at 7 T with an application to multiple
sclerosis. _Magn. Reson. Imaging_ 28: 163–170 (2010). Article CAS Google Scholar * Chauhan, A., Audhya, T. & Chauhan, V. Brain region-specific glutathione redox imbalance in autism.
_Neurochem. Res._ 37: 1681–1689 (2012). Article CAS Google Scholar * Hodgson, N. W. et al. Decreased glutathione and elevated hair mercury levels are associated with nutritional
deficiency-based autism in Oman. _Exp. Biol. Med._ 239: 697–706 (2014). Article Google Scholar * Rose S. et al. Evidence of oxidative damage and inflammation associated with low
glutathione redox status in the autism brain. _Transl. Psychiatry_ 2: e134 (2012). Article CAS Google Scholar * Mandal, P. K., Tripathi, M. & Sugunan, S. Brain oxidative stress:
detection and mapping of anti-oxidant marker 'Glutathione' in different brain regions of healthy male/female, MCI and Alzheimer patients using non-invasive magnetic resonance
spectroscopy. _Biochem. Biophys. Res. Commun._ 417: 43–48 (2012). Article CAS Google Scholar * Saharan, S. & Mandal, P. K. The emerging role of glutathione in Alzheimer's
disease. _J. Alzheimers Dis._ 40: 519–529 (2014). Article CAS Google Scholar * Do, K. Q. et al. Schizophrenia: glutathione deficit in cerebrospinal fluid and prefrontal cortex _in vivo_.
_Eur. J. Neurosci._ 12: 3721–3728 (2000). Article CAS Google Scholar * Raffa, M. et al. Decreased glutathione levels and antioxidant enzyme activities in untreated and treated
schizophrenic patients. _Prog Neuropsychopharmacol. Biol. Psychiatry_ 33: 1178–1183 (2009). Article CAS Google Scholar * Rosa, A. R. et al. Altered plasma glutathione levels in bipolar
disorder indicates higher oxidative stress; a possible risk factor for illness onset despite normal brain-derived neurotrophic factor (BDNF) levels. _Psychol. Med._ 44: 2409–2418 (2014).
Article CAS Google Scholar * Gasparovic, C. et al. Use of tissue water as a concentration reference for proton spectroscopic imaging. _Magn. Reson. Med._ 55: 1219–1226 (2006). Article
CAS Google Scholar * Perry, T. L. & Yong, V. W. Idiopathic Parkinson’s disease, progressive supranuclear palsy and glutathione metabolism in the substantia nigra of patients.
_Neurosci. Lett._ 67: 269–274 (1986). Article CAS Google Scholar * Yazigi Solis, M. et al. Brain creatine depletion in vegetarians? A cross-sectional (1)H-magnetic resonance spectroscopy
((1)H-MRS) study. _Br. J. Nutr._ 111: 1272–1274 (2014). Article Google Scholar * Mischley, L. K. et al. A randomized, double-blind phase I/IIa study of intranasal glutathione in
Parkinson’s disease. _Mov. Disord._ 30, 1696–1701 (2015). Article CAS Google Scholar * Guo, N., McIntosh, C. & Shaw, C. Glutathione: new candidate neuropeptide in the central nervous
system. _Neuroscience_ 51: 835–842 (1992). Article CAS Google Scholar * Heresco-Levy, U., Ermilov, M., Lichtenberg, P., Bar, G. & Javitt, D. C. High-dose glycine added to olanzapine
and risperidone for the treatment of schizophrenia. _Biol. Psychiatry_ 55: 165–171 (2004). Article CAS Google Scholar * Berk, M., Malhi, G. S., Gray, L. J. & Dean, O. M. The promise
of N-acetylcysteine in neuropsychiatry. _Trends Pharmacol. Sci._ 34: 167–177 (2013). Article CAS Google Scholar * Sechi, G. P. Reduced glutathione and Parkinson’s disease. _Mov. Disord._
25: 2690–2691 (2010). Article Google Scholar * Fox Trial Finder. Internet based clinical trial matching tool. Michael J. Fox Foundation. https://foxtrialfinder.michaeljfox.org/ (2015). *
Leverenz J. B., Zabetian C. Washington State Parkinson’s Disease Registry. In: Chapter APsDA-W. http://depts.washington.edu/wpdr/ (2015). * Hughes, A. J., Daniel, S. E., Kilford, L. &
Lees, A. J. Accuracy of clinical diagnosis of idiopathic Parkinson’s disease: a clinico-pathological study of 100 cases. _J. Neurol. Neurosurg. Psychiatry_ 55: 181–184 (1992). Article CAS
Google Scholar * Beaver, L. M. et al. Circadian regulation of glutathione levels and biosynthesis in Drosophila melanogaster. _PLoS One_ 7 _e50454_ (2012). * Mugler, J. P. 3rd &
Brookeman, J. R. Three-dimensional magnetization-prepared rapid gradient-echo imaging (3D MP RAGE). _Magn. Reson. Med._ 15: 152–157 (1990). Article Google Scholar * Terpstra, M.,
Torkelson, C., Emir, U., Hodges, J. S. & Raatz, S. Noninvasive quantification of human brain antioxidant concentrations after an intravenous bolus of vitamin C. _NMR Biomed._ 24: 521–528
(2011). Article CAS Google Scholar * Edden, R. A., Puts, N. A., Harris, A. D., Barker, P. B., Evans, C. J. Gannet: A batch-processing tool for the quantitative analysis of
gamma1aminobutyric acid-edited MR spectroscopy spectra. _J. Magn. Reson. Imaging_ 40: 144511452 (2014). Article Google Scholar * Provencher, S. W. Estimation of metabolite concentrations
from localized _in vivo_ proton NMR spectra. _Magn. Reson. Med._ 30: 672–679 (1993). Article CAS Google Scholar * Zhang, Y., Brady, M. & Smith, S. Segmentation of brain MR images
through a hidden Markov random field model and the expectation-maximization algorithm. _IEEE Trans. Med. Imaging_ 20: 45–57 (2001). Article CAS Google Scholar * Konings, C. H. et al.
Normal cerebrospinal fluid glutathione concentrations in Parkinson's disease, Alzheimer's disease and multiple system atrophy. _J Neurol Sci_ 168: 112–115 (1999). Article CAS
Google Scholar Download references ACKNOWLEDGEMENTS Michael J. Fox Foundation provided study funding. Richard Edden provided consultation on MRS methodology. Permission to use the MoCA was
provided by Dr Ziead Nasreddine. Mucosal Atomization Device tips were donated by Teleflex (Morrisville, NC, USA). Liza Young and the Integrative Brain Imaging Center (IBIC) at University of
Washington Department of Radiology provided study support. Source of support: Michael J. Fox Foundation. AUTHOR INFORMATION AUTHORS AND AFFILIATIONS * Department of Radiology, University of
Washington (UW), Seattle, WA, USA Laurie K Mischley, Kevin E Conley, Eric G Shankland, Timothy K Wilbur & Prysilla U De La Torre * Graduate Program in Nutritional Sciences, School of
Public Health, University of Washington, Seattle, WA, USA Laurie K Mischley & Michael E Rosenfeld * School of Naturopathic Medicine, Bastyr University Research Institute, Kenmore, WA,
USA Laurie K Mischley & Prysilla U De La Torre * Department of Environmental & Occupational Health Sciences, School of Public Health, University of Washington, Seattle, WA, USA
Terrance J Kavanagh, Michael E Rosenfeld & Collin C White * Michael J. Crescenz VA Medical Center, Philadelphia, PA, USA John E Duda * Department of Neurology, Perelman School of
Medicine at the University of Pennsylvania, Philadelphia, PA, USA John E Duda * Department of Biomedical Sciences, Elson S. Floyd College of Medicine, Washington State University, Spokane,
WA, USA Jeannie M Padowski * Department of Experimental and Systems Pharmacology, College of Pharmacy, Washington State University, Spokane, WA, USA Jeannie M Padowski Authors * Laurie K
Mischley View author publications You can also search for this author inPubMed Google Scholar * Kevin E Conley View author publications You can also search for this author inPubMed Google
Scholar * Eric G Shankland View author publications You can also search for this author inPubMed Google Scholar * Terrance J Kavanagh View author publications You can also search for this
author inPubMed Google Scholar * Michael E Rosenfeld View author publications You can also search for this author inPubMed Google Scholar * John E Duda View author publications You can also
search for this author inPubMed Google Scholar * Collin C White View author publications You can also search for this author inPubMed Google Scholar * Timothy K Wilbur View author
publications You can also search for this author inPubMed Google Scholar * Prysilla U De La Torre View author publications You can also search for this author inPubMed Google Scholar *
Jeannie M Padowski View author publications You can also search for this author inPubMed Google Scholar CONTRIBUTIONS LKM: conception, design, and execution of clinical trial, and manuscript
preparation; TJK, MER, and CCW: methodology/analysis of erythrocyte glutathione concentrations; JED: study design and manuscript preparation; EGS, TKW, and KEC: acquisition of MR image;
PUDLT: execution of clinical trial, data management, and laboratory glutathione analysis; JMP: study design, MRS analysis, and manuscript preparation. CORRESPONDING AUTHOR Correspondence to
Laurie K Mischley. ETHICS DECLARATIONS COMPETING INTERESTS The authors declare no conflict of interest. RIGHTS AND PERMISSIONS This work is licensed under a Creative Commons Attribution 4.0
International License. The images or other third party material in this article are included in the article’s Creative Commons license, unless indicated otherwise in the credit line; if the
material is not included under the Creative Commons license, users will need to obtain permission from the license holder to reproduce the material. To view a copy of this license, visit
http://creativecommons.org/licenses/by/4.0/ Reprints and permissions ABOUT THIS ARTICLE CITE THIS ARTICLE Mischley, L., Conley, K., Shankland, E. _et al._ Central nervous system uptake of
intranasal glutathione in Parkinson’s disease. _npj Parkinson's Disease_ 2, 16002 (2016). https://doi.org/10.1038/npjparkd.2016.2 Download citation * Received: 02 October 2015 *
Revised: 03 December 2015 * Accepted: 10 December 2015 * Published: 25 February 2016 * DOI: https://doi.org/10.1038/npjparkd.2016.2 SHARE THIS ARTICLE Anyone you share the following link
with will be able to read this content: Get shareable link Sorry, a shareable link is not currently available for this article. Copy to clipboard Provided by the Springer Nature SharedIt
content-sharing initiative