Play all audios:
ABSTRACT Neuroimaging studies of patients with treatment-resistant depression (TRD) have reported abnormalities in the frontal and temporal regions. We sought to determine whether metabolism
in these regions might be related to response to repetitive transcranial magnetic stimulation (TMS) in patients with TRD. Magnetic resonance images and baseline resting-state cerebral
glucose uptake index (gluMI) obtained using 18F-fluorodeoxyglucose positron emission tomography were analyzed in TRD patients who had participated in a double-blind, randomized,
sham-controlled trial of prefrontal 10 Hz TMS. Among the patients randomized to active TMS, 17 responders, defined as having 50% depression score decrease, and 14 nonresponders were
investigated for prestimulation glucose metabolism and compared with 39 healthy subjects using a voxel-based analysis. In nonresponders relative to responders, gluMI was lower in left
lateral orbitofrontal cortex (OFC), and higher in left amygdala and uncinate fasciculus. OFC and amygdala gluMI negatively correlated in nonresponders, positively correlated in responders,
and did not correlate in healthy subjects. Relative to healthy subjects, both responders and nonresponders displayed lower gluMI in right dorsolateral prefrontal (DLPFC), right anterior
cingulate (ACC), and left ventrolateral prefrontal cortices. Additionally, nonresponders had lower gluMI in left DLPFC, ACC, left and right insula, and higher gluMI in left amygdala and
uncus. Hypometabolisms were partly explained by gray matter reductions, whereas hypermetabolisms were unrelated to structural changes. The findings suggest that different patterns of
frontal–temporal–limbic abnormalities may distinguish responders and nonresponders to prefrontal magnetic stimulation. Both preserved OFC volume and amygdala metabolism might precondition
response to TMS. SIMILAR CONTENT BEING VIEWED BY OTHERS WHOLE BRAIN NETWORK EFFECTS OF SUBCALLOSAL CINGULATE DEEP BRAIN STIMULATION FOR TREATMENT-RESISTANT DEPRESSION Article Open access 02
November 2023 LARGE-SCALE STRUCTURAL NETWORK CHANGE CORRELATES WITH CLINICAL RESPONSE TO RTMS IN DEPRESSION Article 02 February 2022 NETWORK-SPECIFIC METABOLIC AND HAEMODYNAMIC EFFECTS
ELICITED BY NON-INVASIVE BRAIN STIMULATION Article Open access 01 May 2023 INTRODUCTION Treatment-resistant depression (TRD) occurs in 20 to 30% of depressed patients and leads to severe
disability (Greden, 2001). Neuroimaging studies focused on TRD patients are rare, and have reported decreased blood flow or glucose metabolism in prefrontal regions such as the anterior
cingulate cortex (ACC) (Mayberg et al, 1994, 1997b; Drevets et al, 1997; Ketter et al, 2001; Konarski et al, 2007), and in anterior temporal cortices (Mayberg et al, 1994). Differential
frontal–temporal changes have been reported in medication responder and nonresponder subgroups of depressed patients. Responders to antidepressants were found to have lower pretreatment
glucose metabolism in both left amygdala region and temporal cortex, and in bilateral frontal cortices (Little et al, 2005). In line with these findings, higher resting-state
hippocampus–amygdala blood flow was found in a group of TRD compared with nonresistant patients and healthy controls (Hornig et al, 1997). Cortical–limbic balance involving orbitofrontal
cortex (OFC), ACC, hippocampus, and dorsolateral prefrontal cortex (DLPFC) might differentiate responders from nonresponders to antidepressant medications (Seminowicz et al, 2004).
Repetitive transcranial magnetic stimulation (TMS) has been proposed as a potential treatment for TRD (George et al, 1995; Pascual-Leone et al, 1996) that can easily be applied in clinical
settings and is well tolerated. This procedure aims at stimulating the left DLPFC in order to increase brain metabolism in prefrontal areas using high stimulation frequencies (>5 Hz).
However, although a number of studies have now demonstrated the clinical effectiveness of TMS in TRD patients (Lam et al, 2008), the effects remain variable and factors predictive of
response remain poorly understood (Loo and Mitchell, 2005; Herrmann and Ebmeier, 2006; Lisanby et al, 2009). As this therapy is time consuming and costly, it is necessary to determine
whether brain factors could influence or predict outcome. High-frequency TMS of prefrontal regions, as used to treat depression, has been shown to modulate ACC and caudate nucleus activity
in healthy subjects (Barrett et al, 2004). In addition, blood flow decreases in OFC and ACC have been reported after treatment with high-frequency TMS (Nadeau et al, 2002) in _responders_ to
TMS. So far, however, it is not clear whether prestimulation functional anatomy could influence TMS efficacy and predict response. We _a priori_ hypothesized that TRD patients who were
_nonresponders_ to TMS would have specific alterations in those frontal–temporal–limbic regions involved in TRD and in TMS effects, and also in the uncinate fasciculus, a frontal–temporal
fiber tract that we have reported to be altered in patients with affective disorders (Houenou et al, 2007). We used [18F]-fluorodeoxyglucose positron emission tomography ([18F]-FDG-PET) to
determine whether resting functional brain characteristics at baseline could differentiate responders from nonresponders to 10 Hz TMS in a group of TRD patients. Additionally, we searched
for a potential influence of structural anatomy on metabolism, and for functional correlations within the regions involved in response to TMS. SUBJECTS AND METHODS The investigation was
performed in accordance with the Declaration of Helsinki. The study was approved by the ethics committee Ile-de-France 6, Paris. Written informed consent was obtained from all subjects after
full description of the study. PARTICIPANTS Pretrial PET and magnetic resonance imaging (MRI) data from the 34 patients who were initially randomized to an active arm in a double-blind,
sham-controlled trial of 10 Hz TMS including 48 patients (Paillère Martinot et al, 2009) were considered for the present imaging study. The patients had a DSM-IV-TR diagnosis of Major
Depressive Disorder established by clinical interview using the Mini-International Neuropsychiatric Interview (MINI) (Sheehan et al, 1998), with criteria for treatment resistance to at least
two trials of antidepressants of different classes given at adequate doses (>150 mg/day in an equivalent dose of imipramine) and duration (at least 4 weeks for each drug). Exclusion
criteria included age >65 years, pregnancy, alcohol or substance dependence in the past 6 months, electroconvulsive therapy (ECT) treatment in the past 6 months, any present medical
condition, history of epileptic seizures, history of neurological disorders or substantial brain damage, and contraindication to magnetic fields. On examination of the patient medical
charts, three patients were excluded; past early-onset alcoholism in 2 patients and a possible diagnosis of fibromyalgia in one patient. Indeed, alcoholism with onset in adolescence might
have modified brain structure (Chanraud et al, 2007), and fibromyalgia has been reported to alter brain activity in frontocingulate areas (Burgmer et al, 2009). Thus, data from 31 patients
were analyzed in the present study (mean (SD) age=47.7 (7.3); range: 30.5–59.5, 20 women). They had on average 7.4 (4.4) years of education after primary school, and were not paid for their
participation. A total of 39 paid healthy comparison subjects with no personal or family history of psychiatric or neurologic disorder, as assessed by a medical examination, were recruited
by word of mouth from community volunteers during the same time period (age: mean (SD)=45.2 (11.8); range: 25–62, 25 women; years of education after primary school: mean (SD)=9.10 (4.8)).
Patients and healthy subjects did not differ in age (_t_=0.99, df=68, _p_=0.32), gender (_χ_2 test=0.000, _p_=0.98), years of education (_t_=1.53, df=67, _p_=0.13), or Annett's (1970)
laterality score (patients: mean (SD)=85.7 (49.3), healthy subjects: 89.4 (26.5), _t_=0.40, df=67, _p_=0.69). TMS PROTOCOL DESIGN The stimulation procedure and determination of PET-derived
targets for TMS have been described elsewhere (Paillère Martinot et al, 2009). Briefly, after scanning, the patients were randomized to treatment with PET-guided, active-standard or
sham-standard TMS, and subsequently underwent 10 sessions of 10 Hz TMS delivered at 90% motor threshold with 1600 pulses/session, using a Magstim super-rapid device with active and sham
air-cooled figure-of-eight coils (Magstim, Withland, Dyfed, UK). Guided TMS was on a prefrontal target determined with FDG-PET. Standard stimulation was as usual left prefrontal, 5 cm
anterior to the hot spot of the hand motor cortical region. Patients and raters were blind to TMS modality. TREATMENT ALLOCATION The 31 patients in this imaging study had been randomly
allocated to standard TMS (_n_=9 in responder group, _n_=6 in nonresponder group) or to PET-guided TMS (_n_=8 in responders, _n_=8 in nonresponders; Table 1). No difference in allocation was
found across groups (_χ_2=0.31, df=1, _p_=0.56). No patient randomized to sham TMS was analyzed in the present study, as response to sham TMS might be related to different mechanisms than
response to active treatment, and as there were only 3 responders out of 14 sham-treated patients in that group. CLINICAL ASSESSMENT Baseline assessment was performed on the day before
scanning using the Montgomery–Åsberg Depression Rating Scale (MADRS) (Montgomery and Asberg, 1979), the 21-item Hamilton Depression Rating Scale (Ham-D) (Hamilton, 1960), and the Tyrer
anxiety scale (Tyrer et al, 1984). Response to TMS, defined as at least 50% decrease from baseline MADRS score, as in another TMS study of depressed patients (O'Reardon et al, 2007),
was assessed using the last clinical assessment performed just after the final TMS session. Among the actively treated patients, 17 were responders and 14 were nonresponders to TMS.
TREATMENTS Previous medication was titrated down to a minimal dose that did not lead to significant clinical worsening for at least 2 weeks before scanning. In all, 5 responders and 4
nonresponders had a stage II resistance (failure to at least two adequate trials of antidepressants) according to Thase and Rush criteria (Thase and Rush, 1997), 9 responders and 5
nonresponders a stage III (stage II and failure to tricyclics), 2 responders and 5 nonresponders a stage IV (stage III and failure to monoamine oxidase inhibitors (MAOIs)), and one patient
had a stage V resistance (stage IV and ECT resistance) in the responder to TMS group (Supplementary Table S1). COMORBIDITIES A total of 7 patients met criteria for a comorbid diagnosis of
anxiety disorder (panic disorder with or without agoraphobia, or generalized anxiety disorder); 11 patients had resistant depression in the course of bipolar disorder. Among the latter
patients, three had a bipolar II type disorder, all of which were in the nonresponder group. These comorbid diagnoses were equally distributed in both groups (Table 1). SCANNING PROTOCOLS
All participants were investigated at rest. They were instructed to lie and relax in the PET camera with eyes closed, in a quiet room with low dimmed light. Head movement was restricted with
an individually molded thermoplastic mask. [18F]-FDG-PET 3D images were obtained following a transmission scan for attenuation correction from a Siemens ECAT EXACT HR+ tomograph that
collects 63 simultaneous slices (intrinsic in-plane resolution: 4.3 mm; voxel size: 2.42 × 2.42 × 2.43 mm3). A summed image corresponding to the attenuation- and decay-corrected uptake of
the [18F]-FDG, expressed in activity concentration (Bq/ml), was obtained from two 3D time frames (10 min each) collected 30–50 min after intravenous injection of the radioligand. The mean
(SD) injected 18F-fluorodeoxyglucose radioactivity was 155.6 (9.25) MBq in the patients (see Table 1 for doses in groups), and 155.78 (19.65) MBq in healthy subjects (_t_=0.04, df=67,
_p_=0.96). The 3D structural MRIs were acquired on a 1.5 Tesla GE Signa scanner (General Electrics Medical Systems, Milwaukee, WI) using a T1-weighted spoiled gradient-recalled sequence (124
contiguous slices; field of view 24 cm; 256 × 256 matrix; voxel size: 0.94 × 0.94 × 1.3 mm3). Each of the [18F]-FDG-PET and T1-weighted images were visually inspected for artifacts. IMAGE
PROCESSING All of the [18F]-FDG-PET and structural images were processed with Statistical Parametric Mapping software package (SPM5, Wellcome Department of Cognitive Neurology, University
College, London, UK; http://www.fil.ion.ucl.ac.uk/spm), implemented on Matlab (The Mathworks, Natik, MA; http://www.mathworks.com). STRUCTURAL PREPROCESSING To take into account a possible
effect of structure on [18F]-FDG images, voxel-based morphometry (VBM) was performed using the unified segmentation implemented in SPM5 (Ashburner and Friston, 2005). T1-weighted images were
spatially normalized, segmented into gray and white matter, and modulated before being smoothed with a 10-mm full-width half-maximum (FWHM) isotropic Gaussian kernel. [18F]-FDG-PET
PREPROCESSING For the healthy subject group, each [18F]-FDG image was coregistered to its corresponding T1-weighted image using a rigid-body model. Transformation matrices obtained during
the spatial normalization of the T1-weighted images to the MNI template were then applied to the resulting [18F]-FDG images. The mean image of these [18F]-FDG images was computed, providing
a [18F]-FDG template that was then smoothed with an 8-mm FWHM isotropic Gaussian kernel. Finally, the [18F]-FDG images of all subjects were spatially normalized to this template and smoothed
with an 8-mm FWHM isotropic Gaussian kernel. STATISTICAL ANALYSIS DEMOGRAPHIC AND CLINICAL DATA Analyses were performed using JMP 8 software from SAS (SAS Institute, SAS Campus Drive, Cary,
NC). Unpaired _t-_tests and _χ_2 tests were used for comparing continuous and categorical variables, respectively, in between-group comparisons. Statistical significance was defined as
_p_<0.05, two tailed. IMAGE ANALYSIS Voxel-wise comparisons were performed using SPM5 within the framework of the general linear model (GLM). All results were obtained within the mask of
the hypothesized regions of interest, drawn using Wake Forest University (WFU) PickAtlas (Maldjian et al, 2003), including inferior frontal, middle frontal, superior frontal, medial frontal,
and orbital gyri, ACC, inferior temporal and parahippocampal gyri, insula, amygdala, caudate, and ‘extra-nuclear’ fiber tracts. Brain locations were reported as _x_, _y_, and _z_
coordinates in Montreal Neurologic Institute (MNI) space and WFU PickAtlas was used to convert MNI coordinates into Talairach coordinates. The Talairach and Tournoux atlas (Talairach and
Tournoux, 1988) was used to identify brain regions and approximate Brodmann areas (BA). MRI IMAGE ANALYSIS Group comparisons of structural images were performed on gray matter and white
matter tissues using an analysis of covariance (ANCOVA) with group (nonresponders, responders, and healthy subjects) as between-subject factor and age, gender, and total intracranial volume
as confounding covariates. An F-test was used to compare the three groups. Significance threshold was set at _p_<0.05, false discovery rate (FDR) corrected for multiple comparisons. PET
IMAGE ANALYSIS The [18F]-FDG 3D images were entered into the GLM within SPM5; in order to control for global glucose uptake effects, we used proportional scaling global normalization,
yielding an index of regional- relative to global- glucose uptake (gluMI). Baseline gluMI values were compared between responder, nonresponder patients, and healthy subjects using an ANCOVA,
with group as between-subject factor and age and gender as confounding covariates. An F-test was used to compare the three groups. Significance threshold was set at _p_<0.05, FDR
corrected for multiple comparisons. Thereafter, _post hoc t_-tests were performed within the regions where the F-test was significant. The ‘healthy group _versus_ responders’, ‘healthy group
_versus_ nonresponders’, and the ‘responders _versus_ nonresponders’ contrasts were examined. Significance was set at _p_<0.001, uncorrected. Cluster significance thresholds (extent
threshold) were set at 10 contiguous voxels (voxel size=8 mm3) to reduce type I errors introduced by potential noise. PET-MRI ANALYSIS Relations between gluMI and structure were assessed
using the biological parametric mapping (BPM) toolbox (Casanova et al, 2007). BPM combines information from different imaging modalities on a voxel-wise basis using the GLM. Imaging
variables are integrated on a voxel-wise basis, and hence each voxel has a unique regression design that includes the value of each imaging modality for that voxel. Group comparisons of
regional cerebral gluMI after accounting for volumetric changes were performed using an ANCOVA with group as between-subject factor, age and gender as basic confounding covariates, and
structural images as voxel-dependent confounding covariate. The _t_-tests were performed within the same regions where the F-test of the PET analysis was significant. The ‘healthy group
_versus_ responders’, ‘healthy group _versus_ nonresponders’, and the ‘responders _versus_ nonresponders’ contrasts were examined. Significance was set at _p_<0.001, uncorrected. Cluster
significance thresholds (extent threshold) were set at 10 contiguous voxels (voxel size=8 mm3). CORRELATION ANALYSES In order to explore the relationships between gluMI in different regions
(PET regional correlations) or between gluMI and clinical scores (PET-clinical symptoms correlations), individual gluMI values at significant peak voxels were extracted from the SPM F-map.
Correlation analyses were performed with JMP 8. All correlations were examined using ANCOVAs with group as between-subject factor. As our aim was to examine intergroup differences, we report
herein the interaction effects between groups and correlations. Significance was set at _p_<0.05 Bonferroni corrected, for all ANCOVAs. The _post hoc_ correlations were performed in each
group using Pearson's _r_ test, when an interaction effect was significant. RESULTS DEMOGRAPHIC, CLINICAL, AND TREATMENT CHARACTERISTICS OF THE PATIENTS Responders to TMS did not
differ from nonresponders with regard to clinical symptoms at baseline, disease history, comorbidities, family history of depression, TMS parameters, and type of ongoing and past treatments
including antidepressants, mood stabilizers, antipsychotics, benzodiazepines, or ECT prescriptions. No difference was found between subgroups regarding the resistance stage (_χ_2=1.48, df=2,
_p_=0.48; Table 1 and Supplementary Table S1). Additionally, bipolar (BP) and unipolar (UP) TRD patients did not differ regarding age (BP: mean age (SD)=47 (5.9), UP: mean age (SD)=47.8
(8.1), Student's _t-_test score=0.27, df=29, _p_=0.79), gender (BP: 6 women, 5 men, UP: 14 women, 6 men, _χ_2=0.73, df=1, _p_=0.39), age at onset (BP: 26.3 (7.7), UP: 29.3 (10.8),
_t_-score=0.82, df=28, _p_=0.42), duration of illness (BP: 20.7 (7.3) years, UP: 18.2 (10.0) years, _t-_score=0.73, df=28, _p_=0.47), duration of depressive episode (BP: 3.4 (3.3) years, UP:
2.7(1.8) years, _t-_score=0.77, df=28, _p_=0.44), number of depressive episodes (BP: 4.2 (1.9), UP: 3.4 (1.8), _t-_score=1.07, df=27, _p_=0.29), or family history (BP: yes=4, UP: yes=10,
_χ_2=0.54, df=1, _p_=0.46). UP and BP did not differ in depression scores improvement rate (BP: 55.6% (9.0%), UP: 44.8% (6.7%), _t-_score=0.96, df=29, _p_=0.34). PET FINDINGS There was a
main effect of group on the [18F]-FDG-PET images before accounting for structural differences, as evidenced by the results of the F-test, which revealed a pattern of several regions (Table
2). The _post hoc t_-tests performed in those regions showed that both responders and nonresponders to TMS had, in comparison with healthy subjects, lower prefrontal gluMI in right ACC,
right DLPFC, and left ventrolateral prefrontal cortex (VLPFC). Additionally, nonresponders had lower gluMI in _left_ ACC, _left_ DLPFC, right and left anterior insula, and left OFC. They
also displayed _higher_ gluMI in left inferior temporal–limbic regions including uncus, left amygdala, and left uncinate fasciculus. No significantly higher gluMI values were found in
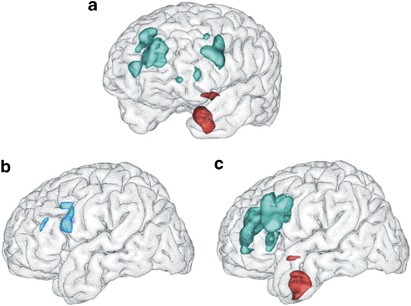
responders in comparison with healthy subjects. In nonresponders relative to responders, gluMI was higher in the left amygdala, uncinate fasciculus, and anterior commissure, and lower in the
left OFC (Table 2 and Figure 1). MRI CORRECTED PET FINDINGS When accounting for volume differences, regions that survived the volume correction included right ACC, right and left insula,
left DLPFC, left uncus at BA20, and left amygdala (Table 2). Volume fully accounted for lower gluMI in the left OFC, left VLPFC (BA9/47), left ACC, and right DLPFC. Higher gluMI was not
related to white matter volume in uncinate fasciculus or in anterior commissure. MRI FINDINGS Voxel-based comparison of the GM maps revealed no main effect of group at the _p_<0.05, FDR
corrected for multiple comparisons. However, at a more permissive threshold, GM volume reductions were observed in some regions where gluMI was low, including the left OFC (BA10, _t_=3.52,
_p_<.001 unc, _k_=36 voxels) in nonresponders relative to responders and relative to healthy subjects (_t_=2.87, _p_<.002, _k_=312 voxels), and in the left ACC (BA 32, _t_=3.40,
_p_<.001 unc, _k_=46) in nonresponders relative to healthy subjects. No regional difference was found in white matter maps between responders, nonresponders, and healthy subjects. FDG-PET
REGIONAL CORRELATIONS Responders, nonresponders, and healthy subjects significantly differed in several PET regional correlations. INTERACTIONS (F-TESTS) Significant interactions (gluMI ×
group) were found between left OFC and several regions in which metabolic level was independent of structure. Regions included left amygdala (F=8.20, df=2), left DLPFC at BA9 (F=11.79,
df=2), left VLPFC at BA9 (F=14.34, df=2), right ACC (F=8.18, df=2), and left uncus (BA20) (F=8.31, df=2). _POST HOC_ TESTS In the nonresponders, left amygdala gluMI was negatively correlated
with gluMI in the left OFC, whereas a positive correlation in the responders and no correlation in the healthy subjects was observed (Figure 2 and Table 3). A negative correlation was also
found in nonresponders between gluMI in left uncus and left OFC, but no correlation was found in responders or in healthy subjects. Positive correlations were observed in nonresponders, but
not in other groups, between OFC and (1) prefrontal regions including left DLPFC at BA9; (2) left VLPFC at BA9; and (3) right ACC. CLINICAL CORRELATIONS No significant interaction (gluMI ×
group) was found between gluMI and baseline scores of depression, anxiety scores, or between gluMI and change in depression scores after TMS. DISCUSSION Pretreatment brain glucose metabolism
at rest and regional volumes were investigated in patients with resistant depression to assess whether these characteristics could differentiate responders and nonresponders to prefrontal
TMS. Nonresponders had a pattern of widespread low prefrontal metabolism associated with high temporal–limbic resting-state metabolism. Low metabolism was related to variations in GM volume
in several regions, notably in left OFC and ACC, where lower GM volume was observed in nonresponders. Uniquely, different correlations between left amygdala and left OFC metabolism
distinguished the nonresponders, responders, and healthy subject groups. FUNCTIONAL CORRELATES OF RESPONSE TO TMS Few studies have examined brain correlates of antidepressant response to
high-frequency TMS and most of those studies have used single-photon emission computerized tomography (SPECT) in smaller groups of patients, pooling both medication-resistant and
nonresistant depressed patients, with response defined as a 30% decrease in depression scores (50% in the present study). _Responders_ to TMS have been found to have higher blood flow in
inferior frontal lobe before stimulation (Teneback et al, 1999), or lower blood flow in amygdala (Nadeau et al, 2002) than nonresponders, consistent with our results. Improvement in
depression scores with TMS has also been found to positively correlate with blood flow in the anterior cingulate (Langguth et al, 2007) and in the right peri-insular region (Mottaghy et al,
2002). Consistent with other studies of TRD patients (Videbech, 2000; Konarski et al, 2007), the present findings point to a pattern of decreased prefrontal glucose metabolism, particularly
in regions involved in TMS response, including the insula, the ACC, and the OFC. In _nonresponders_ to TMS relative to responders, low glucose metabolism was observed in these regions, and
related to lower GM volumes in the left ACC and in the rostral part of the left OFC. In line with this finding, hypometabolism in OFC has been hypothesized to be related to GM reduction in
more severely ill patients such as the nonresponders to TMS in our study (Drevets, 1999), whereas normal glucose metabolism in OFC has been reported in medication-resistant depressives with
no GM reduction (Drevets, 2000; Drevets et al, 2002). Thus, the present results support that OFC gray matter volume reduction might precondition a negative response to prefrontal TMS. A
functional pattern of prefrontal hypometabolism associated with temporal–limbic hypermetabolism has previously been reported in various groups of depressed patients regardless of resistance
to treatment (Konarski et al 2007; Brooks et al, 2009; Savitz and Drevets, 2009). In the present study, a functional amygdala hypermetabolism was only observed in the TRD nonresponders to
TMS, regardless of GM volume. Thus, the present findings raise the hypothesis that high metabolic levels of the temporal–limbic regions, particularly the amygdala, might precondition
nonresponse to prefrontal TMS. FRONTAL–LIMBIC CORRELATIONS IN RESISTANT DEPRESSIVES Distinct correlations were found between OFC and the _amygdala_ in nonresponders, responders, and healthy
subjects, indicating different frontal–limbic relations depending on the group. The OFC is involved in coding of the identity of the sensory stimuli and their rewarding properties (Schultz
et al, 1998), and is connected with the lateral nuclei of the amygdala, whose activity appears closely related to the context and level of aversiveness of the stimuli (Zald, 2003). Through
inhibitory projections to the amygdala, the lateral OFC is consequently involved in controlling information processing, particularly representation of rewards and punishments, and regulates
behavior expression and emotional responses (Hooker and Knight, 2006). Thus, GM reductions in this region may disturb interactions between orbital cortex and projections to the amygdala, and
to other connected regions such as the cingulate cortex or the striatum. Our findings are consistent with a frontal–limbic dysregulation in the subgroup of _nonresponders_, leading to
decreased frontal cortical regulation of temporal–limbic activation in response to negative stimuli, as has previously been hypothesized in TRD (Mayberg, 1997a). In these patients, and as
prefrontal TMS seems to modulate OFC activity (Nadeau et al, 2002), GM reduction of the OFC might partly account for the observed specific resistance to TMS. Such resistance to TMS in these
patients may additionally be related to altered white matter tracts in the ventral frontal–temporal–limbic network. Indeed, higher glucose metabolism was detected in left uncinate fasciculus
and anterior commissure in _nonresponders_, independently of white matter volumes. As pointed out by Buchbaum et al (2007), the increased metabolism might reflect increased energy need due
to defects in white matter that, in turn, may lead to inefficiency in brain circuitry. The uncinate fasciculus is a bidirectional pathway that links the anterior temporal lobe and amygdala
with the medial and orbital prefrontal cortices, and the anterior commissure is a fiber bundle that connects the inferior temporal with sites including the amygdala and OFC (Schmahmann and
Pandya, 2006). Thus, it can be speculated that because of changes in the OFC/VLPFC, and connecting white matter tracts such as the uncinate fasciculus, TMS would fail to modulate the
prefrontal cortex and temporal–limbic structure activity through the ventral-limbic pathway. LIMITATIONS First, although there is no larger FDG-PET study associated with a controlled TMS
trial, the short treatment duration might be seen as a limitation. Indeed, TMS has been found to be more effective with longer treatment durations (O'reardon et al, 2007). Thus, some
nonresponder patients in this study would perhaps have been responders had they been treated over a longer period of time. However, despite the small number of subjects and short treatment
duration, the results of the clinical trial (Paillère Martinot et al, 2009) showed that the chosen protocol accelerated the effect of TMS, with a strong effect size (Cohen's _d_=0.78;
Cohen, 1988) over sham stimulation, probably accounting for the high response rate in the study. A second limitation relates to previous medication. It was not possible to withdraw all
treatments in these difficult patients, and it was not possible to assess all the dosages prescribed along their illness as they had very long illness durations. However, antidepressant and
mood stabilizers were prescribed in usual standard dosages in all the patients. Effects of medication on FDG measures have been studied in a few studies, with inconsistent results.
Apparently, brain metabolic responses to antidepressants vary according to the underlying pathophysiology of the patient and the degree of symptomatic improvement (Saxena et al, 2002), and
chronic antidepressant drug treatment might reduce metabolism in the amygdala and ventral ACC in depressed subjects showing a positive treatment response only (Drevets et al, 2002). Here,
the patients were all similarly resistant to medication according to Thase and Rush criteria, and the number of patients on antidepressants and duration of illness or episode were comparable
across groups. Also, the number of patients on antipsychotics and the dosages were very small and similar in both patient groups, as was the number of patients on mood stabilizers; thus, it
is unlikely that their effect would have confounded the metabolic findings. Finally, most patients were on low doses of benzodiazepines, which have been reported to induce decreases in
glucose metabolic rates in regions such as the basal ganglia, thalamus, or visual cortex (Martinot, 1992). These effects might have blurred some differences with the comparison subjects, but
as the prescriptions of patients did not differ across subgroups, it is unlikely that these effects would have confounded the results of direct comparison of responders with nonresponders.
Moreover, the metabolic findings are consistent with findings of other studies of untreated depressed patients (Teneback et al, 1999). Third, in a few studies, resistance to TMS has been
associated with previous medication resistance, or anxiety comorbidity (Fregni et al, 2006; Brakemeier et al, 2008; Lisanby et al, 2009). In this study, medication resistance was comparable
across responders and nonresponders to TMS. Regarding comorbid anxiety, the number of patients with a comorbid anxiety disorder was similar in both groups, and anxiety scores before scanning
were similar across groups, and did not correlate with PET measures, which suggests that nonresponse parameters did not depend on anxiety comorbidity in this group. Fourth, the pooling of
patients with unipolar resistant depression and with resistant depression in the context of history of bipolar disorder may be considered as a limitation. At variance with most previous
reports, the present study aimed at assessing [18F]-FDG in highly treatment-resistant patients notwithstanding the UP/BP dichotomy, rather than to compare UP or BP subgroups. In addition,
many imaging studies indicate increased resting-state metabolism in the amygdala in Major Depressive Disorder as well as in BP depression (Savitz and Drevets, 2009). Regarding OFC,
resting-state activity has generally been found similarly increased in both UP and BP depressives (Drevets, 2000), although in more severely ill or TRD patients, studies have found no change
or decreased function (Mayberg et al, 1994; Savitz & Drevets, 2009). Thus, putative differences in functional pattern reported in the literature between BP and UP patients are not
clearcut. In addition in the present study, the UP/BP ratios were similar in both responder and nonresponder subgroups, and no difference was found between UP and BP patients regarding
improvement rates or depression history, or when comparing UP and BP groups using a similar image analysis, within the same regions of interest and at the same statistical threshold as in
the responder/nonresponder analysis. Regarding the responder/nonresponder comparisons, and although the groups were much smaller, the same left amygdala function and left OFC gray matter
pattern still distinguished responders from nonresponders within each subgroup. In both the BP and UP subgroups, nonresponders had significantly higher amygdala gluMI (Wilcoxon test, BP:
responders, mean (SD)=−1.36 (1.86), nonresponders mean (SD)=9.49 (2.04), _χ_2=5.63, _p_=0.02; UP: responders, mean (SD)=−2.19 (1.65), nonresponders mean (SD)=5.21 (1.82), _χ_2=6.48,
_p_=0.01). Similarly, BP and UP nonresponders had significantly lower GM in OFC than their responder counterparts (Wilcoxon test, BP: responders, mean (SD)=0.04 (0.02), nonresponders mean
(SD)=−0.03 (0.02), _χ_2=5.63, _p_=0.02; UP: responders, mean (SD)=0.01 (0.01), nonresponders mean (SD)=−0.04 (0.02), _χ_2=5.73, _p_=0.02). In addition, the differential relation between
amygdala and OFC gluMI according to treatment response (responders and nonresponders) was maintained in both the UP and BP diagnostic subgroups (gluMI × group interactions, UP: _t_=2.13,
_p_=0.05; BP: _t_=2.40; _p_=0.05). In summary, the results suggest that alterations in brain metabolism and structure influence the response to TMS. Response to prefrontal TMS might depend
on OFC volume and amygdala functioning. Further research is needed to determine the predictive value of such a functional pattern determined at an individual level in patients with resistant
depression referred to TMS therapy. REFERENCES * Annett M (1970). A classification of hand preference by association analysis. _Br J Psychol_ 61: 303–321. Article CAS PubMed Google
Scholar * Ashburner J, Friston KJ (2005). Unified segmentation. _Neuroimage_ 26: 839–851. Article PubMed Google Scholar * Barrett J, Della-Maggiore V, Chouinard PA, Paus T (2004).
Mechanisms of action underlying the effect of repetitive transcranial magnetic stimulation on mood: behavioral and brain imaging studies. _Neuropsychopharmacology_ 29: 1172–1189. Article
PubMed Google Scholar * Brakemeier EL, Wilbertz G, Rodax S, Danker-Hopfe H, Zinka B, Zwanzger P _et al_ (2008). Patterns of response to repetitive transcranial magnetic stimulation (rTMS)
in major depression: replication study in drug-free patients. _J Affect Disord_ 108: 59–70. Article PubMed Google Scholar * Brooks 3rd JO, Hoblyn JC, Woodard SA, Rosen AC, Ketter TA
(2009). Corticolimbic metabolic dysregulation in euthymic older adults with bipolar disorder. _J Psychiatr Res_ 43: 497–502. Article PubMed Google Scholar * Buchbaum MS, Buchbaum BR,
Hazlett EA, Haznedar MM, Newmark R, Tang CY _et al_ (2007). Relative glucose metabolic rate higher in white matter in patients with schizophrenia. _Am J Psychiatry_ 164: 1072–1081. Article
Google Scholar * Burgmer M, Pogatzki-Zahn E, Gaubitz M, Wessoleck E, Heuft G, Pfleiderer B (2009). Altered brain activity during pain processing in fibromyalgia. _Neuroimage_ 44: 502–508.
Article PubMed Google Scholar * Casanova R, Srikanth R, Baer A, Laurienti PJ, Burdette JH, Hayasaka S _et al_ (2007). Biological parametric mapping: a statistical toolbox for
multimodality brain image analysis. _Neuroimage_ 34: 137–143. Article PubMed Google Scholar * Chanraud S, Martelli C, Delain F, Kostogianni N, Douaud G, Aubin HJ _et al_ (2007). Brain
morphometry and cognitive performance in detoxified alcohol-dependents with preserved psychosocial functioning. _Neuropsychopharmacology_ 32: 429–438. Article PubMed Google Scholar *
Cohen J (1988). _Statistical Power Analysis for the Behavioral Sciences_. L Erlbaum Associates: Hillsdale, NJ. Google Scholar * Drevets WC (1999). Prefrontal cortical-amygdalar metabolism
in major depression. _Ann NY Acad Sci_ 877: 614–637. Article CAS PubMed Google Scholar * Drevets WC (2000). Neuroimaging studies of mood disorders. _Biol Psychiatry_ 48: 813–829. Article
CAS PubMed Google Scholar * Drevets WC, Bogers W, Raichle ME (2002). Functional anatomical correlates of antidepressant drug treatment assessed using PET measures of regional glucose
metabolism. _Eur Neuropsychopharmacol_ 12: 527–544. Article CAS PubMed Google Scholar * Drevets WC, Price JL, Simpson JR, Todd RD, Reich T, Vannier M _et al_ (1997). Subgenual prefrontal
cortex abnormalities in mood disorders. _Nature_ 386: 824–827. Article CAS PubMed Google Scholar * Fregni F, Marcolin MA, Myczkowski M, Amiaz R, Hasey G, Rumi DO _et al_ (2006).
Predictors of antidepressant response in clinical trials of transcranial magnetic stimulation. _Int J Neuropsychopharmacol_ 9: 641–654. Article CAS PubMed Google Scholar * George MS,
Wassermann EM, Williams WA, Callahan A, Ketter TA, Basser P _et al_ (1995). Daily repetitive transcranial magnetic stimulation (rTMS) improves mood in depression. _NeuroReport_ 6: 1853–1856.
Article CAS PubMed Google Scholar * Greden JF (2001). The burden of disease for treatment-resistant depression. _J Clin Psychiatry_ 62: 26–31. PubMed Google Scholar * Hamilton M
(1960). A rating scale for depression. _J Neurol Neurosurg Psychiatry_ 23: 56–62. Article CAS PubMed PubMed Central Google Scholar * Herrmann LL, Ebmeier KP (2006). Factors modifying
the efficacy of transcranial magnetic stimulation in the treatment of depression: a review. _J Clin Psychiatry_ 67: 1870–1876. Article PubMed Google Scholar * Hooker CI, Knight RT (2006).
The role of the lateral orbitofrontal cortex in the inhibitory control of emotion. In: Zald DH, Rauch SL (eds). _The Orbitofrontal Cortex_. Oxford University Press: Oxford, 307–324. Chapter
Google Scholar * Hornig M, Mozley PD, Amsterdam JD (1997). HMPAO SPECT brain imaging in treatment-resistant depression. _Prog Neuropsychopharmacol Biol Psychiatry_ 21: 1097–1114. Article
CAS PubMed Google Scholar * Houenou J, Wessa M, Douaud G, Leboyer M, Chanraud S, Perrin M _et al_ (2007). Increased white matter connectivity in euthymic bipolar patients: diffusion
tensor tractography between the subgenual cingulate and the amygdalo-hippocampal complex. _Mol Psychiatry_ 12: 1001–1010. Article CAS PubMed Google Scholar * Ketter TA, Kimbrell TA,
George MS, Dunn RT, Speer AM, Benson BE _et al_ (2001). Effects of mood and subtype on cerebral glucose metabolism in treatment-resistant bipolar disorder. _Biol Psychiatry_ 49: 97–109.
Article CAS PubMed Google Scholar * Konarski JZ, Kennedy SH, McIntyre RS, Rafi-Tari S, Soczynska JK, Mayberg HS (2007). Relationship between regional brain metabolism, illness severity
and age in depressed subjects. _Psychiatry Res_ 155: 203–210. Article CAS PubMed Google Scholar * Lam RW, Chan P, Wilkins-Ho M, Yatham LN (2008). Repetitive transcranial magnetic
stimulation for treatment-resistant depression: a systematic review and metaanalysis. _Can J Psychiatry_ 53: 621–631. Article PubMed Google Scholar * Langguth B, Wiegand R, Kharraz A,
Landgrebe M, Marienhagen J, Frick U _et al_ (2007). Pre-treatment anterior cingulate activity as a predictor of antidepressant response to repetitive transcranial magnetic stimulation
(rTMS). _Neuro Endocrinol Lett_ 28: 633–638. PubMed Google Scholar * Lisanby SH, Husain MM, Rosenquist PB, Maixner D, Gutierrez R, Krystal A _et al_ (2009). Daily left prefrontal
repetitive transcranial magnetic stimulation in the acute treatment of major depression: clinical predictors of outcome in a multisite, randomized controlled clinical trial.
_Neuropsychopharmacology_ 34: 522–534. Article PubMed Google Scholar * Little JT, Ketter TA, Kimbrell TA, Dunn RT, Benson BE, Willis MW _et al_ (2005). Bupropion and venlafaxine
responders differ in pretreatment regional cerebral metabolism in unipolar depression. _Biol Psychiatry_ 57: 220–228. Article CAS PubMed Google Scholar * Loo CK, Mitchell PB (2005). A
review of the efficacy of transcranial magnetic stimulation (TMS) treatment for depression, and current and future strategies to optimize efficacy. _J Affect Disord_ 88: 255–267. Article
PubMed Google Scholar * Maldjian JA, Laurienti PJ, Kraft RA, Burdette JH (2003). An automated method for neuroanatomic and cytoarchitectonic atlas-based interrogation of fMRI data sets.
_Neuroimage_ 19: 1233–1239. Article PubMed Google Scholar * Martinot JL (1992). Drug washout issues in studies of cerebral metabolism by positron emission tomography in psychiatric
patients. _J Neural Transm (Suppl)_ 37: 27–38. CAS Google Scholar * Mayberg HS (1997a). Limbic-cortical dysregulation: a proposed model of depression. _J Neuropsychiatry Clin Neurosci_ 9:
471–481. Article CAS PubMed Google Scholar * Mayberg HS, Brannan SK, Mahurin RK, Jerabek PA, Brickman JS, McGinnis S _et al_ (1997b). Cingulate function in depression: a potential
predictor of treatment response. _NeuroReport_ 8: 1057–1061. Article CAS PubMed Google Scholar * Mayberg HS, Lewis PJ, Regenold W, Wagner Jr HN (1994). Paralimbic hypoperfusion in
unipolar depression. _J Nucl Med_ 35: 929–934. CAS PubMed Google Scholar * Montgomery SA, Asberg M (1979). A new depression scale designed to be sensitive to change. _Br J Psychiatry_
134: 382–389. Article CAS PubMed Google Scholar * Mottaghy FM, Keller CE, Gangitano M, Ly J, Thall M, Parker JA _et al_ (2002). Correlation of cerebral blood flow and treatment effects
of repetitive transcranial magnetic stimulation in depressed patients. _Psychiatry Res_ 115: 1–14. Article PubMed Google Scholar * Nadeau SE, McCoy KJ, Crucian GP, Greer RA, Rossi F,
Bowers D _et al_ (2002). Cerebral blood flow changes in depressed patients after treatment with repetitive transcranial magnetic stimulation: evidence of individual variability.
_Neuropsychiatry Neuropsychol Behav Neurol_ 15: 159–175. PubMed Google Scholar * O'Reardon JP, Solvason HB, Janicak PG, Sampson S, Isenberg KE, Nahas Z _et al_ (2007). Efficacy and
safety of transcranial magnetic stimulation in the acute treatment of major depression: a multisite randomized controlled trial. _Biol Psychiatry_ 62: 1208–1216. Article PubMed Google
Scholar * Paillère Martinot ML, Galinowski A, Ringuenet D, Gallarda T, Lefaucheur JP, Bellivier F _et al_ (2009). Influence of prefrontal target region on the efficacy of repetitive
transcranial magnetic stimulation in patients with medication-resistant depression: a [18F]-fluorodeoxyglucose PET and MRI study. _Int J Neuropsychopharmacol_ 9: 1–15. Google Scholar *
Pascual-Leone A, Rubio B, Pallardó F, Catalá MD (1996). Rapid-rate transcranial magnetic stimulation of left dorsolateral prefrontal cortex in drug-resistant depression. _Lancet_ 347:
233–237. Article Google Scholar * Savitz J, Drevets WC (2009). Bipolar and major depressive disorder: neuroimaging the developmental-degenerative divide. _Neurosci Biobehav Rev_ 33:
699–771. Article PubMed PubMed Central Google Scholar * Saxena S, Brody AL, Ho ML, Alborzian S, Maidment KM, Zohrabi N _et al_ (2002). Differential cerebral metabolic changes with
paroxetine treatment of obsessive-compulsive disorder vs major depression. _Arch Gen Psychiatry_ 59: 250–261. Article CAS PubMed Google Scholar * Schmahmann JD, Pandya DN (2006).
Uncinate fasciculus. In: Schmahmann JD, Pandya DN (eds). _Fiber Pathways of the Brain_. Oxford University Press: New York, 419–425. Chapter Google Scholar * Schultz W, Tremblay L,
Hollerman JR (1998). Reward prediction in primate basal ganglia and frontal cortex. _Neuropharmacology_ 37: 421–429. Article CAS PubMed Google Scholar * Seminowicz DA, Mayberg HS,
McIntosh AR, Goldapple K, Kennedy S, Segal Z _et al_ (2004). Limbic-frontal circuitry in major depression: a path modeling metanalysis. _Neuroimage_ 22: 409–418. Article CAS PubMed Google
Scholar * Sheehan DV, Lecrubier Y, Sheehan KH, Amorim P, Janavs J, Weiller E _et al_ (1998). The Mini-International Neuropsychiatric Interview (M.I.N.I.): the development and validation of
a structured diagnostic psychiatric interview for DSM-IV and ICD-10. _J Clin Psychiatry_ 59 (Suppl 20): 22–33; quiz 34–57. PubMed Google Scholar * Talairach J, Tournoux P (1988).
_Co-Planar Stereotaxic Atlas of the Human Brain: An Approach to Medical Cerebral Imaging_. Thieme Medical Publishers: New York. Google Scholar * Teneback CC, Nahas Z, Speer AM, Molloy M,
Stallings LE, Spicer KM _et al_ (1999). Changes in prefrontal cortex and paralimbic activity in depression following two weeks of daily left prefrontal TMS. _J Neuropsychiatry Clin Neurosci_
11: 426–435. CAS PubMed Google Scholar * Thase ME, Rush AJ (1997). When at first you don't succeed: sequential strategies for antidepressant nonresponders. _J. Clin. Psychiatry_ 58
(Suppl 13): 23–29. PubMed Google Scholar * Tyrer P, Owen RT, Cicchetti DV (1984). The brief scale for anxiety: a subdivision of the comprehensive psychopathological rating scale. _J Neurol
Neurosurg Psychiatry_ 47: 970–975. Article CAS PubMed PubMed Central Google Scholar * Videbech P (2000). PET measurements of brain glucose metabolism and blood flow in major depressive
disorder: a critical review. _Acta Psychiatr Scand_ 101: 11–20. Article CAS PubMed Google Scholar * Zald DH (2003). The human amygdala and the emotional evaluation of sensory stimuli.
_Brain Res Brain Res Rev_ 41: 88–123. Article PubMed Google Scholar Download references ACKNOWLEDGEMENTS This study was supported by Grant PHRC/AOM-98099 from the Assistance
Publique-Hôpitaux de Paris (AP-HP) and the French Health Ministry; Grant INSERM-PROGRES A99013LS from the French Institute for Health and Medical Research (INSERM), and an AP-HP/INSERM
interface grant (M-L Paillère-Martinot); Dr D Ringuenet was supported by the ‘Fondation pour la Recherche Médicale’ (FRM) and the Atomic Energy Commission (CEA). We are grateful to Vincent
Brulon for image acquisition, Thierry Delzescaux and Claude Comtat for help with image processing, and Edouard Duchesnay for help with Brainvisa. AUTHOR INFORMATION AUTHORS AND AFFILIATIONS
* Department of Adolescent Psychopathology and Medicine, AP-HP, Maison de Solenn, Cochin Hospital, University Paris Descartes, Sorbonne Paris Cité, Paris, France Marie-Laure Paillère
Martinot * INSERM, U 1000, Research Unit ‘Imaging & Psychiatry’, University Paris-Sud and University Paris Descartes, Orsay, France Marie-Laure Paillère Martinot, Jean-Luc Martinot,
Hervé Lemaitre & Eric Artiges * CEA, DSV, I2BM, Service Hospitalier Frédéric Joliot, Orsay, France Jean-Luc Martinot, Hervé Lemaitre & Eric Artiges * Department of Psychiatry and
Addictology, AP-HP, Paul Brousse Hospital, University Paris-Sud, Villejuif, France Damien Ringuenet * SHU Sainte-Anne Hospital and INSERM, U 894, Psychiatry and Neuroscience Center,
University Paris Descartes, Paris, France André Galinowski & Thierry Gallarda * Department of Psychiatry, AP-HP, and INSERM, U 955, IMRB, Psychiatry Genetics, Henri Mondor-Albert
Chenevier Hospital, Créteil, France Frank Bellivier * Physiology Department, AP-HP, Henri Mondor-Albert Chenevier Hospital, University Paris 12, Créteil, France Jean-Pascal Lefaucheur *
Psychiatry Department 91G16, Orsay Hospital, Orsay, France Eric Artiges Authors * Marie-Laure Paillère Martinot View author publications You can also search for this author inPubMed Google
Scholar * Jean-Luc Martinot View author publications You can also search for this author inPubMed Google Scholar * Damien Ringuenet View author publications You can also search for this
author inPubMed Google Scholar * André Galinowski View author publications You can also search for this author inPubMed Google Scholar * Thierry Gallarda View author publications You can
also search for this author inPubMed Google Scholar * Frank Bellivier View author publications You can also search for this author inPubMed Google Scholar * Jean-Pascal Lefaucheur View
author publications You can also search for this author inPubMed Google Scholar * Hervé Lemaitre View author publications You can also search for this author inPubMed Google Scholar * Eric
Artiges View author publications You can also search for this author inPubMed Google Scholar CORRESPONDING AUTHOR Correspondence to Marie-Laure Paillère Martinot. ETHICS DECLARATIONS
COMPETING INTERESTS The authors declare no conflict of interest. Over the past 3 years, Dr Paillère Martinot has received compensation from Bristol-Meyers-Squibb, Lilly, and Sanofi
companies. Dr Artiges has received compensation from Janssen Laboratory; and Dr Galinowski from Ardix, Lilly, and Sanofi companies. ADDITIONAL INFORMATION Supplementary Information
accompanies the paper on the Neuropsychopharmacology website SUPPLEMENTARY INFORMATION SUPPLEMENTARY TABLE S1 (XLS 36 KB) POWERPOINT SLIDES POWERPOINT SLIDE FOR FIG. 1 POWERPOINT SLIDE FOR
FIG. 2 RIGHTS AND PERMISSIONS Reprints and permissions ABOUT THIS ARTICLE CITE THIS ARTICLE Martinot, ML., Martinot, JL., Ringuenet, D. _et al._ Baseline Brain Metabolism in Resistant
Depression and Response to Transcranial Magnetic Stimulation. _Neuropsychopharmacol_ 36, 2710–2719 (2011). https://doi.org/10.1038/npp.2011.161 Download citation * Received: 09 March 2011 *
Revised: 01 July 2011 * Accepted: 15 July 2011 * Published: 17 August 2011 * Issue Date: December 2011 * DOI: https://doi.org/10.1038/npp.2011.161 SHARE THIS ARTICLE Anyone you share the
following link with will be able to read this content: Get shareable link Sorry, a shareable link is not currently available for this article. Copy to clipboard Provided by the Springer
Nature SharedIt content-sharing initiative KEYWORDS * depression * fluorodeoxyglucose * magnetic resonance imaging * positron emission tomography * transcranial magnetic stimulation *
treatment response