Play all audios:
ABSTRACT “Paintings fade like flowers”: van Gogh’s prediction on the impact of age on paintings came true for most of his paintings. We have studied the consequences of this aging on the
_Sunflowers in a vase with a yellow background_ series, namely its original, F454, currently in London, and two replicates, F457, in Tokyo, and F458, in Amsterdam, which van Gogh painted
using the original as a model. The background and flower renditions in those paintings have faded and turned brown, making them less vibrant that van Gogh had most likely intended. We have
attempted to restore van Gogh’s intent using a computational approach based on data science. After identifications of regions of interest (ROI) within the three paintings F454, F457, and
F458 that capture the flowers, stems of the flowers, and background, respectively, we studied the geometry of the color space (in RGB representation) occupied by those ROIs. By comparing
those color spaces with those occupied by similar ROIs in photographs of real sunflowers, we identified shifts in all three color coordinates, R, G, and B, with the positive shift in the
blue coordinate being the more salient. We have proposed two algorithms, PCR-1 and PCR-2, for correcting that shift in blue and generate representations of the paintings that aim to restore
their original conditions. The reduction of the blue component in the yellow hues has lead to more vibrant and less brownish digital rendition of the three _Sunflowers in a vase with a
yellow background_. SIMILAR CONTENT BEING VIEWED BY OTHERS UNIVERSALITY AND SUPERIORITY IN PREFERENCE FOR CHROMATIC COMPOSITION OF ART PAINTINGS Article Open access 11 March 2022 SUSTAINING
THE LOCAL COLOR OF A GLOBAL CITY Article 10 April 2025 PERCEIVING THE REPRESENTATIVE SURFACE COLOR OF REAL-WORLD MATERIALS Article Open access 18 April 2023 INTRODUCTION Vincent van Gogh’s
series of paintings of Sunflowers are among his most famous creations. There are two such series, the first one executed in Paris in 1887 that depicts sunflowers lying on the ground, while
the second series was made later in Arles and represents sunflowers in a vase. Van Gogh made four versions of the Arles series in 1888, with different flower arrangements and different
backgrounds: turquoise for the first version, F453, royal-blue for the second version, F459, blue-green for the third version, F456, and yellow for the fourth version, F454. Note that we use
here the recognized classification of van Gogh’s paintings, where F stands for the De La Faille catalogue of these paintings. A year later van Gogh made one repeat of the third version
(F455), and two repeats of the 4th version (F458 and F457). The authenticity of the second repetition of the 4th version, F457, has been questioned, although experts now believe it is
authentic [1]. These three repetitions and their two originals are usually referred to as the Sunflowers in a vase, where the number of sunflowers vary even in van Gogh’s own recollection as
described in his correspondence [2]. They are all currently housed in different museums: the third version, F456, is in the Neue Pinakothek museum in Munich, Germany, and its repetition,
F455, is in the Philadelphia Museum of Art, United States; the fourth version, F454, is at the National Gallery in London, England, while its repetitions, F457 is at the Seiji Togo memorial
Sompo Japan Museum of Art, Tokyo, Japan, and F458 is at the van Gogh Museum Amsterdam. Those paintings are rarely reunited, with possibly the latest occurrence being an exhibit at the
National Gallery in London in 2014 were the original and one repetition of the 4th version were shown side to side. Interestingly, however, it is possible to see them virtually in the same
room in a virtual 360 \(^\circ\) exhibition commented by Vincent van Gogh’s grandson (https://www.facebook.com/VanGoghMuseum/videos/10159187334010597/). In this paper we focus on the fourth
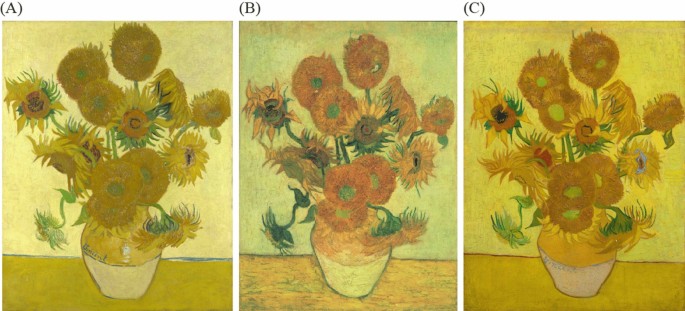
version, F454, and its two repetitions, F457 and F458, in which the vase with sunflowers is portrayed against a yellow background. This version is considered as a study of variations on the
theme of yellow, with the aim of achieving a light-on-light effect [1, 3]. Pictures of those three paintings are shown in Fig 1. Van Gogh’s Sunflowers appeal to many. The fascination exerted
by van Gogh’s stay in the south of France in 1888-1889, his friendship and fallout with Paul Gauguin, his mental health, and the seven sunflowers canvases he painted during that time remain
a tremendous source of inspiration in many forms of popular entertainment as well as for artists, museum curators, and scientists in general. Biologists have studied how bees interact with
those paintings [4], the genetic fabric of the sunflowers [5], doctors have attempted to associate his medical conditions and related treatments to his perception of colors [6,7,8]. Of
direct relevance to the paintings themselves, scientists and museum curators have used a broad array of traditional and state-of-the-art techniques to look at and below the paint surface
itself [9,10,11,12,13,14,15,16,17]. Of special interest, we advise the reader to consider the recent book, _Van Gogh’s Sunflowers Illuminated_ published by the Amsterdam van Gogh museum that
summarizes the results of the research undertaken by an international team of scientists, curators, and art historians aimed at comparing the F454 Sunflower from the London National gallery
with one of its repetitions, F458 from the van Gogh museum [18]. In this paper, we approach the same problem of comparing F454 with its repetitions F457 and F458 from a very different
perspective. Instead of analyzing the canvases and the paint surfaces directly, we study high resolution images of the paintings using a data science approach. The availability of large
collection of digital images of paintings has opened the door to the use of state-of-the-art supervised machine learning techniques in art, for understanding the artist's style [19],
for classifying paintings [20], to detect forgeries [21], and possibly for even creating art [22]. Our approach to analyzing one of the Sunflowers painting and two of its repeats differs as
it is unsupervised. We consider a painting based on a high-resolution image of it. This image is a collection of pixels, with each pixel characterized by its location and color. The color is
quantified based on the RGB color model. This is an additive color model in which Red, Green, and Blue lights are added together to reproduce any colors. In a digital image, the amount of
each R, G, and B color is discrete, usually an integer in the range [0, 255]. As such, a pixel in an image belongs to a discrete color space of size \([0, 255]^3\). Our analysis of F454,
F457, and F458 amounts to comparing their representations in this discrete color space. We are particularly interested in the sunflowers themselves, with their yellow crowns and stems as
they are at the heart of the three paintings. We acknowledge that our analyses may be somewhat subjective. We only use indirect representations of the three paintings by van Gogh, namely
digital images of those paintings. While those images are high resolution, it is not impossible that there are some color distortions, although those are expected to be small with modern
digital cameras (this will be addressed briefly in the following). More importantly, the paintings themselves are more than 130 years old and the modern images we have of those paintings
certainly differ from their original renderings. It is interesting that van Gogh himself was well aware that paintings age, as he wrote to his brother on April 30th 1889 that “paintings fade
like flowers” [2]. Many studies have focused on the chemistry of aging of van Gogh’s paintings [9,10,11,12,13,14,15,16], as well as attempts to predict the evolution of the appearance of
those paintings [23,24,25]. With this as a background, there are two main directions that we have followed in our analyses of the digital images of F454, F457, and F458: * i) _Identify
markers of aging from the color distributions in the digital images_. We were able to identify shifts in the red, blue, and green components of the images that are most likely a result of
aging. The most significant shift is observed for the blue component of yellow hues, leading to a browning and fading of those colors. Using this shift, we propose pseudo-color
reconstruction schemes that enable us to generate model images of the original paintings. We note that the same procedure can be used to extrapolate to models of the paintings in the future.
* ii) _Compare and contrast the use of colors in the original version, F454, and the two repetitions, F457 and F458, of the __Sunflowers in a vase with a yellow background_. In particular,
we identify differences between the repetitions that most likely reflect different intents by van Gogh. We organize the paper as follows. Major findings are shown in the "Results and
discussion" section. In particular, we provide an in depth analysis of the RGB color spaces of the digital images corresponding to the three paintings, F454, F457, and F458. For clarity
reason, we will refer to F454 as being the “London version”, F457 as the “Tokyo version”, and F458 as the “Amsterdam version”. By comparison with recent images of actual sunflowers, we
identify significant shifts in the blue components, B, of the images of those paintings and use those shifts to derive pseudo-color reconstruction (PCR) schemes to attempt to restore the
original images. We also propose a color transfer scheme that enables us to compare the three paintings. In the "Conclusion" section we briefly discuss the benefits of our approach
as well as future directions of research. Finally, in the "Materials and methods" section we provide technical details on the images we have used, on the statistical methods that
we implemented, as well as on the algorithms we have implemented. RESULTS AND DISCUSSION BASIC STATISTICS ON THE COLOR CONTENT OF THE THREE DIGITAL IMAGES OF THE SUNFLOWERS PAINTINGS A
digital image is composed of basic image elements, i.e. pixels. Each pixel is characterized by its position in the image and its color. In the RGB model, a color is described by 3
components, also called coordinates, representing the amounts _r_, _g_, and _b_, of red, green, and blue that need to be combined to generate that specific color. Each coordinate is an
integer value taken in the range [0, 255]. There are therefore \(256^3\) (approx. 17 millions) possible colors. We have used high resolution images for all three Sunflower paintings, namely
the London version, the Tokyo version, and the Amsterdam version. We are aware that there might be some color distortion in those images, associated with the fact that it is likely that
those images were taken with different cameras. In addition, we cannot exclude the effect of the resolution. While it is difficult to assess the importance of the cameras, we can at least
assess the importance of the resolution. We generated the distributions of the values for the red, green, and blue coordinates over the three high resolution digital images of the three
paintings, as well as for corresponding low resolution images (see "Materials and methods" section for details on how to generate those distributions). Results are shown in Fig. 2.
The low resolution images were taken from the museum websites directly. For the London version, the high resolution image has \(3349 \times 4226\) pixels, while its corresponding low
resolution image has \(629 \times 800\) pixels. Similarly, the high resolution image of the Tokyo version has \(3626 \times 4829\) pixels, while its corresponding low resolution image has
\(450 \times 602\) pixels, and the high resolution image of the Amsterdam version has \(3324 \times 4226\) pixels, while its corresponding low resolution image has \(609 \times 800\) pixels.
It is interesting that despite those significant differences in resolution, the distributions of red, green, and blue are very similar (although admittedly not identical) for the high of
low resolution images, for all three paintings, while different when comparing the paintings themselves. This gives us some confidence that we can perform such comparisons. In the remainder
of the paper, we will use only the high resolution images. As mentioned above, the distributions of red, green, and blue differ between the three paintings (see Fig. 2). While the
distributions of red and green values are relatively similar over the three images, with values that concentrate in the range [100, 255], the distributions of values of the blue coordinate
differ significantly. In the Tokyo version there are basically no pixels whose blue intensity is below 60 or otherwise stated nearly all its pixels have some blue component. In contrast, in
the Amsterdam version there are more than 5 % of the pixels that have a blue coordinate close to zero, namely no blue component. Clearly, something is different with the contributions of
blue in the paintings. This will be discussed in detail below. Interestingly, in the high resolution digital images of the London, Tokyo, and Amsterdam paintings, we observe only 2 %, 5 %,
and 3 % of those \(256^3\) colors, respectively, indicative of relatively low diversities of colors in the three paintings. While this may not be surprising as all three paintings are
predominantly yellow (see Fig. 1), it is noteworthy that the color diversity differ significantly between the painting. Indeed, the Tokyo version and the Amsterdam version are defined as
repetitions of the London version and therefore we could expect more similarities. We looked also at the association between pairs of fundamental colors in all three paintings, by computing
their relative conditional entropy HR (see "Materials and methods" section for details). The conditional entropy HR measures the amount of information shared between two colors.
Our definition of HR places it in the interval [0, 1]; it is equal to zero if the two colors are fully determined by each other, while conversely it is equal to 1 if the two colors are
completely independent. In Fig. 3 we display the values for the nine pairs of colors in the form of tables for the three images corresponding to the London, Tokyo, and Amsterdam versions. As
expected, a color compared to itself leads to a conditional entropy of zero. In contrast, the HR values for pairs of different colors reveal very low dependence between them. There are,
however, noticeable differences between the three images. COLOR DISTRIBUTIONS IN THE BACKGROUND, THE SUNFLOWER CROWNS, AND THE SUNFLOWER STEMS OF THE _SUNFLOWERS IN A VASE WITH A YELLOW
BACKGROUND_ Visual inspections show differences between the London version and the Tokyo and Amsterdam versions, respectively, especially when it comes to their colors. We see that the green
color of the stems is similar to the expected green for stems of real sunflowers. On the other hand, the yellow flowers are darker than the expected vibrant yellow of the petals of a real
sunflower, especially in the London version (see Fig. 1). There are many possible reasons for this darker color of the flowers. First, it could have been Van Gogh’s intent. It is known that
Van Gogh painted his series of paintings on sunflowers using real sunflowers are models. He painted the London version in late August 1888, when sunflowers usually start to fade [26].
Second, van Gogh used the yellow chrome pigment to color the sunflowers and it is known that this pigment darkened as it ages [9, 10, 27]. Finally, we analyze the colors of the paintings
using digital images of those paintings. The images are influenced by the lighting that was used at the time that they were taken, which may influence our perception of their colors (see
discussion above on the importance of resolution, as well as reference [25]). It is therefore difficult to isolate a specific origin, especially as those mentioned above are ultimately
non-exclusive. We propose a data-driven approach based on the analysis of the color space of the three paintings to provide some quantitative elements that describe the differences between
the three paintings, and their differences with real-life sunflowers. The _Sunflowers in a vase with a yellow background_ paintings include 15 sunflowers with their stem in a vase standing
on a table, with a yellowish background. For each painting, we identify three regions of interest, or ROI. A ROI is defined according to its position in the image as well as from its color
consistency. The first two ROIs relate to the flower crowns of the sunflowers (mainly yellow, yf-ROI) and the stems of the sunflowers (green, g-ROI), while the third ROI refers to the
background (bg-ROI), which includes the table, vase, and the region behind the sunflowers. In parallel, we analyzed two recents photographs of sunflowers (see Fig. 12), from which we
extracted the corresponding flower ROIs and stem ROIs. Extractions of the ROIs were performed as described in the Material and Methods section. Each ROI is defined as a set of pixels,
characterized by their locations and colors, with the latter given in the RGB space with three discrete coordinates with values in the range [0, 255]. THE YELLOW FLOWERS OF THE _SUNFLOWERS
IN A VASE WITH A YELLOW BACKGROUND_ We compared first the ROIs associated with the yellow parts of the sunflowers of the three paintings. Fig. 4 shows the distribution of colors of the
pixels associated with those ROIs in the red-green, red-blue, and green-blue planes. In the red-green plane, most pixels are found to follow the first diagonal, consistent with the general
yellow color of those ROIs. Interestingly, the original, namely the London version, and the Amsterdam repetition are found to be very similar. Both differ from the Tokyo repetition. The
differences with the Tokyo version are striking in the red-blue and blue-green planes, as blue appears with a wide range of values in the London and Amsterdam versions, from 0 to 120, while
it is always present in the Tokyo version, appearing in a much smaller range centered around 60. While there are differences between the three paintings in the diversity of color of their
yellow sunflowers, there are even bigger differences when we compare those sunflowers with real sunflowers, as observed by comparing Fig. 4 with Fig. 5. Those differences can be summarized
as follows: * i) The yellow of real sunflowers contain a minimal amount of blue, as illustrated in the blue-red and blue-green planes for the two photographs SF1 and SF2. In contrast, as
indicated above, the yellow observed in the sunflowers of the paintings contains a significant amount of blue. * ii) The yellow of the flowers of real sunflowers contains a wide range of
green covering nearly the whole spectrum of possible values from 0 to 250. In contrast, the green in the yellow of the flowers in the paintings is limited to the range [50, 250] in all three
paintings. * iii) Similarly, the yellow of the flowers of real sunflowers contains a wide range of red with values between 20 and 255. In contrast, the red in the yellow of the flowers in
the paintings is limited to the range [100, 250] in all three paintings. THE STEMS OF THE _SUNFLOWERS IN A VASE WITH A YELLOW BACKGROUND_ We repeated the analysis described above on the ROIs
corresponding to the green stems of the sunflowers, both for the 3 paintings of sunflowers and for the two photographs of real sunflowers. Results are shown in Figs. 6 and 7, respectively.
Comparisons of those two figures lead to the following observations: * i) Among the two copies, namely the Tokyo version and the Amsterdam version, the latter is the closest to the original
(the London version). This result is the same as what was observed for the yellow parts of the petals and crowns of the sunflowers. Differences associated with the Tokyo version again come
from a smaller range of blue coordinates for the pixels representing the stems. * ii) On average, the pixels in the green ROI of the Tokyo version contain more blue than the corresponding
pixels in the London version and the Amsterdam version. This is visible in the paintings themselves, as the stems in the Tokyo version appear with darker green (a consequence of the addition
of blue) than those of the London and Amsterdam versions. * iii) There is a stronger linear relationship between red and green coordinates for the stems of the real sunflowers, compared to
the stems in the three paintings. * iv) Besides the stronger relationship indicated above, the colors of the stems of the painted sunflowers qualitatively resemble the colors of the stems of
real sunflowers, as captured by photographs. THE BACKGROUNDS OF THE _SUNFLOWERS IN A VASE WITH A YELLOW BACKGROUND_ Finally, we compared the backgrounds of the three paintings in Fig. 8.
The background ROIs are expected to be the most diverse as they include multiple parts of the paintings. In addition, visual inspections of those paintings clearly indicate significant
differences (see Fig. 1): the background of the London version is globally pale yellow, while those of the Tokyo and Amsterdam versions are more green-yellow and solid yellow, respectively.
Those differences are reflected in the differences between the RGB space occupied by the pixels of the background, as illustrated in Fig. 8. The background ROI within the London version
shows a large number of pixels with large R, G, and B coordinates; those pixels will show as close to white. In contrast, a significant number of pixels in the background of the Tokyo
version have large G coordinates, consistent with a green coloration. Finally, the background of the Amsterdam version includes many pixels with high R and G coordinates, and low B
coordinate, consistent with a solid yellow. WHY THOSE DIFFERENCES BETWEEN THE PAINTINGS, AND BETWEEN THE PAINTED SUNFLOWERS AND REAL SUNFLOWERS? As mentioned in the introduction of this
section, there are possibly three main reasons for differences between the Sunflowers paintings themselves, and between the paintings and real sunflowers. Those reasons are associated to the
painter’s intent, to the aging of the paintings, and to artifacts associated with the digital images we consider. We exclude the latter as we believe that such artifacts are minor compared
to elements of the two other reasons [25]. The analyses we have presented above provide elements that highlight the importance of aging. The three Sunflower paintings currently in London,
Tokyo, and Amsterdam are more than 130 year old and as such they have been aging. They have been subject to color degradation and deterioration as the color pigments are constantly exposed
to light, humidity, pollution, and microbial contamination [13, 28]. It is known that Van Gogh used commercial oil paints for his paintings. In a letter to Arnold Koning, dated January 1889
and believed to refer to the London version of the Sunflowers , van Gogh described them as being “painted with the three chrome yellows, yellow ochre and Veronese green and nothing else”
(letter 740 [2]). Recent X-ray fluorescence spectrometry analyses of the London version [29] and of the Tokyo version [14] revealed that indeed van Gogh was using chrome yellows to render
yellow in those paintings; it is very likely that he was using the same pigments for the Amsterdam version. The aging of chrome yellow pigments used in paintings has been studied in details
[9,10,11, 13, 27], including studies on van Gogh’s Sunflowers [15]. Those studies have highlighted that the lightest hues in the chrome yellow family contain sulfate groups, which reduce the
pigments’ stability under light: bright yellow on canvases then turns to brownish green. Our comparisons of the yellow observed for real sunflowers and the yellow visible in the sunflowers
in the three paintings are consistent with those observations. In particular, we observe an increase in the amount of blue for the yellow pixels associated with the flowers in those
paintings, leading to a less vibrant yellow that may even look brown. In addition, we observe a shift to increased amount of green for those pixels (as none of them have green coordinates
below 50), while the distribution of green in the yellow of real sunflowers covers the whole spectrum. This increase in blue and green is consistent with the yellow colors appearing more
brownish green. While the differences in the yellow hues of the painted Sunflowers compared to the yellow hues in real sunflowers are explicit for all three paintings, highlighting aging of
those paintings, we have also observed significant differences between the Tokyo version of the repetition and the two other paintings, the London version (the original), and the Amsterdam
version (the second repetition). This is most likely the intent of van Gogh, as proposed by Bakker and Ripoelle [26]. Indeed, van Gogh painted the Tokyo version not based on real sunflowers
but based on another work of art, the London version (van Gogh painted the Tokyo version in January when there were no sunflowers available). In a letter to his brother Theo (letter 736,
[2]), van Gogh mentioned that this repetition was meant to be “equivalent and identical”, although it was clear that this referred to the subject (the vase and sunflowers), and not to
details and colors. Van Gogh pushed chromatic intensity even further, with the aim of achieving a radical light-on-light effect, such that the green stalks of the flowers contrast even more
strikingly with the various yellows than in the original, the London version. Those differences remain despite the aging of the paintings. In contrast, our analyses show that the Amsterdam
version appears closer to the original, the London version, than the other repetition, the Tokyo version. CAN WE REMEDIATE AGING OF COLORS IN PAINTINGS DIGITALLY? Paintings age and
consequently do not look today as they were originally designed by the artists. This is not evident at the level of the colors that undergo fading and sometimes changes in hue, such as
yellow turning into brown. While this aging is inevitable, there is great interest among curators to recreate the artists’ original colors to enhance the experience of museum visitors.
Paintings, however, cannot be physically restored to their original colors and only reconstructions offer the possibility of recreating their appearance as intended by the artist. Over the
past few years, digital reconstructions of several paintings by van Gogh and other post-impressionist artists have been published, including investigation of van Gogh’s series of The Bedroom
[30], The Starry Night [31], Undergrowth with Two Figures [32], Irises [33], Roses [33], and Fields with Irises near Arles [25]. Some of those reconstructions rely on identifications of
regions within the paintings that contain pigments that may have aged, using X-ray fluorescence, followed by digital reconstruction using software that can manipulate images (see for example
the digital reconstruction of van Gogh’s “Undergrowth with two figures” [32], or applications of software for optimizing the display of images on mobile devices [34]. The analyses of the
RGB space occupied by the pixels of the paintings _Sunflowers in a vase with a yellow background_ provided above suggest two other methods for digital reconstruction, namely color transfer
and color correction, which we describe below. RESTORING COLORS IN VAN GOGH’S SUNFLOWERS USING COLOR TRANSFER One approach to correcting aging in a painting is to transfer color from a
recent representation of an object onto the region representing that object in the painting. For example, we can transfer the yellow color from live sunflowers observed in photographs to the
regions representing sunflowers in one of the paintings. We illustrate this process in Fig. 9 for the London version, namely the original _Sunflowers in a vase with a yellow background_. We
start with the ROI corresponding to the yellow flowers of the London version as well as the corresponding ROI of the yellow flowers in the photograph SF1. We apply hierarchical clustering
on the pixels of each of those ROIs, using the Euclidean distance between their RGB coordinates as a metric, and complete linkage ("Materials and methods" section ). The
hierarchical clustering generates a tree; we represent the leaves of that tree with vertical bars whose colors are the colors of the corresponding pixels. Fig. 9A and B illustrate the
corresponding complete color bars for the yellow flower ROI of the London version, and for the yellow flower ROI of SF1, respectively. In the color bar associated to the London version, we
identify the cluster with the darkest hues of yellow and label the corresponding pixels as F454_A. The positions of those pixels within the London version are highlighted in red in Fig. 9C.
Similarly, we isolate the region with the brightest hues of yellow in SF1 and label corresponding pixels as SF1_A. Finally we transfer the color associated with SF1_A onto F454_A using the
transfer algorithm described in the Method section. Result of the transfer is shown in Fig. 9E, to be compared with the original, the London version, shown in Fig. 9D. As expected, the
sunflowers in the modified London version are much brighter. The color transfer strategy presented above can be expanded to play with color contrasts within the painting. We illustrate this
concept by modifying the background of the flowers in the London version, as illustrated in Fig. 10. van Gogh painted many variations of the sunflowers, with background varying from pale to
deep blue and yellow as he explored chromatic effects in the juxtaposition of those backgrounds with the yellow flowers of the sunflowers [26]. We decided to modify at least part of this
background to see how it visually impacts our perception of the paintings, using the London version as a support. We first identified pixels in the background of the London version that are
located mostly behind the sunflowers and have light yellow hues. Those pixels are referred to as F454_B (see Fig. 10C). We then selected pixels in the real sunflowers depicted in the
photograph SF1, which correspond to the dark yellow part of the flower crown. Those pixels are referred to as SF1_B. Finally we transfer the color associated with SF1_B onto F454_B using the
transfer algorithm described in the Method section. Result of the transfer is shown in Fig. 10E, to be compared with the original, namely the London version shown in Fig. 10D. As expected,
the sunflowers in the modified London version appear darker than in the original, as they are now put in a context of a darker background. RESTORING COLORS IN VAN GOGH’S SUNFLOWERS USING
COLOR CORRECTION Possibly the most striking difference we observed when comparing the hues of yellow in the flower depiction of the three versions of _Sunflowers in a vase with a yellow
background_ with the hues of yellow in real sunflowers observed in modern photographs is an increase in the amount of blue coordinates in those yellow hues in the paintings, leading to a
less vibrant and brownish yellow, in agreement with chemical analyses of the aging of chrome yellow [9,10,11, 13, 27]. This observation hints at an opportunity to restore algorithmically the
original colors of the Sunflowers: reducing the amount of blue for all pixels in the images of the paintings. We implemented two versions of such an algorithm as follows. We first note that
the images of the paintings have been divided into three ROIs, namely the flowers, yf-ROI, the stems of the flowers, g-ROI, and the background, bg-ROI. The first two ROIs are relatively
homogeneous in color, yellow and green, respectively, while the latter includes a more diverse spectrum of colors, as it includes the table, vase, and flower background. Each ROI is then
processed independently. All pixels within a ROI are clustered first, using the differences in their color as a metric, and hierarchical clustering ("Materials and methods" section
). The leaves of the corresponding tree are represented as vertical color lines, where the color of the line is the color of the leaf. Those color lines are organized as a color bar, which
is then segmented into clusters. Figs. 9A and 10A provide illustrations of such a color bar with its clusters for the yf-ROI and bg-ROI of the London version, respectively. Each cluster
regroups pixels with similar color within an ROI. Those clusters are then processed separately. For a given cluster _k_ within an ROI, we compute first the minimal blue coordinate, \(m_k\),
over all pixels in the cluster. Let _i_ be one such pixel, and let \(b_i\) be its blue coordinate. We correct this blue coordinate using one of the two following pseudo color restoration
(PCR) schemes: * PCR-1: \(b'_i = b_i - m_k\) * PCR-2: \(b'_i = b_i - \min (m_k, 60)\) PCR-1 was designed to remove as much blue as possible from the color coordinates of the pixels
in the images of the paintings. This correction is based on the observation that the yellow colors of real sunflowers contain nearly no blue, as seen in Fig. 5. It is expected to work well
for all yellow hues that have been tarnished. PCR-2 is a more gentle correction as it limits the amount of blue that can be deducted. The upper limit of 60 for this deduction comes from the
observation that the blue shift detected in the flower regions of the three paintings is close to this value (this is especially clear for the Tokyo version, see Fig. 4B). In Fig. 11 we show
the results of applying the two strategies PCR-1 and PCR-2 described above. There are a few observations associated with those reconstructions. First, visually the differences between PCR-1
and PCR-2 are small. This is expected as those two schemes are expected to act similarly on yellow hues, and yellow dominates in the three paintings. Second, there is a clear difference
between the restored images and the original images as the colors appear much brighter in the reconstructed images, especially the yellow in the background (see for example the effects on
the London version). While we need to be cautious as to ascertaining that the reconstructions represent the paintings as originally intended by van Gogh, we can safely say that they are most
likely closer to his intent, as van Gogh was playing with the contrasts between the sunflowers and the background (as he was experimenting with different colors and intensities for those
backgrounds) and that darker colors reduce this contrast (see Fig.10 D, E). Finally, the reconstructed models of the paintings highlight differences in the contrast between flowers and
background between the original, namely the London version, and the two repetitions, the Tokyo and Amsterdam versions, with the original based on a brighter background. This observation
reemphasize the importance given by van Gogh to the capture of light, colors, and contrast for the Sunflowers in a vase. CONCLUSION Vincent van Gogh was by no means a chemist by his own
admission (letter 889 to his brother Theo [2]). However, he was well aware that colors in paintings evolve due to changes in the chemical nature of their pigments: “...paintings fade like
flowers” (letter 765 to Theo, [2]). In the case of the _Sunflowers in a vase with a yellow background_, namely an original, the London version, and two replicates, the Tokyo and Amsterdam
versions that van Gogh painted using the original as a model, this sentiment came true, as the background and flower rendition in those paintings have faded and turned brown, making them
less vibrant than van Gogh had most likely aimed at. His intents with those paintings were to “push chromatic intensity ... with the aim of achieving a radical light-on-light effect” [26].
We have attempted to restore van Gogh’s intent using a computational approach based on data science. After identifications of regions of interest (ROI) within the three paintings that
capture the flowers, stems of the flowers, and background, respectively, we studied the geometry of the color space (in RGB representation) occupied by those ROIs. By comparing those color
spaces with those occupied by similar ROIs in photographs of real sunflowers, we identified shifts in all three color coordinates, R, G, and B, with the shift in the blue coordinate being
the more salient. This shift in blue that leads to hues of yellow that are faded and even brownish are consistent with the fading of the chrome yellow, the pigments used by van Gogh for
representing yellow in Sunflowers, observed by chemical spectroscopic methods [9,10,11, 13, 27]. We have proposed two algorithms, PCR-1 and PCR-2, for correcting that shift in blue and
generate representations of the paintings that aim to restore their original conditions (see Fig. 11). While we acknowledge that these are models, the reduction of the blue component in the
yellow hues has lead to more vibrant and less brownish digital rendition of the three _Sunflowers in a vase with a yellow background_. While we believe that the models we have generated for
the Sunflowers take the viewers closer to the paintings created by van Gogh, we acknowledge that the current state-of-the-art techniques for digital reconstructions, including our own, are
still limited in number and far from actually restoring the original version of the painter. Progress will ultimately come from combinations of techniques. We did not have access to
spectroscopic fluorescence data on the Sunflowers; we believe that such data would have helped us delineate the regions of interest in the paintings, in particular those regions where chrome
yellow dominates as those regions are more susceptible to fading due to aging of the chrome yellow pigments. In return, the computational methods proposed here for analyzing the RGB space
occupied by those regions should help identify the impact in color space of aging, as well as methods for reversing those effects. In addition, those methods enable manipulations of the
images of the paintings of interest and therefore the assessment of hypotheses on how the painter was experimenting with color juxtapositions within a painting. Based on our preliminary
studies of the Sunflowers, it is our intent to develop a general computational framework for digital restoration and manipulation of paintings and make this framework available as a tool for
enhancing painting viewing experience. MATERIALS AND METHODS MATERIAL: THE DIGITAL IMAGES USED IN THIS STUDY F454 is the fourth version of the Sunflowers painted by van Gogh while he was
living in Arles, with the specificity of having a yellow background in contrast with the turquoise (F453), royal-blue (F459), and blue-green (F456) for the other versions. It is currently
owned by the National Gallery in London, UK, and stored under the inventory number NG3863. The National Gallery only provides a low resolution image of this painting on its website; we found
a high resolution version on Wikimedia commons, from the URL https://upload.wikimedia.org/wikipedia/commons/4/46/Vincent_Willem_van_Gogh_127.jpg. This high resolution image is provided in
jpeg format, with a resolution of \(3,349\times 4,226\) pixels. F458 is one of the two repetitions of F454 painted by van Gogh, owned by and displayed at the Van Gogh Museum, Amsterdam. The
van Gogh museum only provides a low resolution image of this painting on its web site (https://www.vangoghmuseum.nl/en/collection/s0031V1962). However, just like for the London version, we
found a high resolution version on Wikimedia commons, from the URL https://upload.wikimedia.org/wikipedia/commons/9/9d/Vincent_van_Gogh_-_Sunflowers_-_VGM_F458.jpg. This high resolution
image is provided in jpeg format, with a resolution of \(3,224\times 4,226\) pixels. The high resolution image of F457 was generously provided by the Seiji Togo memorial Sompo Japan Museum
of Art, Tokyo, Japan. It was also provided in jpeg format, with a resolution of \(3626\times 4829\) pixels. In addition to the three high resolution images of the three paintings F454, F457,
and F458, dubbed the London, Tokyo, and Amsterdam versions, respectively, we used two recent digital images of sunflowers in a field, to capture actual colors of sunflowers. There two
pictures, which we label as SF1 and SF2, were obtained from: * SF1) A picture of sunflowers in Provence (Shuttersandsunflowers.com), downloaded with permission of the author. * SF2) A
picture of sunflowers in a field, by Leo Adamchuk, available within Adobe Stock and downloaded as part of their free trial. COLOR STATISTICS IN DIGITAL IMAGES A digital image is an image
composed of picture elements, or pixels. Each pixel is characterized by spatial coordinates, (_x_, _y_), that define its positions along the x-axis and y-axis within the image, as well as by
color components, (_r_, _g_, _b_), that define the amount of red (_R_), green (_G_), and blue (_B_) which, when combined, describe the color at the pixel. Note that we rely here on the
additive RGB color model; this model is not universally accepted and other models such as CMYK (a substractive model) or Lab are possible. We have used RGB as it is the color model that was
available with the images we recovered. In this RGB model, each color component _r_, _g_, or _b_ is an integer in the range [0, 255]. Namely, each fundamental color _R_, _G_, or _B_ is
described by a discrete variable that can take 256 distinct values, while a composite color is described by its 3 coordinates along those fundamental colors, and therefore belongs to a
discrete space (in this case a cube) with \([0,255]^3\) possible values. Let us define a digital image _I_ as the set _S_(_I_) of its pixels. Let _N_ be the cardinality of that set, namely
the total number of pixels in the image. Let _C_ be one of the fundamental colors, namely _C_ can be _R_, _G_, or _B_. As we have seen above, _C_ can take 256 possible discrete values, each
in the range [0, 255]. We can compute the distributions of these values over a given image as follows. Let _S_(_c_) be the set of pixels such that its color coordinate for the color _C_ is
_c_: $$\begin{aligned} S(c) = \{ p \in S(I) \quad | \quad C(p) = c \} \end{aligned}$$ The probability of observing color _C_ with intensity _c_ within the image is then given by:
$$\begin{aligned} P(C=c) = \frac{ |S(c)| }{N} \end{aligned}$$ (1) where |_S_(_c_)| stands for the number of elements of set _S_(_c_). The entropy of the color _C_ within the image is then
given by: $$\begin{aligned} H(C) = - \sum _{c=0}^{255} P(C=c) \log ( P(C=c) ) \end{aligned}$$ The entropy measures the amount of “information” associated with the color _C_ in the image. If
the color _C_ is always represented with the same value over each pixel, the entropy is zero, while if the possible values for the color are evenly distributed, the entropy is at its maximum
with a value of \(\log (256)\). We can also measure the association of fundamental colors within the image. Let _C_ and _D_ be two of the three fundamental colors. Let \(P(C=c, D=d)\) be
the joint probability of those colors _C_ and _D_ taking the values _c_ and _d_, respectively. If we define the set _S_(_c_, _d_) as $$\begin{aligned} S(c,d) = \{ p \in S(I) \quad | \quad
C(p) = c \; \& \; D(p) = d\} \end{aligned}$$ then $$\begin{aligned} P(C=c, D=d) = \frac{ |S(c,d)| }{N} \end{aligned}$$ (2) From this joint probability, we can compute the conditional
probability that \(C=c\), knowing that \(D=d\), as $$\begin{aligned} P(C=c \; | \; D=d) = \frac{ P(C=c, D=d) }{P(d)} \end{aligned}$$ . Let us define now \(H(C \; | \; D=d)\) as the entropy
of the color _C_ conditioned on the color _D_ taking the value _d_. This entropy is computed as: $$\begin{aligned} H(C \; | \; D=d)= & {} - \sum _{c=0}^{255} P(C=c \; | \; D=d) \log
(P(C=c \; | \; D=d)) \\= & {} - \sum _{c=0}^{255} \frac{P(C=c, D=d)}{P(D=d)} \log \frac{ P(C=c , D=d)}{P(D=d)} \end{aligned}$$ where the sums extend over all 256 possible values for the
coordinates associated to the color _C_. The entropy of the color _C_ conditioned on the color _D_ is then computed as the average of those numbers over all possible values for _d_:
$$\begin{aligned} H(C \; | \; D)= & {} \sum _{d=0}^{255} P(D=d) H(C \; | \; D=d) \\= & {} - \sum _{d=0}^{255} P(D=d) \sum _{c=0}^{255} \frac{P(C=c , D=d)}{P(D=d)} \log \frac{ P(C=c ,
D=d)}{P(D=d)} \\= & {} - \sum _{d=0}^{255} \sum _{c=0}^{255} P(C=c , D=d) \log \frac{ P(C=c , D=d)}{P(D=d)} \end{aligned}$$ where the probabilities \(P(D=d)\) and \(P(C=c , D=d)\) are
computed using Eqs. 1 and 2, respectively. Finally, we compute the relative conditional entropy as $$\begin{aligned} HR(C \; | \; D) = \frac{H(C \; | \; D)}{H(C)} \end{aligned}$$ \(HR(C \; |
\; D)\) takes values between 0 and 1. \(HR(C \; | \; D) = 0\) if and only if the values of _C_ are completely determined by the values of _D_. Conversely, \(HR(C \; | \; D) =1\) if and only
if the values of _C_ and _D_ are independent of each other. HIERARCHICAL CLUSTERING ANALYSIS (HCA) Clustering is the task of regrouping objects such that those that belong to the same
group, called a cluster, are more similar to each other than to those in other groups. In our analyses, the objects are pixels within an image. A pixel _P_(_i_) is characterized by its
color, _c_(_i_), given as a combination of its composents along the fundamental colors _R_, _G_, and _B_, i.e. \(c(i)=(r(i),g(i),b(i))\). As described above, _c_(_i_) belongs to the 3D
discrete space \([0, 255]^3\). The similarity between two pixels _P_(_i_) and _P_(_j_) is set to be the Euclidean distance between their colors: $$\begin{aligned} d(P(i), P(j)) = \sqrt{
(r(i)-r(j))^2 + (g(i)-g(j))^2 + (b(i)-b(j))^2 } \end{aligned}$$ (3) The clustering of the pixels is then performed using the agglomerative hierarchical clustering analysis, or HCA. The is a
bottom-up approach in which each pixel starts in its own cluster, and pairs of clusters are merged iteratively until all pixels belong to the same cluster. The whole procedure defines a
hierarchy of clusters, also referred as as a clustering tree. A key element to this procedure is to define the distance between two clusters, also referred to as the linkage criterion. When
the two clusters contain a single element, this distance is simply the distance between those elements, as defined in Eq. 3. When the two clusters A and B are sets of elements, the distance
is then defined as a function of the pairwise distances between those elements. Two common choices are the single linkage: $$\begin{aligned} d(A,B) = \min \{d(a,b), a\in A, b \in B\}
\end{aligned}$$ and the complete linkage: $$\begin{aligned} d(A,B) = \max \{d(a,b), a\in A, b \in B\} \end{aligned}$$ We have used the complete linkage in all our analyses. IDENTIFYING
REGIONS OF INTEREST IN THE PAINTINGS _SUNFLOWERS IN A VASE WITH A YELLOW BACKGROUND_ A region of interest (ROI) is defined according to its position in the image as well as on its color
consistency. In the _Sunflowers in a vase with a yellow background_, we identify three such ROIs, namely the flower crowns of the sunflowers (yellow), yf-ROI, the stems of the sunflowers
(green), g-ROI, and the background, bg-ROI. Automated segmentation is one approach for selecting the pixels that belong to each ROI. We have used instead a combination of manual and
automated processing, using the algorithm described below. This algorithm is based on the fact that the yf-ROI and g-ROI are chosen based on color consistency. We first divide the whole
discrete RGB space \([0, 255]\times [0, 255]\times [0, 255]\) into a collection of \(5\times 5\times 5\) color cubes. All pixels of an image are then attached to those cubes based on their
colors. Cubes that are occupied are then assigned a representative, whose color is identified as the center of the cube. All those representatives are then clustered using the HC technique
described above, using the Euclidean distance between their colors as a similarity measure, and complete linkage. At the bottom of the HC tree, we draw a color bar with each leave of the
tree represented with a vertical line whose color corresponds to the cube associated with that leave. The HC tree is then cut to form 70 clusters; we chose 70 somewhat arbitrarily, such that
we would have enough clusters. Most of those clusters have consistent colors along the color bar described above. Two groups of clusters are selected visually, those that are predominantly
yellow, with a yellow that resembles the yellow of the flower in the paintings, and those that are predominantly green. Each of this group is then processed separately. Let _G_ be the group
of clusters of green colors identified above. Collect all the pixels in _G_, and repeat the procedure described above, but with the RGB space divided into a collection of \(4\times 4\times
4\) cubes. Again, identify all cubes that are not empty, cluster their representatives, and select only those clusters that contain pixels whose colors are consistently green. The remaining
pixels are processed one last time, with the RGB space divided into a collection of \(3\times 3\times 3\) cubes. All the corresponding occupied cubes are ordered with respect to the number
of pixels they contain. Cubes are retained by going down on the ordered list, starting with the most populated cube, until 90% of the remaining pixels are selected. Finally, those pixels are
identified in the paintings, and those that do not correspond to a flower stem are discarded. The remaining pixels form the green ROI, g-ROI, associated with the stems of the sunflowers.
Let _Y_ be the group of clusters of yellow colors identified in the first step of the algorithm. This group of clusters is processed in the same way as _G_ was processed, leading to a group
of pixels that are mostly yellow and that belong to the crowns of the sunflowers. This group of pixels forms the yf-ROI, associated with the crowns of the sunflowers. Finally, all pixels
that do not belong to the g-ROI and yf-ROI are deemed to belong to the background (this includes the table in the front, the vase, and the background behind the flowers. Those pixels form
the bg-ROI. REGION SPECIFIC COLOR TRANSFER BETWEEN TWO IMAGES Assume that we have identified a set of pixels _A_ in one picture and that those pixels have similar (also not necessarily
equal) colors. Similarly, we have identified a set of pixels _B_ in another picture, with similar colors. _A_ and _B_ may be of different size and may contain different colors. Our goal is
to transfer the colors from _A_ to _B_. Let \(A=\{\mathbf{a }_1, \ldots , \mathbf{a} _i, \ldots , \mathbf{a} _N\}\) and \(B=\{\mathbf{b }_1, \ldots , \mathbf{b} _j, \ldots , \mathbf{b}
_M\}\) where the \(\mathbf{a}\)s and \(\mathbf{b}\)s are 3D vectors containing the R, G, and B coordinates of the colors of the pixels in _A_ and _B_, respectively. We apply the following
algorithm: * i) Compute the centers of mass of _A_ and _B_: \(\bar{\mathbf{a }}\) and \(\bar{\mathbf{b }}\); * ii) Translate _B_ to \(B^{*}\) so that _A_ and \(B^*\) have the same center of
mass: \(B^{*}=\{\mathbf{b }^{*}_1, \ldots , \mathbf{b} ^{*}_j, \ldots , \mathbf{b} ^{*}_M\}\) with \(\mathbf{b} ^{*}_j = \mathbf{b} _j - \bar{\mathbf{b }} + \bar{\mathbf{a }}\); * iii) Build
a HC-tree on the union of _A_ and \(B^*\), using the Euclidean distance as a metric and complete linkage, and cut at a tree level to define clusters. If a cluster only contains elements
originally from \(B^{*}\), merge it with its closest cluster (in terms of tree distance) that contains elements of _A_. At the end of this procedure, we have a set of clusters, with each
cluster containing either elements of _A_ and \(B^{*}\), or elements of _A_ only. The latter are discarded. * iv) Let _C_ be one of the clusters from step iii), and let \(AC= \{\mathbf{a
}_1, \ldots , \mathbf{a} _i, \ldots , \mathbf{a} _{NC}\}\) and \(BC=\{\mathbf{b }^*_1, \ldots , \mathbf{b} ^*_j, \ldots , \mathbf{b} ^*_{MC}\}\) be the subsets of _A_ and \(B^{*}\) that
belong _C_, where _NC_ and _MC_ are their sizes, respectively. For each _j_ in [1, _MC_], replace \(\mathbf{b} ^*_j\) with a color picked randomly in _AC_. Repeat over all clusters _C_. At
the end of this procedure, each element _j_ of _B_ has been assigned a new color \(b^*_j\) that is inherited from _A_. The pixels in the second picture are then assigned those new colors.
AVAILABILITY OF DATA AND MATERIALS Digital copies of the three paintings F454, London, F457, Tokyo, and F458, Amsterdam, of the two photographs SF1 and SF2, as well as all R scripts used for
this paper are included in the submission as a compressed zip file, attached as electronic supplementary material. REFERENCES * van Tilborgh L, Hendricks E. The Tokyo Sunflowers: a genuine
repetition by Van Gogh or a Schuffenecker forgery? Van Gogh Mus J. 2001;1:17-43. Google Scholar * Bakker N, Jansen L, Luijten H. Vincent van Gogh: a life in letters. London, UK: Thames and
Hudson; 2020. Google Scholar * van Tilborgh L. Van Gogh and the Sunflowers. Amsterdam, NL: Van Gogh Museum; 2008. Google Scholar * Chittka L, Walker J. Do bee like Van Gogh’s Sunflowers?
Opt Laser Technol. 2006;38:323–8. Article Google Scholar * Chapman MA, Tang S, Draeger D, Nambeesan S, Shaffer H, Barb JG, Knapp SJ, Burke JM. Genetic analysis of floral symmetry in Van
Gogh’s sunflowers reveals independent recruitment of CYCLOIDEA genes in the Asteraceae. PLoS Genet. 2012;8:1002628. Article Google Scholar * Arnold WN, Loftus LS. Xanthopsia and van Gogh’s
yellow palette. Eye (Lond). 1991;5:503–10. Article Google Scholar * Blumer D. The illness of Vincent van Gogh. Am J Psychiatry. 2002;159:519–26. Article Google Scholar * Gruener A.
Vincent van Gogh’s yellow vision. Br J Gen Pract. 2013;63:370–1. Article Google Scholar * Monico L, Van der Snickt G, Janssens K, De Nolf W, Miliani C, Verbeeck J, Tian H, Tan H, Dik J,
Radepont M, Cotte M. Degradation process of lead chromate in paintings by Vincent van Gogh studied by means of synchrotron X-ray spectromicroscopy and related methods. 1. artificially aged
model samples. Anal Chem. 2011;83:1214–23. Article CAS Google Scholar * Monico L, Janssens K, Miliani C, Van der Snickt G, Brunetti BG, Cestelli Guidi M, Radepont M, Cotte M. Degradation
process of lead chromate in paintings by Vincent van Gogh studied by means of spectromicroscopic methods. 4. Artificial aging of model samples of co-precipitates of lead chromate and lead
sulfate. Anal Chem. 2013;85:860–7. Article CAS Google Scholar * Monico L, Janssens K, Vanmeert F, Cotte M, Brunetti BG, Van der Snickt G, Leeuwestein M, Salvant Plisson J, Menu M, Miliani
C. Degradation process of lead chromate in paintings by Vincent van Gogh studied by means of spectromicroscopic methods. part 5. Effects of nonoriginal surface coatings into the nature and
distribution of chromium and sulfur species in chrome yellow paints. Anal Chem. 2014;86:10804–11. Article CAS Google Scholar * Monico L, Janssens K, Hendriks E, Vanmeert F, Van der Snickt
G, Cotte M, Falkenberg G, Brunetti BG, Millani C. Evidence for degradation of the chrome yellows in Van Gogh’s Sunflowers: a study using noninvasive in situ methods and
synchrotron-radiation-based X-ray techniques. Angew Chem Int Ed. 2015;54:13923–7. Article CAS Google Scholar * Vanmeert F, Hendriks E, Van der Snickt G, Monico L, Dik J, Janssens K.
Chemical mapping by macroscopic X-ray powder diffraction (MA-XRPD) of Van Gogh’s sunflowers: identification of areas with higher degradation risk. Angewandte Chemie (International ed in
English). 2018;57:7418–22. Article CAS Google Scholar * Hendriks E, Geldof M, Monico L, Johnson DH, Miliani C, Romani A, Grazia C, Buti D, Brunetti BG, Janssens K, Van der Snickt G,
Vanmeert F. Methods and materials of the Amsterdam Sunflowers. Amsterdam: Amsterdam University Press; 2019. p. 85–123. Google Scholar * Monico L, Hendriks E, Geldof M, Miliani C, Janssens
K, Brunetti BG, Cotte M, Vanmeert F, Chieli A, Van der Snickt G, Romani A, Melo MJ. Chemical alteration and colour changes in the Amsterdam Sunflowers: a focus on Geranium Lakes and Chrome
Yellows. Amsterdam: Amsterdam University Press; 2019. p. 125–57. Google Scholar * van den Berg KJ, Hendriks E, Geldof M, de Groot S, van der Werf I, Miliani C, Moretti P, Cartechini L,
Monico L, Iwanicka M, Targowski P, Sylwestrzak M, Genuit W. Structure and chemical composition of the surface layers in the Amsterdam Sunflowers. Amsterdam: Amsterdam University Press; 2019.
p. 159–73. Google Scholar * Iwanicka M, Sylwestrzak M, Szkulmowska A, Targowski P. Methods and techniques. Amsterdam: Amsterdam University Press; 2019. p. 207–27. Google Scholar *
Hendriks E, Vellekoop M. Van Gogh’s Sunflowers illuminated: art meets science. Amsterdam: Amsterdam University Press; 2019. Book Google Scholar * van Noord N, Hendriks E, Postma E. Toward
discovery of the artist’s style: learning to recognize artists by their artworks. IEEE Signal Process Mag. 2015;32:46–54. Article Google Scholar * Sandoval C, Pirogova E, Lech M. Two-stage
deep learning approach to the classification of fine-art paintings. IEEE Access. 2019;7:41770–81. Article Google Scholar * Polatkan G, Jafarpour S, Brasoveanu A, Hughes S, Daubechies I.
Detection of forgery in paintings using supervised learning. In: 2009 16th IEEE International Conference on Image Processing (ICIP); 2009. pp. 2921–2924. * Coeckelbergh M. Can machines
create art? Philos Technol. 2017;30:285–303. Article Google Scholar * Hendriks E, Brokerhof AW, van den Meiracker K. Valuing van Gogh’s colours: from the past to the future. In: ICOM
Committee for Conservation 18th Triennial Meeting; 2017. * Geldof M, Proaño Gaibor AN, Ligterink F, Hendriks E, Kirchner E. Reconstructing van Gogh’s palette to determine the optical
characteristics of his paints. Herit Sci. 2018;6:17. Article Google Scholar * Kirchner E, Geldof M, Hendriks E, Proaño Gaibor AN, Janssens K, Delaney J, van der Lans I, Ligterink F, Megens
L, Meedendorp T, Pilz K. Recreating van Gogh’s original colors on museum displays. In: Eschbach R, Marcu GG, Rizzi A, editors. Color imaging XXIV: displaying, processing, hardcopy, and
applications, Burlingame, CA, USA, 13–17 January 2019. Oxford, United Kingdom: Ingenta; 2019. * Bakker N, Riopelle C. The sunflowers in perspective. Amsterdam: Amsterdam University Press;
2019. p. 21–47. Google Scholar * Barberio M, Skantzakis E, Sorieul S, Antici P. Pigment darkening as case study of in-air plasma-induced luminescence. Sci Adv. 2019;5:eaar6228. * Korenberg
C. The photo-ageing behaviour of selected watercolour paints under anoxic conditions. Br Mus Tech Res Bull. 2008;2:49–57. Google Scholar * Higgitt C, Macaro G, Spring M. Methods, materials
and condition of the London Sunflowers. Amsterdam: Amsterdam University Press; 2019. p. 49–83. Google Scholar * Fiedler I, Hendriks E, Meedendorp T, Menu M, Salvant J. Materials, intention,
and evolution. New Haven, CT: Yale University Press; 2016. Google Scholar * Zhao Y, Berns RS, Taplin L, Coddington J. An investigation of multispectral imaging for the mapping of pigments
in paintings. In: Stork DG, Coddington J (editors) Computer image analysis in the study of art, 2008;vol. 6810, pp. 65–73. * Fieberg JE, Knutås P, Hostettler K, Smith GD. “Paintings fade
like flowers’’: pigment analysis and digital reconstruction of a faded pink lake pigment in Vincent van Gogh’s undergrowth with two figures. Appl Spectrosc. 2017;71:794–808. Article CAS
Google Scholar * Centeno SA, Hale C, Carò F, Cesarotto A, Shibayama N, Delaney J, Dooley K, van der Snickt G, Janssens K, Stein SA. Van Gogh’s irises and roses: the contribution of chemical
analyses and imaging to the assessment of color changes in the red lake pigments. Herit Sci. 2017;5:18. Article Google Scholar * Kirchner E, van der Lans I, Martínez-Verdú FM, Perales E.
Improving color reproduction accuracy of a mobile liquid crystal display. J Opt Soc Am A. 2017;34:101–10. Article Google Scholar Download references ACKNOWLEDGEMENTS We thank Mr Akihiro
Murata, the Exhibition General Manager of the Seiji Togo memorial Sompo Japan Museum of Art, Tokyo, Japan, for providing us with the high-resolution image of F457 as well as for informative
discussions. We also thank Miss Julia Webb for building a Shinny package for this research project. FUNDING This research received no specific grant from any funding agency in the public,
commercial, or not-for-profit sectors AUTHOR INFORMATION Author notes * Shuting Liao and Patrice Koehl have contributed equally to this work AUTHORS AND AFFILIATIONS * Graduate Group in
Biostatistics, University of California, Davis, One Shields Avenue, 95616, Davis, USA Shuting Liao * Department of Computer Science and Genome Center, University of California, Davis, 451
East Health Sciences Drive, 95616, Davis, USA Patrice Koehl * Department of Mathematics, University of California, Davis, One Shields Avenue, 95616, Davis, USA Jennifer Schultens *
Department of Statistics, University of California, Davis, One Shields Avenue, 95616, Davis, USA Fushing Hsieh Authors * Shuting Liao View author publications You can also search for this
author inPubMed Google Scholar * Patrice Koehl View author publications You can also search for this author inPubMed Google Scholar * Jennifer Schultens View author publications You can also
search for this author inPubMed Google Scholar * Fushing Hsieh View author publications You can also search for this author inPubMed Google Scholar CONTRIBUTIONS S. L. performed all the
data analyses as well as wrote the code needed for those analyses. F. H. and P. K. supervised the study. All authors designed the study, wrote, edited, read and approved the final
manuscript. CORRESPONDING AUTHOR Correspondence to Fushing Hsieh. ETHICS DECLARATIONS COMPETING INTERESTS The authors have no competing financial interests ADDITIONAL INFORMATION
PUBLISHER'S NOTE Springer Nature remains neutral with regard to jurisdictional claims in published maps and institutional affiliations. RIGHTS AND PERMISSIONS OPEN ACCESS This article
is licensed under a Creative Commons Attribution 4.0 International License, which permits use, sharing, adaptation, distribution and reproduction in any medium or format, as long as you give
appropriate credit to the original author(s) and the source, provide a link to the Creative Commons licence, and indicate if changes were made. The images or other third party material in
this article are included in the article's Creative Commons licence, unless indicated otherwise in a credit line to the material. If material is not included in the article's
Creative Commons licence and your intended use is not permitted by statutory regulation or exceeds the permitted use, you will need to obtain permission directly from the copyright holder.
To view a copy of this licence, visit http://creativecommons.org/licenses/by/4.0/. The Creative Commons Public Domain Dedication waiver (http://creativecommons.org/publicdomain/zero/1.0/)
applies to the data made available in this article, unless otherwise stated in a credit line to the data. Reprints and permissions ABOUT THIS ARTICLE CITE THIS ARTICLE Liao, S., Koehl, P.,
Schultens, J. _et al._ The geometry of colors in van Gogh’s Sunflowers. _Herit Sci_ 9, 136 (2021). https://doi.org/10.1186/s40494-021-00608-y Download citation * Received: 30 June 2021 *
Accepted: 01 September 2021 * Published: 25 October 2021 * DOI: https://doi.org/10.1186/s40494-021-00608-y SHARE THIS ARTICLE Anyone you share the following link with will be able to read
this content: Get shareable link Sorry, a shareable link is not currently available for this article. Copy to clipboard Provided by the Springer Nature SharedIt content-sharing initiative
KEYWORDS * Van Gogh * Sunflowers * Color geometry * Color transfer