Play all audios:
ABSTRACT BACKGROUND Diabetic kidney disease (DKD) is the major complication of diabetes concomitant with gut dysbiosis and glycometabolic disorder, which are strongly associated with bile
acid (BA) metabolism. Yet studies investigating the BA metabolism involving in DKD pathogenesis are limited. This study aimed to explore the metabolomic profiling of BAs in DKD and analyze
its association with DKD progression. METHODS An ultra-performance liquid chromatography tandem mass spectrometry (UPLC-MS/MS) method was established to quantify BAs in the plasma, fecal and
urine samples of patients with DKD or T2DM and healthy individuals (_n_ = 30 for each group). The key BAs associated with DKD were identified by orthogonal partial least-squares
discriminant analysis (OPLS-DA) and receiver-operating characteristic (ROC) curve. Polynomial regression and Pearson’s correlation analyses were performed to assess the correlation between
the key BAs and the clinical indicators reflecting DKD progression. RESULTS Metabolomic profiling of 50 kinds of BAs presented the markedly step-wise alterations of BAs in plasma and feces
as well as the little in urine of patients with DKD. Eight kinds of BAs in the plasma, eight kinds in the feces and three kinds in the urine were abnormally expressed, accompanying with the
increased conjugated/unconjugated ratios of cholic acid, deoxycholic acid, chenodeoxycholic acid, ursodeoxycholic acid and hyocholic acid in the plasma, and of cholic acid, chenodeoxycholic
acid and lithocholic acid in the feces. Moreover, the increased plasma level of glycochenodeoxycholic acid, and the increased fecal levels of glycolithocholic acid, 7-ketodeoxycholic acid
and chenodeoxycholic acid-3-β-D-glucuronide are strongly correlated with the clinical indicators reflecting DKD progression, including eGFR, 24 h urinary protein and 24 h urinary
microalbumin. CONCLUSIONS Our study for the first time disclosed the specific alterations of BA metabolism reflecting the step-wise progression of DKD, providing the basis for early
identification and therapeutical strategies for DKD. SIMILAR CONTENT BEING VIEWED BY OTHERS PREDICTING DIABETIC KIDNEY DISEASE WITH SERUM METABOLOMICS AND GUT MICROBIOTA Article Open access
09 April 2025 METABOLOMICS PROFILING DISTINCTIVELY IDENTIFIED END-STAGE RENAL DISEASE PATIENTS FROM CHRONIC KIDNEY DISEASE PATIENTS Article Open access 15 April 2023 REVEALING NOVEL
BIOMARKERS FOR DIAGNOSING CHRONIC KIDNEY DISEASE IN PEDIATRIC PATIENTS Article Open access 21 May 2024 INTRODUCTION Of the long-term complications of diabetes, diabetic kidney disease (DKD)
imposes the highest burden, both in terms of financial cost and the effects on daily life [1]. The presence of DKD leads to an increased risk for adverse health outcomes, including frailty,
reduced quality of life, end-stage renal disease (ESRD), and premature mortality. Previous studies reported the importance of early intensive glycemic control to reduce risk factor of DKD.
However, even after hyperglycemia has been brought under control, the “metabolic memory”, a cluster of irreversible metabolic changes, that allow the occurrence of DKD [2]. Therefore, a
comprehensive understanding of metabolic control, in particular glucose and lipid metabolism, is essential to intervene aggressively, by means other than insulin administration or
proteinuria reduction, to slow the progression of established DKD. Bile acids (BAs) are cholesterol-derived metabolites that facilitate the intestinal nutrient absorption and biliary
secretion of lipids, toxic metabolites, and xenobiotics. They also emerged as pivotal signaling molecules and metabolic regulators leading to regulation of intestinal incretin, hepatic
gluconeogenesis, glycogen synthesis, energy expenditure, inflammation, and gut microbiome configuration [3]. Disorders of BA metabolism are associated with obesity and T2DM, whereas treating
of patients with T2DM using BA sequestrants results in a significant improvement in glycemic response [4]. Moreover, BA accumulation in the plasma and its accompanying oxidative stress have
been proposed as pathogenic factors of kidney injury [5]. However, studies exploring the step-wise changes of BA metabolism from healthy status to T2DM and then to DKD are limited. Here, an
ultra-performance liquid chromatography-tandem mass spectrometry (UPLC-MS/MS) was performed to simultaneously quantify representative BAs in the plasma, fecal and urine samples of patients
with T2DM or DKD and healthy individuals, and to investigate the alterations of BA metabolism among them. Our results provide a basis for the full understanding of the pathogenic mechanisms
of DKD and for prophylactic and therapeutic approaches based on the changes in BA metabolism. METHODS STUDY DESIGN AND PARTICIPANTS This study was approved by the Ethics Committee of the
First Affiliated Hospital of Zhengzhou University (2020-KY-363) and complied with the Declaration of Helsinki regarding the ethical conduct of research involving human subjects. Written and
informed consents to approve the use of blood, fecal and urine samples were obtained from all participants. Patients with DKD (DKD group) and patients with T2DM (T2DM group) were recruited
from the Department of Nephrology and Department of Endocrinology respectively, while healthy individuals (CON group) were recruited from the Department of Physical Examination, of the First
Affiliated Hospital of Zhengzhou University from January. The healthy individuals were sex- and age-matched to the patients with DKD and with T2DM at a statistical significance level
>0.05. The inclusion and exclusion criteria for patients with DKD, patients with T2DM, and healthy individuals were as described previously [6]. Estimated glomerular filtration rate
(eGFR) was calculated using MDRD equation [7]. Plasma, urine and fecal samples from CON, T2DM, and DKD groups (30 patients in each group) were collected from January 2022 to December 2022.
SAMPLE COLLECTION AND PREPARATION Blood samples were collected from the participants in the morning after overnight fasting with an ethylene diamine tetraacetic acid (EDTA) anti-coagulant
tube. The plasma samples were then separated with centrifugation at 1500 × g for 10 min at 4 °C within 1 h after collection. Fecal samples were freshly collected in the morning after
overnight fasting. Midstream urine samples were collected from the participants in the morning after overnight fasting and centrifuged at 12,000 × g for 10 min at 4 °C within 1 h after
collection. All plasma, fecal and urine samples were then immediately frozen at −80 °C until further analysis. Stock solutions of the 50 kinds of BAs were prepared by dissolving standard
compounds (MedChem Express, Monmouth Junction, NJ, United States) in water at concentrations and stored in brown volumetric flasks at −80 °C until use (Supplementary Table 1).
Isotope-labeled mix of 9 kinds of BAs was diluted with methanol at a concentration of 100 ng/mL to act as internal standard (IS). Working solutions of BAs were prepared by diluting stock
solutions into twelve different batches (0.1–1000 ng/mL) with methanol. Plasma, fecal and urine samples were prepared using a protein precipitation extraction method. Briefly, 50 μL of
thawed plasma or urine, 50 μL IS and 200 μL methanol were transferred into a 1.5 mL tube. As regard to feces, 20 mg fecal samples were mixed with 50 μL IS and 200 μL methanol and then
homogenated at 4 °C for 10 min. Afterwards the above plasma, fecal and urine mixes were vortexed at 2500 rpm for 10 min and put at −20 °C for 10 min. After centrifugation at 12,000 rpm for
10 min at 4 °C, the supernatant was evaporated completely at 30 °C using a centrifugal vacuum evaporator and then redissolved in 100 μL 50% methanol/water (V/V) for further UPLC-MS/MS
analysis. UPLC-MS/MS-BASED BAS DETECTION The reconstituted samples were loaded onto a Waters ACQUITY UPLC HSS T3 C18 column (100 mm × 2.1 mm, 1.8 μm particle size; Waters, Milford, MA, USA)
for chromatographic separation. The isocratic gradient elution program was run with mobile phase A (water with 0.01% acetic acid and 5 mM ammonium acetate) and mobile phase B (acetonitrile
with 0.01% acetic acid, Supplementary Table 2). The BAs were then detected by AB 6500 + QTRAP LC-MS/MS System (Applied Biosystems Sciex, Toronto, Canada), equipped with an ESI Turbo
Ion-Spray Interface, operating in negative ion modes and controlled by Analyst 1.6.3 software. The optimized MS conditions for BA detection are presented in Supplementary Table 3, while the
detailed declustering potential, collision energy, precursor and dominant daughter ions of the BAs and ISs, are listed in Supplementary Table 4 and Supplementary Table 5. The chromatograms
of BAs and IS were conducted by OriginLab (OriginLab, Northampton, MA, United States). The concentrations of the BAs in plasma, fecal and urine samples were calculated against the
corresponding calibration curves with standards. The fecal BAs were then normalized by the sample weights. METABOLOMIC PROFILING OF BAS The BA levels in plasma, fecal and urine samples were
imported into SIMCA-P v16.0.2 (Umetrics Suite; Sartorius, Umeå, Sweden). Orthogonal projections to latent structures discriminant analysis (OPLS-DA) was established to explore the
discrimination between the DKD group, T2DM group and CON group. The quality of all OPLS-DA models was evaluated by the goodness-of-fit parameter (R2) and the predictive ability parameter
(Q2). The score plot was performed to visualize the discrimination ability of the OPLS-DA model. OPLS-DA1 represents the predictive component, which indicates the difference between groups,
while OPLS-DA2 represents the orthogonal components, which indicates the difference within groups. The accompanying shared and unique structures (SUS) plot and variable importance in
projection (VIP) analyses were generated to determine the major latent BAs in the data matrix and contributions of each BA to the group discrimination. VIP value > 1.2 was defined as
statistical significance in terms of discriminating between groups. STATISTICAL ANALYSIS Continuous data in normal distribution were expressed as mean ± standard deviation, while the data in
non-normal distribution were presented as median (quartile). Two-tailed _t_-test, Kruskal-Wallis test followed by Bonferroni post hoc comparison test (abnormal distributed data), and
one-way ANOVA followed by Tukey’s (normal distributed data with equal variances), or Games-Howell (abnormal distributed data with unequal variances) using Prism v8.0.2 software (GraphPad,
San Diego, CA, USA) with _P_ < 0.05 as the level of significance. Polynomial regression analyses and Pearson’s correlation coefficients were performed to assess the correlation between
the significantly-altered BAs in the plasma, fecal and urine samples and with the clinical indicators, respectively. R2 > 0.7 was considered as of noticeable correlativity.
Receiver-operating characteristic (ROC) curves were performed with SPSS v21.0 (Armonk, NY, United States). The corresponding area under the ROC curve (AUC) was conducted to evaluate the
predictive performances of the key BAs for DKD with AUC > 0.7 as of the significance. RESULTS METABOLOMIC PROFILING OF BAS IN PLASMA, URINE AND FECAL SAMPLES The demographic
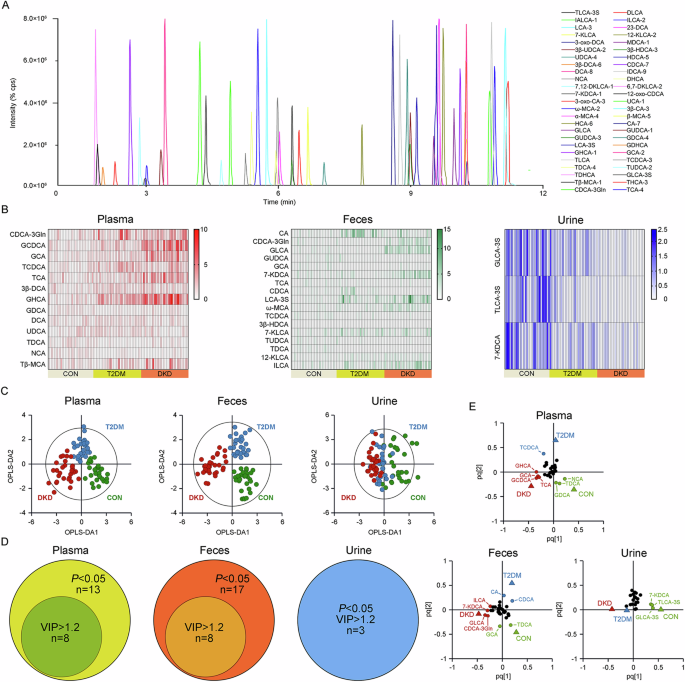
characteristics of the study population were extracted from the medical record system of hospital and are presented in Supplementary Table 6. Of 50 kinds of BAs in the established UPLC-MS/MS
method (Fig. 1A), twenty-three kinds in the plasma, twenty kinds in the feces, and twenty-nine kinds in the urine, with >30% of the measurements below the lower limit of quantitation
(LOQ), were excluded. Within the detected BAs, thirteen kinds in the plasma, seventeen kinds in the feces, and three kinds in the urine were significantly altered in DKD group than in T2DM
group or CON group (Fig. 1B). The OPLS-DA analysis was then performed, highlighting the optimal discriminations among the three groups in the plasma (Fig. 1C; R2X = 0.366, R2Y = 0.724, Q2 =
0.607) and feces (R2X = 0.392, R2Y = 0.787, Q2 = 0.675), yet non-optimal discrimination in the urine (R2X = 0.239, R2Y = 0.356, Q2 = 0.285), with optimal binary classifier, validity and
degree of overfitting (Supplementary Fig. 1). According to the significance of _P_ < 0.05 in the Student’s t-test and VIP > 1.2 in the OPLS-DA model, eight kinds of BAs, including
Glycochenodeoxycholic acid (GCDCA), Glycohyocholic acid (GHCA), Glycocholic acid (GCA), Taurocholic acid (TCA), Taurochenodeoxycholic acid (TCDCA), Glycodeoxycholic acid (GDCA),
Taurodeoxycholic acid (TDCA), and Norcholic acid (NCA), were the key BAs in the plasma contributing to the group difference among three groups (Fig. 1D, E). Eight kinds of BAs in the feces,
including TDCA, Glycolithocholic acid (GLCA), GCA, Cholic acid (CA), Chenodeoxycholic acid-3-β-D-glucuronide (CDCA-3Gln), 7-Ketodeoxycholic acid (7-KDCA), Chenodeoxycholic acid (CDCA) and
Isolithocholic acid (ILCA), as well as Taurolithocholic acid-3-sulfate (TLCA-3S), Glycolithocholic acid-3-sulfate (GLCA-3S) and 7-KDCA in the urine, were the major BAs contributing to the
group differences. THE SEPARATED METABOLOMIC PROFILING OF PLASMA BAS For the BA profiling in plasma, six kinds of the primary conjugated BAs, including CDCA-3Gln, GCDCA, GCA, TCDCA, TCA and
NCA, and four kinds of the secondary conjugated BAs, including GHCA, GDCA, ursodeoxycholic acid (UDCA) and TDCA, as well as two kinds of the secondary unconjugated BAs, namely deoxycholic
acid (DCA) and 3β-deoxycholic acid (3β-DCA), were significantly altered in the patients with DKD (Supplementary Table 7). When exploring the detailed BA metabolism in the patients with T2DM
or DKD, or patients in the diabetic condition (either T2DM or DKD), or patients in Non-DKD condition (either CON or T2DM), the OPLS-DA model was employed, visualizing the optimal separation
between the DKD group and CON group (R2X = 0.365, R2Y = 0.866, Q2 = 0.761, Fig. 2A). The SUS-plots and ROC analyses identified GCDCA, GHCA, GCA, TCA, CDCA-3Gln, NCA and TCDCA as key BAs
discriminating the DKD group from CON group (Fig. 2B, C). The OPLS-DA analysis also visualized the separation between the DKD group and T2DM group (R2X = 0.339, R2Y = 0.771, Q2 = 0.589, Fig.
2D). The SUS-plots and ROC analysis identifying GCDCA, GCA, TCA, GHCA and UDCA as key BAs discriminating the DKD group from T2DM group (Fig. 2E, F). In addition, it also indicated that
GCDCA, GHCA, GCA and TCA were the key BAs discriminating the DKD group from the Non-DKD group (R2X = 0.315, R2Y = 0.784, Q2 = 0.675, Fig. 2G–I), while the GHCA, TCDCA, TDCA, NCA, GCDCA,
GDCA, and GCA were the key BAs identifying the patients in diabetic condition from the CON group (R2X = 0.231, R2Y = 0.771, Q2 = 0.677, Fig. 2J−L). Accompanied with the significant
alteration of these six kinds of BAs in plasma (Fig. 2M–R), the combined results indicated that GCDCA, GCA, TCA and GHCA were significantly increased in the DKD group and strongly correlated
with the progression of DKD from either T2DM or healthy status. THE SEPARATED METABOLOMIC PROFILING OF FECAL BAS For the BA profiling in feces, the significant alterations of seventeen
kinds of BAs presented in the DKD group, including (1) two kinds of primary unconjugated BAs, namely CA and CDCA, (2) five kinds of primary conjugated BAs, including TCA, TCDCA, CDCA-3Gln,
GCDCA and ω-Muricholic acid (ω-MCA), (3) four kinds of secondary unconjugated BAs, namely 7-Ketolithocholic acid (7-KLCA), 12-KLCA, ILCA and 7-KDCA, and (4) six kinds of secondary conjugated
BAs, including 3β-Hyodeoxycholic acid (3β-HDCA), LCA-3S, Tauroursodeoxycholic acid (TUDCA), TDCA, GLCA and Glycoursodeoxycholic acid (GUDCA) (Supplementary Table 8). The separated OPLS-DA
analysis showed the optimal separation between the DKD group and the CON group (R2X = 0.291, R2Y = 0.915, Q2 = 0.868, Fig. 3A), with GLCA, CDCA, LCA-3S, 7-KDCA, ILCA, ω-MCA, TDCA and
CDCA-3Gln as the key BAs to group difference (Fig. 3B, C). The OPLS-DA analysis between the DKD group and the T2DM group (R2X = 0.274, R2Y = 0.827, Q2 = 0.723, Fig. 3D) also showed the ideal
modeling with GLCA, CDCA, 7-KDCA, CDCA-3Gln, GCA, ω-MCA and CA as the key BAs contributing to the group difference (Fig. 3E, F). In addition, it also indicated that GLCA, CDCA, 7-KDCA,
ILCA, ω-MCA and CDCA-3Gln as the key BAs discriminating the DKD group from the Non-DKD group (R2X = 0.251, R2Y = 0.833, Q2 = 0.759, Fig. 3G–I), while GCA, TDCA, CA, 7-KLCA, TCDCA, TUDCA,
ILCA and 7-KDCA were the key BAs identifying the patients in diabetic condition from the CON group (R2X = 0.246, R2Y = 0.779, Q2 = 0.705, Fig. 3J–L). Combing the significant increase of
their fecal levels, GLCA, 7-KDCA, ILCA, ω-MCA and CDCA-3Gln were positively correlated with the progression of DKD from either T2DM or healthy status (Fig. 3M–Q). THE SEPARATED METABOLOMIC
PROFILING OF URINARY BAS When analyzing the BA levels in the urine, it presented the decrease of GLCA-3S, TLCA-3S and 7-KDCA in the DKD group (Supplementary Table 9). The OPLS-DA models
showed the poor performance between the DKD group and CON group (R2X = 0.248, R2Y = 0.754, Q2 = 0.591), the DKD group and T2DM group (R2X = 0.179, R2Y = 0.593, Q2 = 0.326), the DKD group and
Non-DKD group (R2X = 0.234, R2Y = 0.451, Q2 = 0.271), and the patients in diabetic condition from the CON group (R2X = 0.237, R2Y = 0.672, Q2 = 0.529), with the validation of the
significance of TLCA-3S, GLCA-3S, and 7-KDCA in urine that contribute to the DKD identification by the SUS-plots and ROC analyses (Fig. 4A–L). It also showed step-wise decrease of these
three BAs in the progression of DKD from T2DM and CON. These results indicated that the urine GLCA-3S, TLCA-3S and 7-KDCA may significantly involve in the progression of DKD (Fig. 4M–O). THE
RATIOS BETWEEN CONJUGATED- AND UNCONJUGATED- BAS The ratios between conjugated BAs and unconjugated BAs detected in the plasma, feces and urine of patients with T2DM, patients with DKD and
healthy individuals, were calculated, showing the increased conjugated/unconjugated ratios of CA, DCA, CDCA, UDCA, and HCA in the plasma, and of CA, CDCA and LCA in the feces (Table 1).
These findings suggested that the patients with DKD have increased transition from unconjugated- to conjugated- BAs. THE CORRELATION MATRIX OF BAS The correlation matrix for BAs in study
participants were performed, showing the positive correlation of the key BAs in the feces and the negative correlation of the key BAs in the urine with the key BAs in the plasma. Moreover,
it also presented the strong correlation of plasma GCDCA, GHCA and GCA between each other (R2 > 0.7, Fig. 5A). When analyzing their correlation with the clinical indicators reflecting DKD
progression, including hemoglobin, serum albumin, serum creatinine, blood glucose, serum triglyceride, total cholesterol, low-density lipoprotein, high-density lipoprotein, parathyroid
hormone, glycated hemoglobin, eGFR and urinary protein and urinary microalbumin in 24 h, it presented the strong correlation of GCDCA with eGFR (R2 = 0.825, Fig. 5B), 24 h urinary protein
(R2 = 0.863, Fig. 5C) and 24 h urinary microalbumin (R2 = 0.852, Fig. 5D). In addition, the fecal levels of GLCA, 7-KDCA and CDCA-3Gln also had the strong correlations with eGFR (R2 >
0.7, Fig. 5E–G). These results indicated the optimal correlation of BAs within the plasma, feces and urine, and the levels of GCDCA in plasma, and the levels of GLCA, 7-KDCA and CDCA-3Gln in
the feces were the key BAs reflecting the impairment of renal function in patients with DKD. DISCUSSION Diabetes remains a key reason for developing ESRD and cause about one third of
patients requiring renal replacement therapy [8]. BAs are considered to be important enteroendocrine hormone-like signaling molecules that regulate glucose, lipid, and energy metabolism.
More importantly, timely identification of the altered BA metabolism associated with the impaired renal function should allow us not only to pinpoint individuals at the highest risk of
developing ESRD, but to improve our mechanistic and clinical knowledge of DKD. To date, whilst the convincing evidence presented the increased BA pool size in the diabetic mice, it is still
uncertain whether the alterations of BA metabolism in patients with T2DM, and much less concern for patients with DKD. Interestingly, conflicting results existed against the experimental
evidence in the current available human studies [9]. A small cross-sectional study reported that the fasting taurine-conjugated BA concentrations were higher in patients with T2DM [10].
Another observational study involving 1707 patients with T2DM in Chinese population indicated the higher plasma levels of conjugated primary BAs and a secondary BA, were associated with an
increased risk of T2DM [11]. Our study confirmed and expanded the previous observations by showing that the plasma levels of three primary conjugated BAs (GCDCA, GCA and TCA), and one
secondary conjugated BA (namely GHCA), were significantly higher in patients with T2DM, and were much higher in patients with DKD. Together with the increased ratios between certain
conjugated- and unconjugated- BAs in the plasma and feces of T2DM and DKD, our findings support the hypothesis that patients with T2DM and DKD have increased transition from unconjugated- to
conjugated- BAs. Notably, we presented the strong correlation of plasma GCDCA with eGFR, 24 h urinary protein and 24 h urinary microalbumin. GCDCA is one of the most toxic BAs which is
originally synthesized in the liver by CDCA conjugated to glycine. The relatively high concentration of GCDCA in bile exerts hepatotoxic effect, which displays as the apoptosis of
hepatocytes, the fibrotic disorder of hepatobiliary system, and the chemoresistance in hepatocellular carcinoma [12,13,14]. Thus, our study for the first time proposed the possible toxicity
of GCDCA to DKD progression and indicated the clinical potential of GCDCA plasma concentration as the biomarker reflecting DKD progression, which also provide a new potential therapeutic
target for DKD. In addition to the plasma, the significant alterations of seventeen kinds of BAs in the feces of patients with DKD were also identified, most of which were increased. Under
physiologic condition, only 5% of the total BAs is excreted into the feces owing to the enterohepatic circulation of BAs [15]. The diabetic intestinal dysfunction results in the decrease of
intestinal BA reabsorption and thus excessive BA excretion in the feces [16]. Similarly, the unconjugated BAs were significantly increased in the feces of diabetic mice, while no conjugated
BA was readily detected [17]. Treating with metformin could increase the BA resorption in the ileum by upregulating the expression of Cystic fibrosis transmembrane conductance regulator
(CFTR) and Glucagon-like peptide-1 (GLP-1) [18]. Another study also proofed that the sleeve gastrectomy has the anti-diabetic benefits, partly due to the post-surgery overexpression of the
BA transporter in the ileum [19]. In consistent with these evidence, our study showed the significant increase of ten kinds of BAs in the plasma, five of which were strongly correlated with
the progression of DKD. The difference is that four kinds of conjugated BAs (GUDCA, TCA, TCDCA and TUDCA) were decreased in the fecal samples while increased in the plasma samples, of
patients with either T2DM or DKD. Since most conjugated BAs are actively absorbed in the terminal ileum by the apical sodium-dependent bile acid transporter (ASBT), enhanced reabsorption of
these conjugated BAs in our results may mainly attribute to the augmented activation of ASBT [20]. This hypothesis is also supported by the evidence that high levels of glucose contribute to
the increased ASBT function in diabetes, while inhibiting ASBT could increase fecal excretion and improve glucose hemostasis [21]. Thus, the evidence above implicated that the BA excretion
in the feces and reabsorption were both increased in patients with DKD, possibly due to the impaired ileum function and enhanced activation of renal BA transporter, respectively. Finally,
our study also presented the rare change of BA profiling in the urine of patients with T2DM and DKD. Although kidney is reported to play a minor role in BA excretion, there is evidence
suggested that impairment in kidney function may profoundly affect BA homeostasis. Jimenez F et al. found that the BA excretion in the urine decreased significantly in patients with chronic
renal failure (CRF), and also indicated that it could be enough to increase serum BA concentrations if the kidney function declined for a long enough period, despite of the small BA
elimination rate by the kidney [22]. This alteration is probably due to not only the impaired renal BA excretion, but also the silent hepatobiliary alterations or an impaired BA
enterohepatic circulation. However, at present there is a lack of evidence illustrating this issue in patients with CRF as well as DKD. It is still unclear whether the altered BA
concentrations in plasma and feces of patients with DKD are primarily due to the fact that the role of the kidney in BA excretion is more important than previously thought. Further
investigations are required to improve our current knowledge on the association between impaired kidney function and urinary BA excretion in patients with DKD. Our study for the first time
presenting the decreased urinary excretion of GLCA-3S, TLCA-3S and 7-KDCA in patients with T2DM or DKD.LCA is the only natural monohydroxy BA that formed in the large intestine by bacterial
dehydroxylation of CDCA. Controversy exists regarding the pros or cons of LCA on living organisms, which mainly depends on the sulfation capacity in the different tissues [23]. Sulfation is
an important detoxification pathway of LCA to enhance its fecal and urinary excretion [24]. Sulfated LCA are more rapidly excreted in the urine and is less efficiently reabsorbed in the
intestine than non-sulfated lithocholate. Moreover, taurine and glycine conjugation increase the hydrophilicity to the LCA, enhancing its degree of detoxification [25]. Thus, the decreased
urinary levels of GLCA-3S and TLCA-3S may reflect the enhanced detoxification and excretion of LCA in the step-wise progression from healthy individuals to T2DM and then to DKD. Some
limitations exist regarding to our study, First, since this is a cross-sectional study, there is insufficient evidence explicating the causality between BAs and DKD progression. Second, the
sample size of our study was relatively small; the BA profiles at different stages of DKD were not sufficiently determined. Third, our study is a targeted BA metabolomic profiling including
a total of 50 kinds of BAs, a combination of untargeted and targeted metabolomic research may possess a higher opportunity to clarify the alteration of BA profiles along with the DKD
progression. Therefore, further investigations, including the prospective longitudinal study, in-vivo, or in-vitro intervention studies, are needed to explore the association between BA
metabolism and DKD progression. CONCLUSIONS Our study preliminarily presented the markedly step-wise alterations of BAs in plasma and feces as well as the little in urine in patients with
DKD, and highlighted the increased transition from unconjugated- to conjugated- BAs. Moreover, we found that the correlation of increased plasma level of GCDCA, and the increased fecal
levels of GLCA, 7-KDCA with the renal function in diabetes. However, the evidence is limited due to it being a single-center study with limited sample size. The association between BA
metabolism, especially the plasma BA profiling, and the severity of kidney injury in the diabetic condition are not investigated. Expanded sample size is necessary in any further study.
Moreover, the explicit mechanism regarding the increased BA transition from unconjugated- to conjugated- BAs, involves in the progression of DKD and whether therapeutic manipulation of these
alterations can be kidney-beneficial remains to be explored. In summary, our study for the first time disclosed the specific alterations of BA metabolism reflecting the step-wise
progression of DKD, which may provide the basis not only for the early identification but also the therapeutic strategies for DKD. DATA AVAILABILITY The raw data generated or analyzed during
this study are available from the corresponding author on reasonable request. REFERENCES * Doshi SM, Friedman AN. Diagnosis and Management of Type 2 Diabetic Kidney Disease. Clin J Am Soc
Nephrol. 2017;12:1366–73. Article CAS PubMed PubMed Central Google Scholar * Rajani C, Jia W. Bile acids and their effects on diabetes. Front Med. 2018;12:608–23. Article PubMed
Google Scholar * Chiang JY. Bile acid metabolism and signaling. Compr Physiol. 2013;3:1191–212. Article PubMed PubMed Central Google Scholar * Shapiro H, Kolodziejczyk AA, Halstuch D,
Elinav E. Bile acids in glucose metabolism in health and disease. J Exp Med. 2018;215:383–96. Article CAS PubMed PubMed Central Google Scholar * Li S, Li C, Wang W. Bile acid signaling
in renal water regulation. Am J Physiol Ren Physiol. 2019;317:F73–6. Article CAS Google Scholar * Zhou C, Zhang Q, Lu L, Wang J, Liu D, Liu Z. Metabolomic Profiling of Amino Acids in
Human Plasma Distinguishes Diabetic Kidney Disease From Type 2 Diabetes Mellitus. Front Med. (Lausanne). 2021;8:765873. Article PubMed Google Scholar * Levey AS, Bosch JP, Lewis JB,
Greene T, Rogers N, Roth D. A more accurate method to estimate glomerular filtration rate from serum creatinine: a new prediction equation. Modification of Diet in Renal Disease Study Group.
Ann Intern Med. 1999;130:461–70. Article CAS PubMed Google Scholar * Beckman JA, Creager MA. Vascular Complications of Diabetes. Circ Res. 2016;118:1771–85. Article CAS PubMed Google
Scholar * Mantovani A, Dalbeni A, Peserico D, Cattazzo F, Bevilacqua M, Salvagno GL, et al. Plasma Bile Acid Profile in Patients with and without Type 2 Diabetes. Metabolites. 2021;11:453.
Article CAS PubMed PubMed Central Google Scholar * Wewalka M, Patti ME, Barbato C, Houten SM, Goldfine AB. Fasting serum taurine-conjugated bile acids are elevated in type 2 diabetes
and do not change with intensification of insulin. J Clin Endocrinol Metab. 2014;99:1442–51. Article CAS PubMed PubMed Central Google Scholar * Lu J, Wang S, Li M, Gao Z, Xu Y, Zhao X,
et al. Association of Serum Bile Acids Profile and Pathway Dysregulation With the Risk of Developing Diabetes Among Normoglycemic Chinese Adults: Findings From the 4C Study. Diabetes Care.
2021;44:499–510. Article CAS PubMed Google Scholar * González-Rubio S, López-Sánchez L, Muñoz-Castañeda J, Linares CI, Aguilar-Melero P, Rodríguez-Perálvarez M, et al. GCDCA
down-regulates gene expression by increasing Sp1 binding to the NOS-3 promoter in an oxidative stress dependent manner. Biochem Pharm. 2015;96:39–51. Article PubMed Google Scholar * Shi
C, Yang J, Hu L, Liao B, Qiao L, Shen W, et al. Glycochenodeoxycholic acid induces stemness and chemoresistance via the STAT3 signaling pathway in hepatocellular carcinoma cells. Aging
(Albany NY). 2020;12:15546–55. Article CAS PubMed Google Scholar * Wang A, Yu D, Gong Y, Garber J, Minuk GY. Glycochenodeoxycholic Acid Does Not Increase Transforming Growth Factor-Beta
Expression in Bile Duct Epithelial Cells or Collagen Synthesis in Myofibroblasts. J Clin Exp Hepatol. 2017;7:316–20. Article PubMed PubMed Central Google Scholar * Li T, Chiang JY. Bile
acid signaling in metabolic disease and drug therapy. Pharm Rev. 2014;66:948–83. Article CAS PubMed PubMed Central Google Scholar * Esteves-Monteiro M, Menezes-Pinto D, Ferreira-Duarte
M, Dias-Pereira P, Morato M, Duarte-Araújo M. Histomorphometry Changes and Decreased Reactivity to Angiotensin II in the Ileum and Colon of Streptozotocin-Induced Diabetic Rats. Int J Mol
Sci. 2022;23:13233. Article CAS PubMed PubMed Central Google Scholar * Chen C, Hu B, Wu T, Zhang Y, Xu Y, Feng Y, et al. Bile acid profiles in diabetic (db/db) mice and their wild type
littermates. J Pharm Biomed Anal. 2016;131:473–81. Article CAS PubMed Google Scholar * Mizoguchi M, Takemori H, Furukawa S, Ito M, Asai M, Morino H, et al. Increased expression of
glucagon-like peptide-1 and cystic fibrosis transmembrane conductance regulator in the ileum and colon in mouse treated with metformin. Endocr J. 2023;70:149–59. Article CAS PubMed Google
Scholar * Chaudhari SN, Luo JN, Harris DA, Aliakbarian H, Yao L, Paik D, et al. A microbial metabolite remodels the gut-liver axis following bariatric surgery. Cell Host Microbe.
2021;29:408–424.e7. Article CAS PubMed PubMed Central Google Scholar * Li N, Zhan S, Tian Z, Liu C, Xie Z, Zhang S, et al. Alterations in Bile Acid Metabolism Associated With
Inflammatory Bowel Disease. Inflamm Bowel Dis. 2021;27:1525–40. Article PubMed Google Scholar * Li M, Wang Q, Li Y, Cao S, Zhang Y, Wang Z, et al. Apical sodium-dependent bile acid
transporter, drug target for bile acid related diseases and delivery target for prodrugs: Current and future challenges. Pharm Ther. 2020;212:107539. Article CAS Google Scholar * Jimenez
F, Monte MJ, El-Mir MY, Pascual MJ, Marin JJ. Chronic renal failure-induced changes in serum and urine bile acid profiles. Dig Dis Sci. 2002;47:2398–406. Article CAS PubMed Google Scholar
* Halvorsen B, Staff AC, Ligaarden S, Prydz K, Kolset SO. Lithocholic acid and sulphated lithocholic acid differ in the ability to promote matrix metalloproteinase secretion in the human
colon cancer cell line CaCo-2. Biochem J. 2000;349:189–93. Article CAS PubMed PubMed Central Google Scholar * Hofmann AF. Detoxification of lithocholic acid, a toxic bile acid:
relevance to drug hepatotoxicity. Drug Metab Rev. 2004;36:703–22. Article CAS PubMed Google Scholar * Alnouti Y. Bile Acid sulfation: a pathway of bile acid elimination and
detoxification. Toxicol Sci. 2009;108:225–46. Article CAS PubMed Google Scholar Download references ACKNOWLEDGEMENTS The authors thank the staff and participants for their contributions.
The authors thank Translational Medical Center, the First Affiliated Hospital of Zhengzhou University, for technical support. FUNDING This study was supported by grants from the Natural
Science Foundation of Henan Province (222300420343, 222300420345), Henan Medical Science and Technology Research Program Joint Construction Project (LHGJ20200290, LHGJ20200328), Henan
Medical Science and Technique Foundation (SBGJ202103080). AUTHOR INFORMATION AUTHORS AND AFFILIATIONS * Department of Integrated Traditional and Western Nephrology, The First Affiliated
Hospital of Zhengzhou University, Zhengzhou, 450052, China Qing Zhang, Liqian Lu, Manman Lu, Dongwei Liu & Zhangsuo Liu * Henan Province Research Center for Kidney Disease, Zhengzhou,
450052, China Qing Zhang, Liqian Lu, Jiao Wang, Manman Lu, Dongwei Liu, Chunyu Zhou & Zhangsuo Liu * Blood Purification Center, The First Affiliated Hospital of Zhengzhou University,
Zhengzhou, 450052, China Chunyu Zhou & Zhangsuo Liu Authors * Qing Zhang View author publications You can also search for this author inPubMed Google Scholar * Liqian Lu View author
publications You can also search for this author inPubMed Google Scholar * Jiao Wang View author publications You can also search for this author inPubMed Google Scholar * Manman Lu View
author publications You can also search for this author inPubMed Google Scholar * Dongwei Liu View author publications You can also search for this author inPubMed Google Scholar * Chunyu
Zhou View author publications You can also search for this author inPubMed Google Scholar * Zhangsuo Liu View author publications You can also search for this author inPubMed Google Scholar
CONTRIBUTIONS QZ was responsible for designing the study, analyzing the data, writing the original manuscript, carrying out the protocol, creating figures and funding the research. CZ was
responsible for designing the protocol, writing and reviewing the manuscript, conducting the research, interpreting results, creating figures and funding the research. LL, JW, and ML carried
out the experiments and acquired data. DL conceived the work and provided the research resources. ZL supervised the study and finalized the manuscript. All authors reviewed and approved the
final version of the manuscript. CORRESPONDING AUTHORS Correspondence to Chunyu Zhou or Zhangsuo Liu. ETHICS DECLARATIONS COMPETING INTERESTS The authors declare no competing interests.
ETHICS APPROVAL AND CONSENT TO PARTICIPATE This study was approved by the Ethics Committee of the First Affiliated Hospital of Zhengzhou University (2020-KY-363) and complied with the
Declaration of Helsinki regarding the ethical conduct of research involving human subjects. Written and informed consents to approve the use of blood, fecal and urine samples were obtained
from all participants. ADDITIONAL INFORMATION PUBLISHER’S NOTE Springer Nature remains neutral with regard to jurisdictional claims in published maps and institutional affiliations.
SUPPLEMENTARY INFORMATION SUPPLEMENTARY MATERIAL RIGHTS AND PERMISSIONS OPEN ACCESS This article is licensed under a Creative Commons Attribution 4.0 International License, which permits
use, sharing, adaptation, distribution and reproduction in any medium or format, as long as you give appropriate credit to the original author(s) and the source, provide a link to the
Creative Commons licence, and indicate if changes were made. The images or other third party material in this article are included in the article’s Creative Commons licence, unless indicated
otherwise in a credit line to the material. If material is not included in the article’s Creative Commons licence and your intended use is not permitted by statutory regulation or exceeds
the permitted use, you will need to obtain permission directly from the copyright holder. To view a copy of this licence, visit http://creativecommons.org/licenses/by/4.0/. Reprints and
permissions ABOUT THIS ARTICLE CITE THIS ARTICLE Zhang, Q., Lu, L., Wang, J. _et al._ Metabolomic profiling reveals the step-wise alteration of bile acid metabolism in patients with diabetic
kidney disease. _Nutr. Diabetes_ 14, 85 (2024). https://doi.org/10.1038/s41387-024-00315-0 Download citation * Received: 19 December 2023 * Revised: 08 July 2024 * Accepted: 15 July 2024 *
Published: 09 October 2024 * DOI: https://doi.org/10.1038/s41387-024-00315-0 SHARE THIS ARTICLE Anyone you share the following link with will be able to read this content: Get shareable link
Sorry, a shareable link is not currently available for this article. Copy to clipboard Provided by the Springer Nature SharedIt content-sharing initiative