Play all audios:
ABSTRACT Machine learning methods show promise to translate univariate biomarker findings into clinically useful multivariate decision support systems. At current, works in major depressive
disorder have predominantly focused on neuroimaging and clinical predictor modalities, with genetic, blood-biomarker, and cardiovascular modalities lacking. In addition, the prediction of
rehospitalization after an initial inpatient major depressive episode is yet to be explored, despite its clinical importance. To address this gap in the literature, we have used baseline
clinical, structural imaging, blood-biomarker, genetic (polygenic risk scores), bioelectrical impedance and electrocardiography predictors to predict rehospitalization within 2 years of an
initial inpatient episode of major depression. Three hundred and eighty patients from the ongoing 12-year Bidirect study were included in the analysis (rehospitalized: yes = 102, no = 278).
Inclusion criteria was age ≥35 and <66 years, a current or recent hospitalisation for a major depressive episode and complete structural imaging and genetic data. Optimal performance was
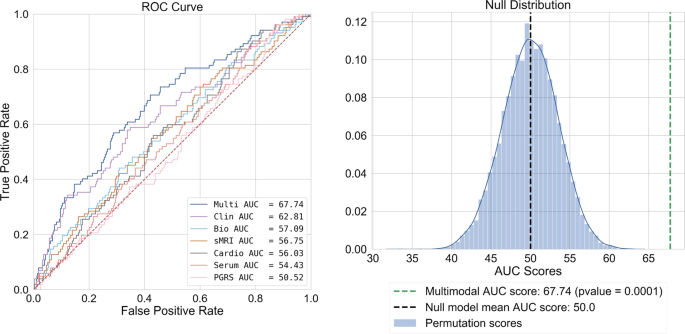
achieved with a multimodal panel containing structural imaging, blood-biomarker, clinical, medication type, and sleep quality predictors, attaining a test AUC of 67.74 (_p_ = 9.99−05). This
multimodal solution outperformed models based on clinical variables alone, combined biomarkers, and individual data modality prognostication for rehospitalization prediction. This finding
points to the potential of predictive models that combine multimodal clinical and biomarker data in the development of clinical decision support systems. SIMILAR CONTENT BEING VIEWED BY
OTHERS MAGNETIC RESONANCE IMAGING FOR INDIVIDUAL PREDICTION OF TREATMENT RESPONSE IN MAJOR DEPRESSIVE DISORDER: A SYSTEMATIC REVIEW AND META-ANALYSIS Article Open access 15 March 2021
INDIVIDUALIZED PREDICTION OF PSYCHIATRIC READMISSIONS FOR PATIENTS WITH MAJOR DEPRESSIVE DISORDER: A 10-YEAR RETROSPECTIVE COHORT STUDY Article Open access 23 April 2022 PROBING THE CLINICAL
AND BRAIN STRUCTURAL BOUNDARIES OF BIPOLAR AND MAJOR DEPRESSIVE DISORDER Article Open access 14 January 2021 INTRODUCTION Relapse rates in specialized mental healthcare settings are high in
patients with major depressive disorder (MDD) (60% after 5 years, 67% after 10, and 85% after 15)1. To better predict relapse, previous research has predominantly focused on the presence
and magnitude of clinical symptoms, including residual depressive symptoms2, illness severity3, number of prior episodes4, age of onset4, and comorbid personality disorders5. Other studies
have explored group level associations between biomarkers and relapse, observing smaller hippocampal volumes6, higher levels of post-treatment glucocorticoids7, high cortisol response on the
combined dexamethasone-CRH test8, as well as catecholamine and tryptophan depletion9. Such findings have been beneficial in constructing modality specific aetiological hypotheses as well as
sign posts for relapse in clinical practice. However, the elucidation of clinically meaningful predictors of relapse is contingent on the construct validity of the prediction outcome and
the size of the analysed sample. Some of these studies identifying biomarkers as predictors of relapse have used self-reported relapse into a new depressive episode and samples of less than
50 patients7,10. Whether patients have truly relapsed into a new depressive episode or merely have a treatment refractory illness is unknown. These observations may help to explain the lack
of empirically validated relapse prediction tools and subsequent intervention strategies for relapse prevention10. To overcome this blind spot in patient care, studies of increased size that
focus on a well-defined outcome such as rehospitalization are needed to identify clinically robust predictors of this illness trajectory. To facilitate this, a longitudinal, multimodal
sample of clinically diagnosed inpatients is required. The BiDirect depression cohort provides such a sample11. In addition, multimodal, multivariate modelling techniques that prognosticate
individually, rather than at the group level are needed given the heterogeneous nature of MDD and its illness trajectories12,13. Recent work has shown that machine learning (ML) models are
well suited to problems of this nature, demonstrating their efficacy in drug response and functional outcome prediction in MDD14,15, while other studies using neuroimaging modalities have
shown similar success for ML-based MDD diagnostics16. Interestingly, no studies have applied ML models to relapse prediction; thus, the utility of differing data modalities for relapse
prediction remains poorly understood. Regarding illness trajectory modelling, one previous work from Schmaal et al.17 combined neuroimaging and clinical data to predict MDD remission
trajectories with moderate success (accuracy = 69–73%). Further, Koutsouleris et al.15 used both neuroimaging and clinical data to predict functional outcomes in recent onset MDD (balanced
accuracy = 70.3%). However, studies employing a combination of neuroimaging markers with biomarkers from different modalities as well as clinical data are lacking up until now. Given the
apparent gap in multimodal studies of outcome prediction in MDD, we have combined a range of clinical and biomarker predictors that have shown significant associations to MDD in previous
works but are yet to be used for ML-based rehospitalization trajectory modelling. Modalities used included clinical18, blood biomarker19,20,21, structural imaging16, electrocardiography22,
genetic23, cognitive24, nutritional25, sleep26, and exercise27. Using these modalities, we predicted rehospitalization in a cohort of patients within 2 years of initial hospitalization for
an acute episode of MDD. MATERIALS AND METHODS DATASET DESCRIPTION The BiDirect study is an ongoing study of (a) patients, hospitalized for an acute episode of major depression at time of
recruitment, (b) population controls randomly drawn from the register of the city of Münster11, and (c) patients 3 months after an acute coronary event or myocardial infarction. Examination
of all participants included a computer-assisted face-to-face interview of socio-demographic characteristics and medical history as well as an extensive psychiatric assessment (Supplementary
Information 1.1). Only patients in the depression cohort were used in this analysis. At baseline, 999 MDD patients were recruited and 684 completed their 2-year follow-up and provided their
rehospitalization status. Specifically, patients were asked, have you had at least one or more re-admissions to hospital for an acute depressive episode since the initial examination?
Patient response was recorded by study assistants. As our aim was to assess both multi and unimodal prediction models of reported rehospitalization, a requirement for inclusion was complete
imaging and genetic data. Twenty-nine patients had incomplete genetic data while 294 had incomplete imaging data. In addition, 14 participants were excluded due to poor MRI quality, leaving
a final sample of 380 participants (rehospitalized: yes = 102, no = 278). See Table 1 for sociodemographic characteristics. In this final sample, 87.9% (334/380) of patients were taking some
form of antidepressant medication at their baseline assessment, 40.3% (153/380) were taking an antipsychotic, while 92.6% (352/380) were taking some form of psychotropic medication (see
Table 2). PREDICTOR MODALITIES CLINICAL Detailed information regarding socio-demographic and socio-economic status, lifetime medical diagnoses, current medication use, healthcare
utilization, insurance status, lifestyle and risk behaviour (e.g., diet, physical activity, alcohol consumption, smoking status), and perceived health state was collected via a
computer-assisted interview. A combination of individual items as well as total scores were included from the Hamilton Depression Rating Scale (HAM-D), the Hamilton Anxiety Rating Scale
(HAM-A), the Center for Epidemiologic Studies Depression Scale (CES-D), the Inventory of Depressive Symptomatology (IDS), the International Physical Activity questionnaire (IPAQ), and the
Food Frequency Questionnaire (FFQ) (Supplementary Information 1.1 and 1.2). In addition, we included measures from a cognitive functioning module and several self-report measures
(Supplementary Information 1.3). In total, 208 clinical and demographic predictors were included. STRUCTURAL IMAGING We included imaging data derived from structural magnetic imaging
sequences (3D-T1). To reduce the size of the predictor space, we a priori selected 15 regions that have been shown to be significantly associated with MDD in previous ENIGMA
meta-analyses6,28. Selected regions included right and left mean hippocampal volume, cortical thickness of the bilateral medial orbitofrontal cortex (OFC), fusiform gyrus, insula, rostral
anterior and posterior cingulate cortex and unilaterally in the left middle temporal gyrus, right inferior temporal gyrus and the right caudal anterior cingulate cortex (Supplementary
Information 1.4). SERUM AND GENETIC MARKERS Our serum biomarker panel consisted of 10 measures of high sensitive C-reactive protein19, free triiodothyronine, thyroxine, thyroid-stimulating
hormone29,30,31, 17 beta-estradiol32,33, sex hormone-binding globulin, testosterone, the free androgen index34,35,36, total cholesterol37, and high-density lipoprotein cholesterol38. Due to
the correlations between genetic variants shared across psychiatric traits and common comorbidities between psychiatric disorders39,40, we also included seven polygenic risk scores (PGRS)
with a _p_ value threshold of 0.5, for MDD, anxiety, Alzheimer’s, anorexia, autism spectrum disorder, bipolar, and schizophrenia (Supplementary Information 1.5–1.6 and Supplementary
Information 2.1–2.6). In addition, we also assessed PGRS with _p_ value thresholds of 0.05 and 0.01 (Supplementary Information 3.2). CARDIOVASCULAR We determined cardiovascular and general
health status through the assessment of different cardiovascular markers. First, we measured weight (without shoes and heavier clothes), height, and waist circumference. Following, we used
bioelectrical impedance measurements (Body Impedance Analyzer BIA 2000-S, Data Input GmbH) including the determination of body fat and water, extracellular mass, body cell mass, and basic
metabolic rate to assess general markers of body composition. In addition, a measurement of a standard three-channel electrocardiogram (ECG) was performed (Supplementary Information 1.7).
From these assessments we included the following seven predictors: heart rate (beats per minute), body mass index (BMI), extracellular mass to body cell mass (ECM/BCM ratio), basic metabolic
rate, corrected body fat (kg), total body water (kg), and lean body mass (kg). In total, 247 predictors were included in the analysis (see Supplementary Table 1 for all predictors). ML
PIPELINE For our first set of models we entered all predictor modalities into our pipeline for consideration. To ensure the unbiased approximation of the model’s generalizability to new
patients, we trained and tested all models using repeated nested cross-validation in a pipeline to prevent information leaking between patients used for training and validation. In the inner
cross validation loop, we conducted imputation, standardization, feature selection, hyperparameter optimization, and the fitting of a linear support vector machine (SVM). To begin, we
imputed predictors using multivariate imputation of chained equations with the 10 nearest predictors used in the imputation process. No predictors entered into the pipeline had more than 20%
missing data. Following, all variables were scaled to have a mean of zero and a standard deviation of one. Next, we used the elastic net, a form of penalized logistic regression to select a
final subset of variables for prediction. This approach shrinks the coefficients of highly correlated predictors towards each other while removing irrelevant predictors from the model41,42.
This process was completed simultaneously with an exhaustive grid search to tune model hyperparameters. For the elastic net, the parameters alpha (the amount of penalization) and the l1
ratio (mixing parameter between the l1 and l2 norms) were tuned for predictor selection. For the l1 ratio parameter we searched the values _λ_∈{0.1, 0.5, 0.7, 0.9, 0.95, 0.99}, with values
closer to 1 representing the l1 norm. For alpha, we searched _a_∈{0.1, 0.2…,1.0}. For the SVM, we tuned four values of the regularization parameter _C_∈{0.001, 0.01, 0.1, 1.0}. To
accommodate for the class imbalance in the outcome, each _C_ value was weighted by the inverse percentage proportion of each class label (rehospitalized: yes = 102, no = 278). This approach
increases the penalty for misclassifying the minority class (rehospitalized) given its relative scarcity. Finally, we used Platt scaling to calibrate the probability estimates for the SVMs
binary predictions43,44. The set of predictors and hyperparameters that maximized area under the curve on the receiver operator characteristic (AUC) were selected in the pipeline. See
Supplementary Information 1.8–1.8.7 for further details on the pipeline and Supplementary Information 1.8.5 for the selected hyperparameter values for the elastic net and SVM classifier. All
steps were completed in an inner cross-validation loop with five repeats of 10-fold cross-validation. This method divides the sample into 10 separate subsets, uses nine for training, and
then makes predictions on the final set. To avoid favourable splits in the data, this process is repeated five times, initializing splits uniquely for each repeat. For the testing of our
final models, we used 10-fold cross validation in the outer cross validation loop, averaging model performance metrics across test folds. To assess the statistical significance of our final
best performing model, we used a permutation test _(m_ _=_ 10,000) (see Fig. 1). To assess the predictive capacity of each modality, we trained, clinical, sMRI, cardiovascular, and PGRS only
models using the same pipeline as above, as well as a biomarker only model that aggregated together all biomarker modalities. To assess for a significant omnibus effect between models, we
used a Kruskal–Wallis _H_-test. Following, we used Mann–Whitney rank tests to assess for post hoc differences between our multi and unimodal models. All _p_ values were FDR corrected using
the Benjamini and Hochberg method. All ML models were developed using Scikit-learn in Python 3.6.5. All code for analysis is available on request. OPEN SOURCING OF MODEL To provide
transparency, the use of our model to other research groups, and encourage further external validation of our multimodal model, we uploaded our trained model to the Photon AI online model
repository (https://www.photon-ai.com/repo). This repository allows our multimodal model to be downloaded and tested by other research groups. ANALYSES OF MULTIMODAL PREDICTORS To analyse
the direction, magnitude, and significance of the models selected predictors after controlling for covariates, we used a non-penalized implementation of logistic regression in Python’s
statsmodels package. In addition, we included the average SVM weight values from the outer 10-fold cross-validation loop from our ML pipeline (Supplementary Information 3.1 and Supplementary
Table 2). Further, we conducted ordinary least-squares regression sub-analyses of variables including age, gender, BMI, overall psychotropic medication load, and individual psychotropic
medication use on the biomarkers that were selected in the final multimodal model. This was done to elucidate an understanding of variables that may be associated with these biomarkers and
help explain their inclusion in the multimodal model. In addition, we conducted an exploratory analysis of patient characteristics for those taking a specific type of medication selected in
the multimodal model. This was done to determine: (a) whether this medication proxied for the treatment or prevention of a specific comorbid illness, (b) was taken as a polytheraputic
treatment strategy for MDD, or (c) was acting as a proxy for the presence of unmedicated patients that were relapsing at higher rates than the rest of the sample. For these additional
analyses and results, see Supplementary Information 3.3–3.5. RESULTS MULTIMODAL MODEL Within 2 years of hospitalization for an acute episode of MDD 102 patients (26.8%) were rehospitalized
for a depressive episode, while 278 (73.2%) were not. Our best performing model was our multimodal model (test AUC = 67.74). For our multimodal solution, 10 predictors were selected for
optimal predictions by the elastic net. Those with a positive association with rehospitalization included the number of previous inpatient depressive episodes, individual CES-D items 5 (Last
week I had trouble concentrating) and 3 (In the last week I could not get rid of my mood, although my friends/family tried to cheer me up), Pittsburgh Sleep Quality Index (PSQI) item 7
(During the past month, how often have you had trouble staying awake while driving, eating meals, or engaging in social activity?), the PSQI sleep quality index (global score), taking
diazepines, oxazepines, thiazepines and oxepines, and right hippocampal volume. Predictors with a negative association included cholesterol (mmol/l), taking thyroid medications: yes/no, and
how often do you drink alcohol? (At most once a week/more than once a week). See Supplementary Figs. 1–3. Our final multimodal model provided an increase in prognostic certainty of 23.21%
(prognostic summary index = (PPV+NPV)–100). Further, a patient classified as being re-hospitalized by our model was 83% more likely to be rehospitalized than a patient who was not
(\({\mathrm{positive}}\;{\mathrm{likelihood}}\;{\mathrm{ratio}} = \frac{{\mathrm {sensitivity}}}{{1 - \mathrm {specificity}}}\)). Finally, our multimodal classifier was statistically
significant after permutation testing (_p_ _=_ 9.99−e05) (Fig. 1, Table 3). For individual modality models, see Supplementary Information 3.2. DISCUSSION The current study is the first of
its kind to investigate the role of multiple predictor modalities for MDD rehospitalization trajectory modelling. Overall, our multimodal model provided a 23.21% increase in prognostic
certainty for patient rehospitalization classification while providing an isolated subset of multimodal predictors for analysis. Furthermore, our multimodal model was statistically
significant after permutation testing. Of clinical importance is the positive (PPV) and negative predicted values (NPV) of our multimodal model and how they can be used to inform clinical
decision making. As PPV was low (PPV = 41.64), using this model to confirm clinician suspicion of rehospitalization is not supported. On the contrary, NPV was modestly high (NPV = 81.57).
Suggesting that the model could be used to confirm a clinician’s suspicion of low rehospitalization risk, potentially identifying the patient as suitable for less assertive follow-up. As few
studies are yet to consider a diverse range of biomarker modalities for rehospitalization trajectory modelling, the discriminative ability of the included modalities, as well as their
interaction with clinical markers is of interest. First, our best performing model was multimodal, including a range of clinical, blood-biomarker, and structural imaging predictors. A recent
work by Koutsouleris et al.45 also demonstrated the superiority of multimodal models, finding that a combination of clinical and neuroimaging markers was most predictive of functional
outcomes in a cohort of patients at risk for psychosis with recent onset depression. Our findings build on this work as well as provide preliminary evidence for the discriminative ability of
blood biomarkers on a well-defined and clinically meaningful dichotomous endpoint. Given that clinical predictors have consistently demonstrated their discriminative ability in multivariate
pattern recognition studies12,14,46, it is unsurprising that 8 of 10 predictors in our multimodal solution were clinical. On the contrary, PGRS scores were of no use for rehospitalization
classification (test AUC = 50.5) showing the least discriminative ability of all the modelled modalities. Even with lower _p_ value thresholds (_p_ = 0.05 and 0.01), no changes were seen in
our multimodal model. In addition, unimodal PGRS discrimination was still low at these thresholds (AUC = 54.83 and 54.17 respectively, Supplementary Information 3.2). PGRS scores have
received strong interest in psychiatric research, hoping that the aggregation of multiple single-nucleotide polymorphisms may illuminate genetic differences in psychiatric traits as well as
parse the heterogeneity of outcomes such as medication response47,48. Significant associations with outcomes of interest have been consistently demonstrated, however, commonly explain less
than 1–2% of variance, limiting their current clinical use. Given that PGRS scores could not classify rehospitalization any better than chance in the current work, the discovery of more
variants as well as non-linear modelling techniques may improve their clinical utility in future works49. All other biological modalities performed better, yet still lacked clinically
meaningful discriminative ability when modelled without clinical predictors. Given these findings and those of Koutsouleris et al.45, it appears that biomarkers may be of prognostic use but
likely perform best when modelled with clinical predictors also. Regarding the selection of diazepines, oxazepines, thiazepines, and oxepines and their positive association with
rehospitalization, it is possible that patients on this class of drugs at baseline had a more severe form of illness requiring augmentation with antipsychotic medications, placing them at a
greater risk of rehospitalization. In addition, thyroid medication use was negatively associated with rehospitalization. Besides a small handful of patients, those with a past diagnosis of
hyper/hypothyroidism who were not currently taking thyroid medications had t3, t4, and TSH levels within healthy reference ranges (Supplementary Information 3.3), suggesting that it was not
the presence of unmedicated patients with thyroid disorders relapsing at high rates that were responsible for thyroid medication use and its negative association with rehospitalization.
Considering that nearly all patients were taking antidepressant medications at their baseline assessment, it is possible that a synergistic prophylactic relationship between thyroid and
antidepressant medication use may exist. Such a polytheraputic relationship has been robustly demonstrated in the multisite sequenced alternatives to relieve depression trial (STAR*D)29.
However, prophylactic effects against rehospitalization should be explored in future works. Of interest, right hippocampal volume showed a positive association with rehospitalization. This
was surprising, given the well-established effect of smaller hippocampal volumes in MDD patients compared to healthy controls6. To better understand this observation, we conducted a range of
sub-analysis (Supplementary Information 3.4). In accordance with previous works50,51, we showed that those taking any form of antipsychotic at baseline had larger right hippocampal volumes
than those who were not, albeit, this effect was not significant after controlling for covariates. In addition, we showed that there was a significant gender/diazepine, oxazepine,
thiazepine, and oxepine use interaction effect on right hippocampal volumes, with women currently taking medications from this class having significantly larger right hippocampal volumes
than those who were not. Forty-four percent of these women ended up being rehospitalized between baseline and their 2-year follow-up assessment, compared to only 22% of women who were not.
While we had binary usage data for medication, dosage data were not available. Dosage effects were likely prevalent, but not quantifiable in the current work. Overall, it is plausible that
changes in right hippocampal volume proxied for a complex gender/medication/dosage-specific aetiology not fully represented in our clinical data. The first limitation of the current work is
the models’ scope. As our model was trained on a middle-aged European cohort, it is plausible that some of the selected predictors in our pipeline were unique to this demographic. Predictors
such as the number of previous inpatient episodes will likely be larger on an older cohort, offering more discriminative ability. Therefore, the clinical utility of the model needs to be
considered within this scope. To overcome this limitation, we have provided our trained model online through the Photon AI model repository. Further limitations include the reporting of
nominal significance in our logistic regression model (Supplementary Information 3.1). It is important to consider that the nominally significant effects that were found in our non-penalized
logistic regression model did not survive FDR corrections (Supplementary Table 2). However, our primary interest was the emergent multivariate pattern that demonstrated statistically
significant class separation between cases and controls at _p_ _=_ 9.99−e05. Given the importance and statistical significance of this aggregated multivariate pattern, we deemed it necessary
to conduct an exploratory analysis to illuminate the contribution of each individual predictor after rigorously controlling for known covariates age, gender, smoker status, BMI, and
intracranial volume. Given this, we believe the nominal significance of predictors in our logistic regression model to be of use for hypothesis generation in future works. Regarding clinical
use, while our multimodal model was statistically significant after permutation testing, its balanced accuracy was relatively low (BA = 63.05). Whether this level of performance is
sufficient for clinical use is unknown; however, this BA is similar to that attained in a previous work that is now deployed clinically (BA = 59.60–64.6)14. Further, we argue that it is not
the absolute accuracy of a model that should dictate whether it is of clinical use, but whether or not it outperforms current clinical best practice. For example, as rehospitalization risk
is not formally and routinely quantified by clinicians to inform their clinical decision making, we would not expect clinician prognostication of rehospitalization to be any better than
chance. Therefore, even a modestly performing model would theoretically confer clinical advantage when deployed at scale. In addition, such a model would be free of well-documented
decision-making biases that are known to affect clinician prognostication52 (e.g., anchoring effects), potentially providing further clinical benefit under high workloads commonly seen in
inpatient care. Nonetheless, for these questions to be answered, future works that benchmark clinicians’ prognostic abilities are needed before such incremental utility can be quantified.
Finally, it is important to note that while our multimodal model provided the highest degree of class separation, after testing for post hoc differences between all models and FDR correcting
_p_ values, our multimodal model did not significantly outperform our model containing only clinical predictors (_p_ _=_ 0.15) (Supplementary Information 3.2). Future works of increased
size may be required to elucidate a statistically significant difference given the small predictive discrepancy between the multimodal and clinical model. On the contrary, clinical data of
sufficient depth (for example, that captures the previously discussed gender/medication/dosage effects and their association with right hippocampal volumes) may even mitigate the
contribution of biomarkers in future works. If so, these models will bestow both ease of use and economic advantage, rendering the inclusion of costly and harder to attain biomarkers
ineffectual. To answer these questions a greater dearth of clinical data, discovery samples of increased size, as well as validation samples that are phenotypically and geographically
diverse will be required. In conclusion, the presented findings suggest that the combination of ML techniques with multimodal clinical and biomarker data may lead to an increase in
prognostic certainty compared to chance level. Continued research is required, but ML may be of use to derive models for clinicians to make personalized predictions regarding
rehospitalization risk as well as better inform prophylactic treatment strategies. REFERENCES * Hardeveld, F., Spijker, J., De Graaf, R., Nolen, W. A. & Beekman, A. T. Prevalence and
predictors of recurrence of major depressive disorder in the adult population. _Acta Psychiatr. Scand._ 122, 184–191 (2010). Article CAS PubMed Google Scholar * Paykel, E. S. et al.
Residual symptoms after partial remission: an important outcome in depression. _Psychol. Med._ 25, 1171–1180 (1995). Article CAS PubMed Google Scholar * Ramana, R. et al. Remission and
relapse in major depression: a two-year prospective follow-up study. _Psychol. Med._ 25, 1161–1170 (1995). Article CAS PubMed Google Scholar * Keller, M. B., Lavori, P. W., Lewis, C. E.
& Klerman, G. L. Predictors of relapse in major depressive disorder. _JAMA_ 250, 3299–3304 (1983). Article CAS PubMed Google Scholar * Grilo, C. M. et al. Personality disorders
predict relapse after remission from an episode of major depressive disorder: a 6-year prospective study. _J. Clin. Psychiatry_ 71, 1629–1635 (2010). Article PubMed PubMed Central Google
Scholar * Schmaal, L. et al. Subcortical brain alterations in major depressive disorder: findings from the ENIGMA Major Depressive Disorder working group. _Mol. Psychiatry_ 21, 806–812
(2016). Article CAS PubMed Google Scholar * Appelhof, B. C. et al. Glucocorticoids and relapse of major depression (dexamethasone/corticotropin-releasing hormone test in relation to
relapse of major depression). _Biol. Psychiatry_ 59, 696–701 (2006). Article CAS PubMed Google Scholar * Zobel, A. W., Yassouridis, A., Frieboes, R. M. & Holsboer, F. Prediction of
medium-term outcome by cortisol response to the combined dexamethasone-CRH test in patients with remitted depression. _Am. J. Psychiatry_ 156, 949–951 (1999). Article CAS PubMed Google
Scholar * Berman, R. M. et al. Transient depressive relapse induced by catecholamine depletion: potential phenotypic vulnerability marker? _Arch. Gen. Psychiatry_ 56, 395–403 (1999).
Article CAS PubMed Google Scholar * Gili, M., Vicens, C., Roca, M., Andersen, P. & McMillan, D. Interventions for preventing relapse or recurrence of depression in primary health
care settings: a systematic review. _Prev. Med._ 76, S16–S21 (2015). Article PubMed Google Scholar * Teismann, H., et al. Establishing the bidirectional relationship between depression
and subclinical arteriosclerosis—rationale, design, and characteristics of the BiDirect Study. _BMC Psychiatry_ 14, 3–4. https://doi.org/10.1186/1471-244x-14-174 (2014). * Chekroud, A. M. et
al. Reevaluating the efficacy and predictability of antidepressant treatments: a symptom clustering approach. _JAMA Psychiatry_ 74, 370–378 (2017). Article PubMed PubMed Central Google
Scholar * Drysdale, A. T. et al. Resting-state connectivity biomarkers define neurophysiological subtypes of depression. _Nat. Med._ 23, 28–38 (2017). Article CAS PubMed Google Scholar
* Chekroud, A. M. et al. Cross-trial prediction of treatment outcome in depression: a machine learning approach. _Lancet Psychiatry_ 3, 243–250 (2016). Article PubMed Google Scholar *
Koutsouleris, N. et al. Prediction models of functional outcomes for individuals in the clinical high-risk state for psychosis or with recent-onset depression: a multimodal, multisite
machine learning analysis. _JAMA Psychiatry_. https://doi.org/10.1001/jamapsychiatry.2018.2165 (2018). Article PubMed PubMed Central Google Scholar * Kambeitz, J. et al. Detecting
neuroimaging biomarkers for depression: a meta-analysis of multivariate pattern recognition studies. _Biol. Psychiatry_ 82, 330–338 (2017). Article PubMed Google Scholar * Schmaal, L. et
al. Predicting the naturalistic course of major depressive disorder using clinical and multimodal neuroimaging information: a multivariate pattern recognition study. _Biol. Psychiatry_ 78,
278–286 (2015). Article PubMed PubMed Central Google Scholar * Moayedoddin, B. et al. Prevalence and clinical characteristics of the DSM IV major depression among general internal
medicine patients. _Eur. J. Intern. Med._ 24, 763–766 (2013). Article PubMed Google Scholar * Lopresti, A. L., Maker, G. L., Hood, S. D. & Drummond, P. D. A review of peripheral
biomarkers in major depression: the potential of inflammatory and oxidative stress biomarkers. _Prog. Neuropsychopharmacol. Biol. Psychiatry_ 48, 102–111 (2014). Article PubMed Google
Scholar * Weber, B., Lewicka, S., Deuschle, M., Colla, M. & Heuser, I. Testosterone, androstenedione and dihydrotestosterone concentrations are elevated in female patients with major
depression. _Psychoneuroendocrinology_ 25, 765–771 (2000). Article CAS PubMed Google Scholar * Schweiger, U. et al. Testosterone, gonadotropin, and cortisol secretion in male patients
with major depression. _Psychosom. Med._ 61, 292–296 (1999). Article CAS PubMed Google Scholar * Musselman, D. L., Evans, D. L. & Nemeroff, C. B. The relationship of depression to
cardiovascular disease: epidemiology, biology, and treatment. _Arch. Gen. Psychiatry_ 55, 580–592 (1998). Article CAS PubMed Google Scholar * Wray, N. R. et al. Genome-wide association
analyses identify 44 risk variants and refine the genetic architecture of major depression. _Nat. Genet._ 50, 668–681 (2018). Article CAS PubMed PubMed Central Google Scholar * Knight,
M. J. & Baune, B. T. Cognitive dysfunction in major depressive disorder. _Curr. Opin. Psychiatry_ 31, 26–31 (2018). Article PubMed Google Scholar * Lopresti, A. L., Hood, S. D. &
Drummond, P. D. A review of lifestyle factors that contribute to important pathways associated with major depression: diet, sleep and exercise. _J. Affect. Disord._ 148, 12–27 (2013).
Article PubMed Google Scholar * Murphy, M. J. & Peterson, M. J. Sleep disturbances in depression. _Sleep Med. Clin._ 10, 17–23 (2015). Article PubMed Google Scholar * Chekroud, S.
R. & Chekroud, A. M. Efficacy of resistance exercise training with depressive symptoms. _JAMA Psychiatry_ 75, 1091–1092 (2018). Article PubMed Google Scholar * Schmaal, L. et al.
Cortical abnormalities in adults and adolescents with major depression based on brain scans from 20 cohorts worldwide in the ENIGMA Major Depressive Disorder Working Group. _Mol. Psychiatry_
22, 900–909 (2017). Article CAS PubMed Google Scholar * Nierenberg, A. A. et al. A comparison of lithium and T(3) augmentation following two failed medication treatments for depression:
a STAR*D report. _Am. J. Psychiatry_ 163, 1519–1530 (2006). quiz 665. Article PubMed Google Scholar * Joffe, R. T. & Marriott, M. Thyroid hormone levels and recurrence of major
depression. _Am. J. Psychiatry_ 157, 1689–1691 (2000). Article CAS PubMed Google Scholar * Joffe, R., Segal, Z. & Singer, W. Change in thyroid hormone levels following response to
cognitive therapy for major depression. _Am. J. Psychiatry_ 153, 411–413 (1996). Article CAS PubMed Google Scholar * Sassarini, D. J. Depression in midlife women. _Maturitas_ 94,
149–154. Article PubMed Google Scholar * Schiller, C. E., Meltzer-Brody, S. & Rubinow, D. R. The role of reproductive hormones in postpartum depression. _CNS Spectr._ 20, 48–59
(2015). Article PubMed Google Scholar * Rodgers, S. et al. Serum testosterone levels and symptom-based depression subtypes in men. _Front. Psychiatry_ 6, 61 (2015). Article PubMed
PubMed Central Google Scholar * Almeida, O. P., Yeap, B. B., Hankey, G. J., Jamrozik, K. & Flicker, L. Low free testosterone concentration as a potentially treatable cause of
depressive symptoms in older men. _Arch. Gen. Psychiatry_ 65, 283–289 (2008). Article CAS PubMed Google Scholar * Kische, H. et al. Associations of androgens with depressive symptoms and
cognitive status in the general population. _PLoS One_ 12, e0177272 (2017). Article PubMed PubMed Central CAS Google Scholar * Parekh, A., Smeeth, D., Milner, Y. & Thure, S. The
role of lipid biomarkers in major depression. _Healthcare (Basel)_. 5, https://doi.org/10.3390/healthcare5010005 (2017). Article PubMed Central Google Scholar * Maes, M. et al. Lower
serum high-density lipoprotein cholesterol (HDL-C) in major depression and in depressed men with serious suicidal attempts: relationship with immune-inflammatory markers. _Acta Psychiatr.
Scand._ 95, 212–221 (1997). Article CAS PubMed Google Scholar * Lee, S. H. et al. Genetic relationship between five psychiatric disorders estimated from genome-wide SNPs. _Nat. Genet._
45, 984–994 (2013). Article CAS PubMed Google Scholar * Brainstorm C. et al. Analysis of shared heritability in common disorders of the brain. _Science_ 360,
https://doi.org/10.1126/science.aap8757 (2018). * Zou, H. & Hastie, T. Regularization and variable selection via the elastic net. _J. R. Stat. Soc. Ser. B (Stat. Methodol.)_ 67, 301–320
(2005). Article Google Scholar * Friedman, J., Hastie, T. & Tibshirani, R. Regularization paths for generalized linear models via coordinate descent. _J. Stat. Softw._ 33, 1 (2010).
Article PubMed PubMed Central Google Scholar * Platt, J. Probabilistic outputs for support vector machines and comparisons to regularized likelihood methods. In: Smola, A. J., Barlett,
P. L., Scholkopf, B. & Schuurmans, D. (eds.) _Advances in Large Margin Classifiers_. Vol. 10, 61–74 (The MIT press, Cambridge, Massacheussets, London, England, 1999). * Niculescu-Mizil
A., Caruana R. Predicting good probabilities with supervised learning. In: _Proceedings of the 22nd International Conference on Machine Learning_. 625–632 (ACM, 2005). * Koutsouleris, N. et
al. Prediction models of functional outcomes for individuals in the clinical high-risk state for psychosis or with recent-onset depression: a multimodal, multisite machine learning analysis.
_JAMA Psychiatry_ 75, 1156–1172 (2018). Article PubMed PubMed Central Google Scholar * Koutsouleris, N., Kahn, R. S. & Chekroud, A. M. Multisite prediction of 4-week and 52-week
treatment outcomes in patients with first-episode psychosis: a machine learning approach (vol 3, pg 935, 2016). _Lancet Psychiatry_ 4, 95 (2017). Article Google Scholar * Amare, A. T. et
al. Association of polygenic score for schizophrenia and HLA antigen and inflammation genes with response to lithium in bipolar affective disorder: a genome-wide association study. _JAMA
Psychiatry_ 75, 65–74 (2018). PubMed Google Scholar * Amare, A. T. et al. Association of the polygenic scores for personality traits and response to selective serotonin reuptake inhibitors
in patients with major depressive disorder. _Front. Psychiatry_ 9, 65 (2018). Article PubMed PubMed Central Google Scholar * Zheutlin, A. B. et al. Multivariate pattern analysis of
genotype–phenotype relationships in schizophrenia. _Schizophrenia Bull._ 44, 1045–1052 (2018). Article Google Scholar * Bodnar, M. et al. The effect of second-generation antipsychotics on
hippocampal volume in first episode of psychosis: longitudinal study. _BJPsych Open._ 2, 139–146 (2016). Article PubMed PubMed Central Google Scholar * Chakos, M. H. et al. Duration of
illness and treatment effects on hippocampal volume in male patients with schizophrenia. _Br. J. Psychiatry_ 186, 26–31 (2005). Article PubMed Google Scholar * Saposnik, G., Redelmeier,
D., Ruff, C. C. & Tobler, P. N. Cognitive biases associated with medical decisions: a systematic review. _BMC Med Inf. Decis. Mak._ 16, 138 (2016). Article Google Scholar Download
references ACKNOWLEDGEMENTS The BiDirect Study is funded by the German Federal Ministry of Education and Research (BMBF (01ER0816 and 01ER1506, and 01ER1205)). Additional funding for the
analysis was provided by the German Research Foundation (DFG, grant FOR2107 DA1151/5-1 and DA1151/5-2 to U.D.; SB-TRR58, Projects C09 and Z02), the Interdisciplinary Center for Clinical
Research (IZKF) of the medical faculty of Münster (grant Dan3/012/17 to U.D., SEED 11/18 to NO) and the Deanery of the Medical Faculty of the University of Münster. In addition, this work
was supported with supercomputing resources provided by the Phoenix HPC service at the University of Adelaide. The funding sources had no role in study design, collection, analysis, or
interpretation of the data, in the writing of the report, or in the decision to submit the article for publication. AUTHOR INFORMATION Author notes * These authors contributed equally: Micah
Cearns, Nils Opel AUTHORS AND AFFILIATIONS * Discipline of Psychiatry, School of Medicine, University of Adelaide, Adelaide, Australia Micah Cearns & Scott Clark * Department of
Psychiatry, University of Münster, Münster, Germany Nils Opel, Claas Kaehler, Udo Dannlowski & Bernhard T. Baune * Interdisciplinary Centre for Clinical Research (IZKF), University of
Münster, Münster, Germany Nils Opel * Centre for Healthy Brain Ageing, UNSW, Sydney, Australia Anbupalam Thalamuthu * Institute of Clinical Radiology, University of Münster, Münster, Germany
Walter Heindel * Institute of Clinical Chemistry and Laboratory Medicine, University Medicine Greifswald, Greifswald, Germany Theresa Winter * Integrated Research Biobank, University
Medicine Greifswald, Greifswald, Germany Theresa Winter * Institute of Epidemiology and Social Medicine, University of Münster, Münster, Germany Henning Teismann, Heike Minnerup & Klaus
Berger * Department of Psychiatry, Melbourne Medical School, The University of Melbourne, Melbourne, Australia Bernhard T. Baune * The Florey Institute of Neuroscience and Mental Health, The
University of Melbourne, Melbourne, Australia Bernhard T. Baune Authors * Micah Cearns View author publications You can also search for this author inPubMed Google Scholar * Nils Opel View
author publications You can also search for this author inPubMed Google Scholar * Scott Clark View author publications You can also search for this author inPubMed Google Scholar * Claas
Kaehler View author publications You can also search for this author inPubMed Google Scholar * Anbupalam Thalamuthu View author publications You can also search for this author inPubMed
Google Scholar * Walter Heindel View author publications You can also search for this author inPubMed Google Scholar * Theresa Winter View author publications You can also search for this
author inPubMed Google Scholar * Henning Teismann View author publications You can also search for this author inPubMed Google Scholar * Heike Minnerup View author publications You can also
search for this author inPubMed Google Scholar * Udo Dannlowski View author publications You can also search for this author inPubMed Google Scholar * Klaus Berger View author publications
You can also search for this author inPubMed Google Scholar * Bernhard T. Baune View author publications You can also search for this author inPubMed Google Scholar CORRESPONDING AUTHOR
Correspondence to Bernhard T. Baune. ETHICS DECLARATIONS CONFLICT OF INTEREST The authors declare that they have no conflict of interest. ADDITIONAL INFORMATION PUBLISHER’S NOTE Springer
Nature remains neutral with regard to jurisdictional claims in published maps and institutional affiliations. SUPPLEMENTARY INFORMATION SUPPLEMENTARY INFORMATION RIGHTS AND PERMISSIONS OPEN
ACCESS This article is licensed under a Creative Commons Attribution 4.0 International License, which permits use, sharing, adaptation, distribution and reproduction in any medium or format,
as long as you give appropriate credit to the original author(s) and the source, provide a link to the Creative Commons license, and indicate if changes were made. The images or other third
party material in this article are included in the article’s Creative Commons license, unless indicated otherwise in a credit line to the material. If material is not included in the
article’s Creative Commons license and your intended use is not permitted by statutory regulation or exceeds the permitted use, you will need to obtain permission directly from the copyright
holder. To view a copy of this license, visit http://creativecommons.org/licenses/by/4.0/. Reprints and permissions ABOUT THIS ARTICLE CITE THIS ARTICLE Cearns, M., Opel, N., Clark, S. _et
al._ Predicting rehospitalization within 2 years of initial patient admission for a major depressive episode: a multimodal machine learning approach. _Transl Psychiatry_ 9, 285 (2019).
https://doi.org/10.1038/s41398-019-0615-2 Download citation * Received: 30 April 2019 * Revised: 08 October 2019 * Accepted: 20 October 2019 * Published: 11 November 2019 * DOI:
https://doi.org/10.1038/s41398-019-0615-2 SHARE THIS ARTICLE Anyone you share the following link with will be able to read this content: Get shareable link Sorry, a shareable link is not
currently available for this article. Copy to clipboard Provided by the Springer Nature SharedIt content-sharing initiative