Play all audios:
ABSTRACT It is currently unknown whether the complexity and variability of cardiac dynamics predicts future depression and whether within-subject change herein precedes the recurrence of
depression. We tested this in an innovative repeated single-subject study in individuals who had a history of depression and were tapering their antidepressants. In 50 individuals,
electrocardiogram (ECG) derived Interbeat-interval (IBI) time-series data were collected for 5 min every morning and evening, for 4 months. Usable data were obtained from 14 participants who
experienced a transition (i.e., a clinically significant increase in depressive symptoms) and 14 who did not. The mean, standard deviation, Higuchi dimension and multiscale entropy,
calculated from IBIs, were examined for time trends. These quantifiers were also averaged over a baseline period and compared between the groups. No consistent trends were observed in any
quantifier before increases in depressive symptoms within individuals. The entropy baseline levels significantly differed between the two groups (morning: _P_ value < 0.001, Cohen’s _d_ =
−2.185; evening: _P_ value < 0.001, Cohen’s _d_ = −1.797) and predicted the recurrence of depressive symptoms, in the current sample. Moreover, higher mean IBIs and Higuchi dimensions
were observed in individuals who experienced transitions. While we found little evidence to support the existence of within- individual warning signals in IBI time-series data preceding an
upcoming depressive transition, our results indicate that individuals who taper antidepressants and showed lower entropy of cardiac dynamics exhibited a higher chance of recurrence of
depression. Hence, entropy could be a potential digital phenotype for assessing the risk of recurrence of depression in the short term while tapering antidepressants. SIMILAR CONTENT BEING
VIEWED BY OTHERS A BAYESIAN ANALYSIS OF HEART RATE VARIABILITY CHANGES OVER ACUTE EPISODES OF BIPOLAR DISORDER Article Open access 03 October 2024 ELECTROCARDIOGRAPHY-DERIVED AUTONOMIC
PROFILES IN DEPRESSION AND SUICIDE RISK WITH INSIGHTS FROM THE UK BIOBANK Article Open access 14 May 2025 INTENSIFICATION OF FUNCTIONAL NEURAL CONTROL ON HEARTBEAT DYNAMICS IN SUBCLINICAL
DEPRESSION Article Open access 14 April 2021 INTRODUCTION Determining the risk of recurrence of depression, especially when tapering antidepressants is a challenging problem. Tapering of
antidepressants can typically lead to a worsening of depressive symptoms [1,2,3,4]. Hence, warning signs indicating the possibility of recurrence of depression or worsening of symptoms are
of immense importance. Complex dynamical systems theory predicts the presence of early warning signals in the response of a system before many kinds of transitions [5]. Recent studies based
on this have shown promise in predicting depressive episodes from momentary affect data [6,7,8]. Such changes in the dynamics of depression could lead to potential warning signals in cardiac
dynamics as well. These could include measures such as heart rate, heart rate variability, and complexity, all of which have been shown to be altered in patients with depression [9,10,11].
Since the response of the heart is well understood to be nonlinear, it is prudent to study its nonlinear dynamics when seeking warning signals for depression [12]. These nonlinear dynamics
can be quantified from the electrocardiogram (ECG) derived InterBeat-Interval (IBI) time series, using complexity measures such as the entropies, dimensions, and Lyapunov exponents.
Deviations from healthy values for many of these measures, such as the fractal dimension, are associated with pathology [13, 14]. Disorders of various types, including mental disorders
[15,16,17,18,19,20,21], are associated with a reduction in the complexity of dynamics of the heart. The complexity of cardiac dynamics, as well as simpler measures such as the mean and
variability of IBI have been shown to be reduced in individuals diagnosed with depression, as well as dysphoria [15, 16, 22,23,24], although there is debate about whether this reduction can
be explained completely by the effect of antidepressants [11, 25, 26]. For complexity measures of IBI time series to be potentially used as an early warning indicator for upcoming increases
in depressive symptoms, a reduction in the complexity of cardiac dynamics must occur in the period before transitions towards higher levels of depression. This has not been empirically
studied yet. To examine whether a reduction in the complexity of cardiac dynamics over time occurs just before patients transition towards higher levels of depressive symptoms, a
single-subject design including IBI time-series data may be employed. A between-subject design, on the other hand, is appropriate if one wants to study average differences in the complexity
of cardiac dynamics that exist in the sample. The present TRANSitions In Depression (TRANS-ID) Tapering study employs a repeated single-subject design, where intensive longitudinal data of
different types (momentary affect, physical activity and ECG) were collected for four months within formerly depressed individuals tapering their antidepressants, offering the possibility
for both within-subject as well as between-subject studies [27,28,29,30]. We examine whether a decrease in the mean, standard deviation, and complexity in IBI time-series data as captured
with the Higuchi dimension and multiscale entropy precedes a depressive transition (i.e., recurrence of depressive symptoms) by 4–8 weeks, a timescale observed in previous studies [6, 7,
31]. These complexity measures were chosen as they capture two different aspects of complexity. Fractal dimensions quantify long-range correlations in data, which are closely related to
deviations from normal physiological regulation [14]. While several types of estimates of the fractal dimension exist [32, 33], in this work, we choose the Higuchi fractal dimension, a
measure that has been extensively used to study cardiac data [34]. The multiscale entropy captures the information content in the time series across different time scales. We conduct
repeated single within-subject analyses, where we study whether decreases in these quantifiers over time precede a transition towards depression for each individual separately in formerly
depressed individuals who taper their antidepressant medication. Furthermore, to study average tendencies, we also conduct a between-subject analysis to test whether the baseline complexity
(chosen as the first 4 weeks of assessments), is lower for individuals who experienced a transition towards higher depressive symptom levels during the study period versus those who did not.
MATERIALS AND METHODS SAMPLE Our sample consisted of participants of the TRANS-ID Tapering study, a study that aimed at examining early warning signals of increases in depressive symptoms
during and after tapering of antidepressant medication (for details, see refs. [28, 35]). In short, 69 individuals who had an earlier diagnosis with major depressive disorder (MDD) according
to DSM-IV criteria monitored themselves for four months with weekly questionnaires, Ecological Momentary Assessment (EMA), actigraphy, and ECG sensors. These individuals made a shared
decision with their mental health care provider to taper their antidepressant dosage (see Supplementary SA1 for details) and did not meet the criteria for MDD at baseline. The study was
approved by the Medical Ethical Committee of the University Medical Center Groningen (UMCG, METc2016.443). All patients were informed that they could stop their participation at any time and
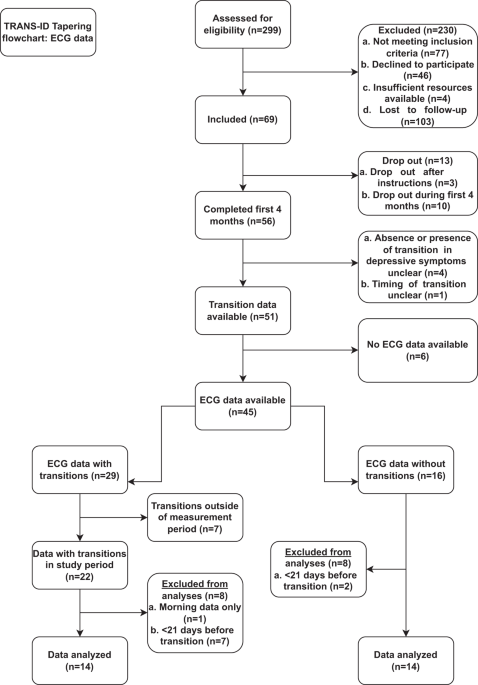
provided written informed consent prior to participation. PARTICIPANTS AND PROCEDURES TRANS-ID TAPERING ECG SUB-STUDY The flowchart of the TRANS-ID Tapering ECG sub-study is shown in Fig.
1. Out of 69 individuals, 50 individuals had usable ECG recordings. The presence or absence of transitions could be reliably calculated in 45 of these individuals. Among them, 29 experienced
a transition in depressive symptoms, while 16 did not. From those with a transition, we excluded 7 individuals who did not have at least 3 weeks of data prior to the transition, to avoid
spurious trends caused by too few datapoints. Also excluded from this group were 7 individuals whose transitions occurred outside of the ECG measurement period and 1 individual who only had
morning assessments. Hence, of the original 69 individuals, valid ECG data were available for 14 individuals with a transition, which formed the transition group in the current paper. Of the
16 who did not show any transitions, 2 individuals were excluded, as they had less than 3 weeks of data available for analysis, leaving a sample of 14 individuals who did not experience any
transitions for analysis. ECG ASSESSMENTS AND PRE-PROCESSING Participants performed their ECG assessments at home after receiving a 15-min step-by-step instruction on how to do so during
the introductory session. Additionally, participants received a written manual (see https://osf.io/zbrxe/), ECG-electrodes, and contact details for 24/7 support (more details are given in
Supplementary SA2). The ECG files were processed meticulously to extract the InterBeat-Interval (IBI) time-series data as detailed in Supplementary SA3. IBI DATA PROCESSING INDEPENDENT
VARIABLES Four quantifiers were derived from each IBI time-series assessment; the mean and standard deviation, and two complexity measures, namely the Higuchi dimension and the multiscale
entropy. All four quantifiers have been widely used to study cardiac dynamics [15, 24, 36,37,38,39]. MEAN This is the average of the IBIs representing the mean time between two R-peaks. A
higher mean IBI is reflective of a lower heart rate. STANDARD DEVIATION The standard deviation of the IBI time series is referred to as the SDRR (standard deviation of RR intervals) and is a
time-domain measure of heart rate variability [39]. HIGUCHI DIMENSION The Higuchi dimension estimates the fractal dimension of a time series directly, without any need for embedding in
higher dimensions. Hence it can be reliably calculated even with fewer datapoints, as compared to some other estimates of the fractal dimension [40]. It calculates the scaling behavior of
the length of the time-series curves when two parameters, namely the delay time and initial time, are varied [34]. In the present work, the maximum delay time is set to be 5, since the
number of points used for calculating lengths is reduced at higher delays. MULTISCALE ENTROPY The multiscale entropy measures the predictability of fluctuations in time series, at different
scales of measurement. A higher value of entropy indicates a higher complexity of the time series. The multiscale entropy was estimated using the neurokit2 package [41] and the Higuchi
dimension was calculated using the HDFA package [42] in Python v3.5.2. DEPENDENT VARIABLE The dependent variable in the study was a transition towards higher levels of depression based on
the following criteria: (1) a reliable increase (≥ 8.5 points) on the weekly assessed SCL-90 depression subscale, (2) persistence of this increase for at least three weeks, and/or start or
increase in treatment, and/or interruption of tapering, (3) a meaningful increase in depressive symptoms as experienced by participants based on a consensus rating of emails, telephone
calls, open text fields, and the evaluation interview (see also refs. [28, 43]). For the analyses in this paper, in order to compare the samples of individuals who experienced a transition
with those that did not, a pseudo-transition point was determined in the individuals who did not experience a transition. The transition times in the non-transitioning dataset were pair
matched with the transition times of the transitioning dataset. STATISTICAL ANALYSES The analyses are divided into within-subject and between-subject analyses, where the former identified
changes in the quantifiers over time occurring within individuals, and the latter identified differences in average levels of the quantifiers during the 4 weeks of the study period between
the individuals who experienced transitions and those who did not. WITHIN-INDIVIDUAL ANALYSES To study changes at the level of an individual, each of the four quantifiers mentioned above was
calculated for every IBI assessment, over a pre-transition period defined as 8 weeks before a transition. To avoid significant loss of data, all datasets were required to have a minimum of
3 weeks of data prior to the transition. These generated time series of quantifiers were categorized into the morning and evening time series. The Kendall correlation coefficient between
these quantifiers and time was measured to determine the time trends. Significant time trends, as well as the direction of such trends preceding transitions towards greater depressive
symptoms and in patients who stayed in remission were studied, and the number of individuals with significant trends were quantified. BETWEEN-INDIVIDUALS ANALYSES To study mean differences
between individuals who experienced a transition in future and those that did not, we first took the mean values for each quantifier per individual, by averaging over the value for each
measurement through the baseline period. The baseline period was considered as the first 4 weeks of measurement, with a minimum requirement of at least 3 weeks of data. These averaged
quantifiers were compared between the groups by using the non-parametric Mann–Whitney _U_ test. In addition to having multiple advantages over the more commonly used t-test, the Mann–Whitney
_U_ test is more suitable for comparing small sample sizes and when the distributions are not normal, as in the case of heart rate variability measures [44, 45]. The effect size of the
difference between the two groups was measured using Cohen’s _d_ [46]. In addition, to study how well each quantifier predicted an upcoming transition, we used logistic regression models to
predict presence versus absence of a future transition using the calculated quantifiers at baseline. Since ECG variables are known to depend significantly on age, we also tested the models
with age added as a predictor. The goodness of fit was quantified using pseudo R2 values. The logistic regression was conducted in R version 3.6 [47]. Two sensitivity analyses were conducted
on the data. First, since the actual time of transition from baseline varied between individuals, a sensitivity analysis was conducted by averaging over the whole pre-transition period
identified for the individual-level study above. This controlled for the time elapsed between the assessments and the transition. The mean differences and predictive capabilities of the
different quantifiers was then studied for the data averaged over the pre-transition period. A second analysis was conducted post hoc, to test whether the value of complexity parameters
measured in the data arose from underlying nonlinear dynamics, or from stochasticity. For this, surrogate data were generated from the measured IBI data. The surrogates were generated using
the Iterated Amplitude Adjusted Fourier Transform (IAAFT) method, which generated time-series with the same amplitude and Fourier spectrum as the original data but with randomized phases
[48, 49]. The Higuchi dimension and multiscale entropy are then calculated for the surrogate data, and the distributions are compared with the original data. A significant difference between
the distributions of quantifiers for data and surrogates indicate nonlinearity to be the cause of the observed values of complexity. Dependence among the quantifiers at baseline was
measured using the Spearman correlation coefficient (Spearman’s ρ) averaged at the level of an individual. Being a rank correlation coefficient Spearman’s ρ is both robust to outliers and
can detect monotonic nonlinear trends. The _P_ value for significance was set at 0.05. The Mann–Whitney _U_ tests, Kendall and Spearman’s correlations were performed using the scipy package
in Python version 3.5.2 [50]. All codes used for analysis are available at https://github.com/sgeorge91/TransID_IBI. RESULTS SAMPLE DESCRIPTION Data from 14 individuals who showed a
transition during monitoring and data from 14 individuals who did not, were analyzed. The gender ratio did not significantly differ between the groups (78% versus 71% women in the transition
and nontransition groups respectively, _P_ = 0.66). Age was significantly higher in the transition group (_M_ = 51.93 SD = 12.25, _t_ = 2.19, _P_ = 0.04) compared to the nontransition group
(_M_ = 41.79, SD = 11.30). The correlations between the different variables studied in our sample, averaged at baseline, with age, and with each other are listed in Table 1. The mean and
standard deviation of the IBI time series in the morning was related with age. The highest correlations were observed between the evening mean and standard deviations, the morning entropy
and morning dimension, and the evening mean and evening dimension measures. WITHIN-INDIVIDUAL ANALYSES We started by examining the IBI quantifiers for each individual for significant trends
over time using Mann–Kendall trend test. Few trends were found in the hypothesized negative direction, that is, a decrease over time for the Higuchi dimension and the multiscale entropy.
Within the morning assessments, we observe negative trends (14%) for the Higuchi dimension in 2 out of the 14 individuals who experienced a transition and no trends among those who did not.
No negative trends were observed for any individual with or without a transition in depression for the entropy quantifier. For the evening assessments, no negative trends were found for the
Higuchi dimension, whereas one negative trend was found an individual without a transition (7%). No negative trends were observed for any of the individuals in either group for the entropy
quantifier. Positive time trends were found in the morning assessments in three individuals (21%) for the Higuchi dimension and in 1 individual (7%) for the entropy among those with a
transition. Three individuals in the non-transitioning group (21%) showed positive trends too for the Higuchi dimension, whereas no individuals in the non-transitioning group showed any
trend for the entropy. In the evening assessments, the transitioning group showed no positive trends for the Higuchi dimension, whereas the entropy showed positive trends in two individuals
(14%). The non-transitioning group showed positive trends in four individuals (29%) for the Higuchi dimension, and no trends for entropy. Detailed results for the within-individual analyses
showing the trends for each individual and quantifier are presented in Supplementary SA4. BETWEEN-INDIVIDUALS ANALYSES Next, we studied group differences in the quantifiers averaged within
individuals over the baseline period of 4 weeks. The mean differences for these averaged quantifiers between individuals who experienced a transition, and those who did not are listed in
Table 2. Figure 2 shows the corresponding distributions for the two groups as violin plots. For the morning assessments, individuals who experienced transitions showed a significantly higher
mean IBI and Higuchi dimension, and a significantly lower entropy than individuals who did not experience a transition. For the evening assessments, the individuals who experienced a
transition showed a significantly higher Higuchi dimension and a significantly lower entropy than individuals who did not experience a transition. The results of the logistic regression
model used to predict whether the individual will undergo a transition or not are given in Table 3. The model where the entropy alone predicts the transitions stood out with the highest
explained variance among all the models considered, with a lower baseline entropy significantly predicting a future transition towards higher depressive symptom levels. In Fig. 3, we show
the values of baseline entropy and error for each individual, calculated using the morning and evening assessments. The individuals with a transition occupy a region in the lower left of the
graph, pointing out once again that low values of entropies were largely associated with individuals who experienced transitions in the study period. A grid search on the entropy values
found 1.67 as the morning entropy value (25/28 individuals correctly classified) and 1.51 as the evening entropy value that best discriminates the two groups (27/28 individuals correctly
classified). Noticeably, in this sample, a smaller within-person standard deviation was observed in the entropies associated with the evening assessments, indicating that the entropy
measurements during the morning were less stable than in the evening. SENSITIVITY ANALYSES The first sensitivity analysis, calculating the correlations, mean differences, and predictive
capacity of the quantifiers averaged over the pre-transition period instead of the baseline period, are presented in the supplements (Supplementary SA5). Again, lower entropy over the
pre-transition period was most strongly associated with the presence of a future transition in depressive symptoms, showing the highest significance in the Mann–Whitney _U_ test and highest
explained variance in a logistic regression. The second analysis calculated the deviations of the complexity quantifiers considered in the study from surrogate data. The details of the
analysis are presented in the supplements (Supplementary SA6). We find significant differences (_P_ < 0.05) between the distributions of both the Higuchi dimension and the multiscale
entropy quantified from the original time-series data and surrogates. In particular, the multiscale entropy of the surrogate time-series data showed highly significant (_P_ < 0.001)
deviations from the original time-series. DISCUSSION This work explored how the complexity of IBI time-series data behaves before a transition toward more severe depressive symptoms. While
very few trends within individuals over time were observed in the different cardiac quantifiers before a transition toward depression, we found that the baseline levels of entropy were
significantly lower for individuals who experienced a transition compared to individuals who did not. In addition, we found higher mean IBIs and higher Higuchi dimension for individuals who
experienced transitions. This seems to indicate that below a threshold level of complexity of cardiac dynamics, individuals who taper antidepressants are vulnerable for recurrence. The
combination of higher fractal dimension and lower entropy in individuals who experienced transitions suggests that these time series exhibit more noisy behavior [51, 52]. There is large
variability in the values of complexity variables reported in literature, due to the large heterogeneity in the parameter values used in the estimating algorithm. However, the values
reported previously in the literature for the Higuchi dimension and multiscale entropy are in line with values found in the current study [53,54,55]. In addition, the values of the
complexity measures showed a significant difference from surrogate datasets, suggesting that the obtained measures of complexity arise from deterministic nonlinearity and not from
randomness. The present work is significant in multiple ways. First, it provides little evidence to support the existence of within-individual warning signals in IBI time-series data that
precede and predict an upcoming depressive transition, in line with similar studies using ecological momentary assessment and actigraphy data [27, 43]. Second, the current study shows that
lower entropy values derived from IBI time series indicate that individuals are more likely to experience an increase in depressive symptoms in the coming months, which may be helpful
information when deciding on whether antidepressant medication should be tapered. Based on this we speculate that IBI time-series derived entropy quantifiers could become promising
biomarkers for determining if antidepressants can be tapered with a reduced risk of recurrence of depression. Third, the current study answers an important question on how the complexity and
variability of cardiac dynamics change before the recurrence of depression. While we find that the complexity of cardiac dynamics is significantly lower in individuals who experienced a
transition towards increased depressive symptoms, no decrease in complexity over time was observed before transitions within most individuals. An explanation for the absence of this change
is that the decrease in complexity may have taken place at a timescale longer than the 8 weeks considered in the present study. An alternative reason could be that decreased complexity is a
stable vulnerability that persisted in some individuals from a previous episode of depression, since the sample consisted of individuals who experienced an episode previously. Based on past
work, we expect that an earlier episode would have been associated with decreased complexity of cardiac dynamics [11, 17], and individuals who experienced a transition towards higher
depressive symptoms in this sample possibly did not fully recover their complexity [56]. A major limitation of the study, originally designed for within-individual analysis, is the small
sizes of the groups for between-subject analyses. The current study explored multiple indicators in this small group of participants and may therefore be overfitting the sample. Moreover,
despite the large effect sizes observed for the entropy, inter-individual differences may not be fully captured. A second limitation is the tapering of antidepressants in the current sample.
The cardiotropic effects of antidepressant medication on the dynamics of the heart are well documented, with many of them causing a reduction in the mean heart rate and its variability [24,
57,58,59]. This intake could dominate the effects of the upcoming transition, if any, on the cardiac dynamics. A considerable fraction of the present sample majorly tapered their
antidepressants during the baseline period (17 participants reported tapering more than 2/3rds of their dosage in the baseline period). This could have changed the cardiac dynamics during
the baseline period in both groups. A third limitation was the strict protocols set for the self-assessment of ECG. Apart from being burdensome, such strict assessment instructions could
have resulted in cardiac dynamic signals with less noise, limiting generalization to other studies with ambulatory ECG assessments. However, with improvements in ambulatory ECG monitoring
using less obstructive devices, it may be possible to monitor the complexity of the heart more easily for an extended time in normal daily life [60, 61]. Future studies are needed to
estimate how well the results of the current study generalize to new samples. The promising results of our study points to the need for a larger exploration of the use of cardiac complexity
measures as a predictor for depression. If validated by future studies, patients who are planning on tapering their antidepressant medication may assess their ECG at home to assist
decision-making [62]. Furthermore, we suggest including the IBI complexity measures used in this study in other models which predict the recurrence of depression [63, 64]. While this study
finds that complexity measures are lower in individuals who experience a recurrence of depressive symptoms, the results do not indicate whether this is true in individuals who experience a
depressive episode for the first time, or in individuals who are not tapering antidepressant medication. We recommend exploring the variation of complexity of cardiac dynamics prior to
transitions towards depression in other samples, where these drawbacks may not exist. In conclusion, this study suggests that quantifiers of complexity of cardiac dynamics can serve as an
indicator for future recurrence of depressive transitions. While the study failed to find any trends in these quantifiers preceding depressive symptom transitions, it suggests a strong
possibility of using complexity-based quantifiers to identify individuals at risk for recurrence of depression [65]. Though many challenges remain to be solved before a clinical
implementation is feasible, we believe that these indicators can greatly aid in decision-making in the context of tapering antidepressants. REFERENCES * Borges S, Chen YF, Laughren TP,
Temple R, Patel HD, David PA, et al. Review of maintenance trials for major depressive disorder: a 25-year perspective from the US Food and Drug Administration. J Clin Psychiatry.
2014;75:205–14. Article PubMed Google Scholar * Geddes JR, Carney SM, Davies C. Relapse prevention in antidepressant drug treatment in depressive disorders: a systematic review. Lancet.
2003;361:653–61. * Glue P, Donovan MR, Kolluri S, Emir B. Meta-analysis of relapse prevention antidepressant trials in depressive disorders. Aus N Z J Psychiatry. 2010;44:697–705. * Sim K,
Lau WK, Sim J, Sum MY, Baldessarini RJ. Prevention of relapse and recurrence in adults with major depressive disorder: systematic review and meta-analyses of controlled trials. Int J
Neuropsychopharmacol. 2016;19:pyv076. * Scheffer M, Bascompte J, Brock WA, Brovkin V, Carpenter SR, Dakos V, et al. Early-warning signals for critical transitions. Nature. 2009;461:53–9. *
Wichers M, Smit AC, Snippe E. Early warning signals based on momentary affect dynamics can expose nearby transitions in depression: a confirmatory single-subject time-series study. J Pers
Oriented Res. 2020;6:1. * Wichers M, Groot PC, Psychosystems ESM, Group EWS, et al. Critical slowing down as a personalized early warning signal for depression. Psychother Psychosom.
2016;85:114–6. Article PubMed Google Scholar * van de Leemput IA, Wichers M, Cramer AOJ, Borsboom D, Tuerlinckx F, Kuppens P, et al. Critical slowing down as early warning for the onset
and termination of depression. Proc Natl Acad Sci USA. 2014;111:87–92. * Carney RM, Freedland KE, Veith RC. Depression, the autonomic nervous system, and coronary heart disease.
Psychosomatic Med. 2005;67:S29–33. * Schiweck C, Piette D, Berckmans D, Claes S, Vrieze E. Heart rate and high frequency heart rate variability during stress as biomarker for clinical
depression. A systematic review. Psychological Med. 2019;49:200–11. * Kemp AH, Quintana DS, Gray MA, Felmingham KL, Brown K, Gatt JM. Impact of depression and antidepressant treatment on
heart rate variability: a review and meta-analysis. Biol Psychiatry. 2010;67:1067–74. * Glass L. Using mathematics to diagnose, cure, and predict cardiac arrhythmia. Chaos. 2020;30:113132. *
Hausdorff JM, Mitchell SL, Firtion R, Peng CK, Cudkowicz ME, Wei JY, et al. Altered fractal dynamics of gait: reduced stride-interval correlations with aging and Huntington’s disease. J
Appl Physiol. 1997;82. * Goldberger AL, Amaral LAN, Hausdorff JM, Ivanov PC, Peng CK, Stanley HE. Fractal dynamics in physiology: alterations with disease and aging. Proc Natl Acad Sci USA.
2002;99:2466–72. * Nahshoni E, Aravot D, Aizenberg D, Sigler M, Zalsman G, Strasberg B, et al. Heart rate variability in patients with major depression. Psychosomatics. 2004;45:129–34. *
Yeragani VK, Rao KARK, Smitha MR, Pohl RB, Balon R, Srinivasan K. Chaos of heart rate time series in patients with major depression. Biol Psychiatry. 2002;51:733–44. Article PubMed Google
Scholar * Leistedt SJJ, Linkowski P, Lanquart JP, Mietus JE, Davis RB, Goldberger AL, et al. Decreased neuroautonomic complexity in men during an acute major depressive episode: analysis of
heart rate dynamics. Transl Psychiatry. 2011;1:e27. * Shekatkar SM, Kotriwar Y, Harikrishnan KP, Ambika G. Detecting abnormality in heart dynamics from multifractal analysis of ECG signals.
Sci Rep. 2017;7:15127. * Hognon L, Heraud N, Varray A, Torre K. Adaptive capacities and complexity of heart rate variability in patients with chronic obstructive pulmonary disease
throughout pulmonary rehabilitation. Front Physiol. 2021;12:669722. * Javorka M, Trunkvalterova Z, Tonhajzerova I, Javorkova J, Javorka K, Baumert M. Short-term heart rate complexity is
reduced in patients with type 1 diabetes mellitus. Clin Neurophysiol. 2008;119:1071–81. * Perkiömäki JS, Mäkikallio TH, Huikuri HV. Fractal and complexity measures of heart rate variability.
Clin Exp Hypertens. 2005;27:149–58. * Zbilut JP, Thomasson N, Webber CL. Recurrence quantification analysis as a tool for nonlinear exploration of nonstationary cardiac signals. Med Eng
Phys. 2002;24:53–60. * Greco A, Benvenuti SM, Gentili C, Palomba D, Scilingo EP, Valenza G. Assessment of linear and nonlinear/complex heartbeat dynamics in subclinical depression
(dysphoria). Physiol Meas. 2018;39:034004. * Noordam R, van den Berg ME, Niemeijer MN, Aarts N, Hofman A, Tiemeier H, et al. Antidepressants and heart-rate variability in older adults: a
population-based study. Psychol Med. 2016;46:1239–47. * Licht CMM, de Geus EJC, Zitman FG, Hoogendijk WJG, van Dyck R, Penninx BWJH. Association between major depressive disorder and heart
rate variability in the Netherlands study of depression and anxiety (NESDA). Arch Gen Psychiatry. 2008;65:1358–67. * Licht CMM, Penninx BW, de Geus EJC. To include or not to include? A
response to the meta-analysis of heart rate variability and depression. Biol Psychiatry. 2011;69:e1. * Helmich MA, Wichers M, Peeters F, Snippe E. Daily dynamics of negative affect:
indicators of rate of response to treatment and remission from depression? Cogn Emotion. 2022;36:1594–1604. Article Google Scholar * Smit AC, Snippe E, Kunkels Y, Riese H, Helmich M,
Wichers M. Transitions in depression (TRANS-ID) tapering. OSF. 2020; https://osf.io/h75p9/. * George SV, Kunkels YK, Smit AC, Booij SH, Wichers M, Riese H. Variation in complexity of
activity patterns prior to transitions in depression. OSF. 2021; https://osf.io/4mzqf/. * Kunkels YK, Smit AC, Minaeva O, Snippe E, George SV, van Roon AM, et al. Risk Ahead:
actigraphy-based early-warning signals of increases in depressive symptoms during antidepressant discontinuation. Clinical. Psychol Sci. 2023;0:1–12. Google Scholar * Smit AC, Snippe E,
Wichers M. Increasing restlessness signals impending increase in depressive symptoms more than 2 months before it happens in individual patients. Psychother Psychosomatics. 2019;88:249–51. *
Henriques T, Ribeiro M, Teixeira A, Castro L, Antunes L, Costa-Santos C. Nonlinear methods most applied to heart-rate time series: a review. Entropy. 2020;22:309. * Hasselman F. When the
blind curve is finite: dimension estimation and model inference based on empirical waveforms. Front Physiol. 2013;4:75. * Higuchi T. Approach to an irregular time series on the basis of the
fractal theory. Physica D. 1988;31:277–83. * Smit AC, Snippe E, Bringmann LF, Hoenders HJR, Wichers M. Transitions in depression: if, how, and when depressive symptoms return during and
after discontinuing antidepressants. Quality Life Res. 2022;32:1295–1306. Article Google Scholar * Garner DM, de Souza NM, Vanderlei LCM. Heart rate variability analysis: Higuchi and
Katz’s fractal dimensions in subjects with type 1 diabetes mellitus. Rom J Diabetes Nutr Metab Dis. 2018;25:289–95. * Ho YL, Lin C, Lin YH, Lo MT. The prognostic value of non-linear analysis
of heart rate variability in patients with congestive heart failure-a pilot study of multiscale entropy. PLoS ONE. 2011;6:e18699. * Norris PR, Anderson SM, Jenkins JM, Williams AE, Morris
JA. Heart rate multiscale entropy at three hours predicts hospital mortality in 3,154 trauma patients. Shock. 2008;30:17–22. * Johnston BW, Barrett-Jolley R, Krige A, Welters ID. Heart rate
variability: measurement and emerging use in critical care medicine. J Intensive Care Soc. 2020;21:148–57. * Ruelle, D. The Claude Bernard Lecture, 1989. Deterministic chaos: the science and
the fiction. Proc Royal Soc Lond A Math Phys Sci. 1990;427:241–8. * Makowski D, Pham T, Lau ZJ, Brammer JC, Lespinasse F, Pham H, et al. NeuroKit2: a Python toolbox for neurophysiological
signal processing. Behav Res Methods. 2021;53:1689–96. Article PubMed Google Scholar * Kojima H. hfda 0.1.1 [Internet]. 2019 [cited 2022 Mar 29]. https://pypi.org/project/hfda/. * Smit A.
The prologue to depression: a tale about complex dynamics and simple trends. [Thesis fully internal (DIV), University of Groningen]. University of Groningen, 2022. * Nachar N. The
Mann-Whitney U: a test for assessing whether two independent samples come from the same distribution. Tutor Quant Methods Psychol. 2008;4:13–20. * Pinna GD, Maestri R, Torunski A,
Danilowicz-Szymanowicz L, Szwoch M, la Rovere MT, et al. Heart rate variability measures: a fresh look at reliability. Clin Sci. 2007;113:131–40. * Cohen J. Statistical Power Analysis for
the Behavioral Sciences (2nd ed.). Routledge. 1998. https://doi.org/10.4324/9780203771587. * R Core Team (2020). R: a language and environment for statistical computing. Vienna, Austria: R
Foundation for Statistical Computing; 2020. * Theiler J, Eubank S, Longtin A, Galdrikian B, Farmer JD. Testing for nonlinearity in time series: the method of surrogate data. Phys D.
1992;58:77–94. Article Google Scholar * Schreiber T, Schmitz A. Improved surrogate data for nonlinearity tests. Phys Rev Lett. 1996;77:635–8. * Virtanen P, Gommers R, Oliphant TE,
Haberland M, Reddy T, Cournapeau D, et al. SciPy 1.0: fundamental algorithms for scientific computing in Python. Nat Methods. 2020;17:261–72. * Harikrishnan KP, Misra R, Ambika G. Combined
use of correlation dimension and entropy as discriminating measures for time series analysis. Commun Nonlinear Sci Numer Simul. 2009;14:3608–14. https://doi.org/10.1016/j.cnsns.2009.01.021.
Article Google Scholar * Costa M, Goldberger AL, Peng CK. Multiscale entropy analysis of complex physiologic time series. Phys Rev Lett. 2002;89:068102. * Guzman-Vargas L, Calleja-Quevedo
E, Angulo-Brown F. Fractal changes in heart rate dynamics with aging and heart failure. Fluct Noise Lett. 2003;03:L83–9. * Maestri R, Pinna GD, Porta A, Balocchi R, Sassi R, Signorini MG, et
al. Assessing nonlinear properties of heart rate variability from short-term recordings: Are these measurements reliable? Physiol Meas. 2007;28:1067. * Schulz S, Koschke M, Bär KJ, Voss A.
The altered complexity of cardiovascular regulation in depressed patients. Physiol Meas. 2010;31:303. * Servaas MN, Schoevers RA, Bringmann LF, van Tol MJ, Riese H. Trapped: rigidity in
psychiatric disorders. Lancet Psychiatry. 2021;8:1022–4. * Agelink MW, Boz C, Ullrich H, Andrich J. Relationship between major depression and heart rate variability. Clinical consequences
and implications for antidepressive treatment. Psychiatry Res. 2002;113:139–49. * O’Regan C, Kenny RA, Cronin H, Finucane C, Kearney PM. Antidepressants strongly influence the relationship
between depression and heart rate variability: findings from The Irish Longitudinal Study on Ageing (TILDA). Psychol Med. 2015;45:623–36. * Licht CMM, de Geus EJC, van Dyck R, Penninx BWJH.
Longitudinal evidence for unfavorable effects of antidepressants on heart rate variability. Biol Psychiatry. 2010;68:861–8. * Ikeda T. Current use and future needs of noninvasive ambulatory
electrocardiogram monitoring. Internal Med. 2021;60:9–14. * Kunkels YK, van Roon AM, Wichers M, Riese H. Cross-instrument feasibility, validity, and reproducibility of wireless heart rate
monitors: novel opportunities for extended daily life monitoring. Psychophysiology. 2021;58:e13898. * Bentley KH, Kleiman EM, Elliott G, Huffman JC, Nock MK. Real-time monitoring technology
in single-case experimental design research: opportunities and challenges. Behav Res Ther. 2019;117:87–96. * Moriarty AS, Meader N, Snell KIE, Riley RD, Paton LW, Dawson S, et al. Predicting
relapse or recurrence of depression: systematic review of prognostic models. Br J Psychiatry. 2022;221:448–58. * Judd LL, Schettler PJ, Rush AJ. A brief clinical tool to estimate individual
patients’ risk of depressive relapse following remission: proof of concept. Am J Psychiatry. 2016;173:1140–6. * Herrman H, Patel V, Kieling C, Berk M, Buchweitz C, Cuijpers P, et al. Time
for united action on depression: a Lancet–World Psychiatric Association Commission. Lancet. 2022;399:957–1022. Article PubMed Google Scholar Download references ACKNOWLEDGEMENTS We would
like to thank GM Bloem, D Sloohof, G Arts, and E van den Kieboom for their work on (pre-)processing the physiological data. This project has received funding from the European Research
Council (ERC) under the European Union’s Horizon 2020 research and innovation program (ERC-CoG-2015; No. 681466 to M Wichers). The Cortrium monitors were kindly provided by the iLab of the
Department of Psychiatry of the University Medical Center Groningen (UMCG, http://www.ilab-psychiatry.nl). AUTHOR INFORMATION AUTHORS AND AFFILIATIONS * Department of Psychiatry,
Interdisciplinary Center Psychopathology and Emotion Regulation (ICPE), University of Groningen, University Medical Center Groningen, Groningen, The Netherlands Sandip V. George, Yoram K.
Kunkels, Arnout Smit, Marieke Wichers, Evelien Snippe & Harriëtte Riese * Department of Computer Science, University College London, London, UK Sandip V. George * Department of Vascular
Medicine, University of Groningen, University Medical Center Groningen, Groningen, The Netherlands Arie M. van Roon Authors * Sandip V. George View author publications You can also search
for this author inPubMed Google Scholar * Yoram K. Kunkels View author publications You can also search for this author inPubMed Google Scholar * Arnout Smit View author publications You can
also search for this author inPubMed Google Scholar * Marieke Wichers View author publications You can also search for this author inPubMed Google Scholar * Evelien Snippe View author
publications You can also search for this author inPubMed Google Scholar * Arie M. van Roon View author publications You can also search for this author inPubMed Google Scholar * Harriëtte
Riese View author publications You can also search for this author inPubMed Google Scholar CONTRIBUTIONS Conceptualization: SVG, YKK, MW, ES, AMvR, and HR. Data acquisition: YKK, AS, MW, ES,
AMvR, and HR. Formal analysis and investigation: SVG. Data curation: YKK, AMvR, and HR. Interpretation of the results: SVG, YKK, AS, ES, AMvR, and HR. Visualization: SVG. Supervision: AMvR
and HR. Funding acquisition: MW; writing (original draft): SVG. Writing (review and editing): SVG, YKK, AS, ES, AMvR, and HR. CORRESPONDING AUTHOR Correspondence to Sandip V. George. ETHICS
DECLARATIONS COMPETING INTERESTS The authors declare no competing interests. ADDITIONAL INFORMATION PUBLISHER’S NOTE Springer Nature remains neutral with regard to jurisdictional claims in
published maps and institutional affiliations. SUPPLEMENTARY INFORMATION 41398_2023_2474_MOESM1_ESM.DOCX Supplementary material: Using complexity of cardiac dynamics as a predictor of
recurrence of depression in individuals tapering their antidepressants use RIGHTS AND PERMISSIONS OPEN ACCESS This article is licensed under a Creative Commons Attribution 4.0 International
License, which permits use, sharing, adaptation, distribution and reproduction in any medium or format, as long as you give appropriate credit to the original author(s) and the source,
provide a link to the Creative Commons license, and indicate if changes were made. The images or other third party material in this article are included in the article’s Creative Commons
license, unless indicated otherwise in a credit line to the material. If material is not included in the article’s Creative Commons license and your intended use is not permitted by
statutory regulation or exceeds the permitted use, you will need to obtain permission directly from the copyright holder. To view a copy of this license, visit
http://creativecommons.org/licenses/by/4.0/. Reprints and permissions ABOUT THIS ARTICLE CITE THIS ARTICLE George, S.V., Kunkels, Y.K., Smit, A. _et al._ Predicting recurrence of depression
using cardiac complexity in individuals tapering antidepressants. _Transl Psychiatry_ 13, 182 (2023). https://doi.org/10.1038/s41398-023-02474-7 Download citation * Received: 30 August 2022
* Revised: 02 May 2023 * Accepted: 12 May 2023 * Published: 30 May 2023 * DOI: https://doi.org/10.1038/s41398-023-02474-7 SHARE THIS ARTICLE Anyone you share the following link with will be
able to read this content: Get shareable link Sorry, a shareable link is not currently available for this article. Copy to clipboard Provided by the Springer Nature SharedIt content-sharing
initiative