Play all audios:
ABSTRACT The replication and transfer of genomic material from a cell to its progeny are vital processes in all living systems. Here we visualize the process of chromosome replication in
widened _E. coli_ cells. Monitoring the replication of single chromosomes yields clear examples of replication bubbles that reveal that the two replisomes move independently from the origin
to the terminus of replication along each of the two arms of the circular chromosome, providing direct support for the so-called train-track model, and against a factory model for
replisomes. The origin of replication duplicates near midcell, initially splitting to random directions and subsequently towards the poles. The probability of successful segregation of
chromosomes significantly decreases with increasing cell width, indicating that chromosome confinement by the cell boundary is an important driver of DNA segregation. Our findings resolve
long standing questions in bacterial chromosome organization. SIMILAR CONTENT BEING VIEWED BY OTHERS THE _ESCHERICHIA COLI_ CHROMOSOME MOVES TO THE REPLISOME Article Open access 17 July 2024
MID-CELL MIGRATION OF THE CHROMOSOMAL TERMINUS IS COUPLED TO ORIGIN SEGREGATION IN _ESCHERICHIA COLI_ Article Open access 18 November 2023 CHROMOSOME ORGANIZATION SHAPES REPLISOME DYNAMICS
IN _CAULOBACTER CRESCENTUS_ Article Open access 24 April 2024 INTRODUCTION DNA replication is vital for the reproduction of all organisms and accordingly has been subject to intense
research. Despite numerous studies on model bacteria such as _Escherichia coli_ (_E. coli_), a debate persists on the intracellular organization and mobility of replisomes during DNA
replication. No active machinery has been identified to be responsible for the highly effective segregation of newly synthesized sister chromosomes, and the physical mechanisms at play have
remained incompletely understood. Replication in _E. coli_ initiates at a single genomic site called _oriC_, where two multi-protein complexes, called replisomes, are assembled. The
replisomes replicate the chromosomes bi-directionally away from _oriC_, and eventually, after duplicating the entire genome, meet again and terminate at specific Tus sites1,2 in the _ter_
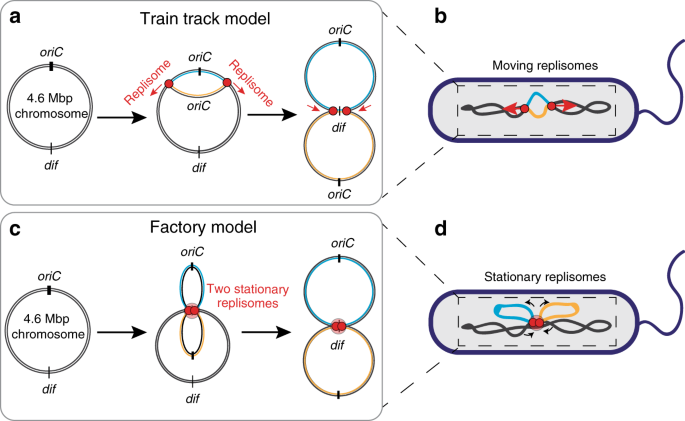
region3. Two conflicting models have been proposed for the organization and positioning of the replisomes inside the cell (Fig. 1). The so-called ‘factory model’4 predicts that both
replisomes are co-localized together at a joint position near cell center, where the maternal DNA is replicated into daughter replicates of the two chromosome arms. Consequently, the newly
duplicated DNA is being pushed out toward the cell poles, resulting in proper chromosome segregation. By contrast, the “train track model”5 predicts that the two replisomes move
independently along the chromosome arms as they carry out their function. In the latter case, the replisomes are not necessarily positioned jointly at midcell, but they could of course very
well still be observed there, especially near the start of the replication process where the two replisomes both start from _oriC_. Since the two replisomes would move independently, the
train track model would require a separate mechanism to spatially drive chromosome segregation. Various groups have used fluorescent microscopy techniques to study DNA replication and
segregation in bacterial cells. Reyes-Lamothe et al.6 observed replisome activity at different positions in the opposing cell halves throughout different stages of the _E. coli_ cell cycle,
thus arguing against the factory model with joint replisomes at a stationary site. However, in a more recent study, very different results were reported by Mangiameli et al.7, again based on
fluorescently labelled replisomes in rod-shaped _E. coli_. Here, functional replisomes were observed to form a single focus proximal to the cell center throughout a major part of the cell
cycle, suggesting the formation of a replisome factory. Another major difference in literature possibly accounting for the conflicting replication models is the use of various _E. coli_
strains and various growth conditions. Cass et al.8 observed fluorescently labeled chromosomal loci to move toward midcell before segregation in MG1655 _E. coli_ cells with doubling times
<1 h. As segregation initiated, the dynamics of loci were universal and independent of genetic position, consistent with a factory model. It is known that the finer details of chromosome
morphology is different between the MG1655 and AB1157 strains9, while the short replication time also has an influence on the chromosome organization10,11. While the debate on the mobility
of the replisomes proceeds, it is furthermore unclear whether and how the replisomes are involved in chromosome segregation, which occurs simultaneously with the replication. Various models
were proposed to explain the segregation process. _E. coli_ bacteria show an initial rapid separation of the newly synthesized origins of replication12, similar to what happens in _Vibrio
cholerae_13 where the segregation is driven by the _ParABS_ segregation system. Yet, no such active protein system has been found in _E. coli_. It has been debated whether cell wall
confinement may play a role in the process of segregation. Early experiments14 in spherical _E. coli_ cells (lacking MreB filaments that maintain the rod-shape of the cell) indicated that
the rod-shape was not essential for proper chromosome segregation. Based on polymer simulations, Jun and Mulder15, however, proposed an entropy-driven segregation model, in which internal
repulsive entropic forces act on chromosomes to spontaneously demix them in rod shape cells, as the demixed polymer state is thermodynamically favored over the mixed one. Youngren et al.10
strengthened the idea that entropy demixing may play a role with experiments on fast-growing _E. coli_ that showed that, throughout segregation, chromosomes spatially self-organize as
branched-ring-polymers under rod-shape confinement, where minimization of the chromosome free energy can gradually drive newly synthesized sister chromosomes away from each other to opposing
cell halves and consequently push non-replicated DNA toward midcell. In this picture, replisome positioning near midcell may result from the segregation process, rather than be its cause.
Other groups have argued that mechanical strain rather than entropic forces are driving the chromosomal segregation16,17. Important questions on DNA replication thus remain unresolved, most
importantly whether replisomes are separate and mobile or joint and static relative to the nucleoid, and what drives chromosomal segregation. There are various reasons why the answers to
these questions varied in the studies reported so far. The aforementioned replisome visualization approaches differed in the types of fluorophores used, as well as in which components of the
replisomes were tagged. In population-based assays, additional uncertainties arose when determining the protein positions due to their variability at various stages of cell cycle. For
example, it is challenging to distinguish foci from newly initiated rounds of replication from single foci from ongoing rounds. Yet another technical challenge is the resolvability of
independent replisomes due to optical resolution limits and the very compact state of the nucleoid in rod-shaped _E. coli_. Here, we overcome these technical limitations by visualizing the
process of replication of an individual chromosome in _E. coli_ cells with an increased length or width. We achieve this by modifying the shape of cells using low concentrations of cell-wall
attacking antibiotics, and by using a temperature-sensitive dnaC allele to generate cells with initially only one chromosome. In these temperature-sensitive (dnaCts) cells, DnaC protein is
inactive above 40 °C, and, since DnaC protein is vital for loading the helicase (DnaB) onto the origin of replication18, cells cannot initiate a new round of replication, while they will
finish already initiated rounds. This enables us to synchronously initiate a single round of replication and eliminate the uncertainty whether observed foci in a single cell are from
temporally overlapping replication rounds. Cells can maintain a single chromosome, elongate, and reach longer sizes compared to normal rod-shaped cells (Supplementary Fig. 1), with
accordingly larger nucleoid sizes19, overcoming the diffraction limit to resolve separate foci. We use well-established monomeric fluorophores that avoid the problem that replisome
co-localization may result due to attracting forces between fluorescent tags. By initiating a single round of replication in the cells and tracking the number of replisome foci, we can
determine whether the replisomes move independently or remain co-localized. This allows us to directly visualize the separation of two single replisome foci after replication initiation. We
find that replisomes move away from each other, clearly moving along the nucleoid arms as they replicate the DNA. Furthermore, we, interestingly, observe that the cell’s capacity to
successfully segregate the replicated chromosomes towards daughter cells strongly depends on the cell width, indicating that entropic repulsion plays a role in DNA segregation. RESULTS
REPLISOMES LOAD NEAR THE MIDCELL AND MOVE AWAY FROM EACH OTHER To trace the position of the replisomes, we monitor a fluorophore-labelled key component of it, viz., the β-clamp (DnaN), which
serves as a marker for the location of the replication fork20. The factory and train-track models predict clearly different results for the number and position of the replisome foci
relative to the nucleoid (Fig. 1). According to the factory model, we would expect only a single replisome focus near midcell that is stationary throughout replication (Fig. 1c, d). By
contrast, the train-track model predicts an initially formed single focus that separates into two foci with a twice lower fluorescent intensity, that gradually move away from each other and
away from the midcell (Fig. 1a, b). We performed experiments with temperature-sensitive (dnaCts) _E.coli_ cells where both the β-clamps and the chromosome were fluorescently labelled (see
MM). At permissive temperatures (40 °C), dnaCts cells maintain a single chromosome while growing longer in contour length (Supplementary Fig. 1, Supplementary movie 1). By placing these
cells for a short time period (~10 min) at room temperature and then back to 40 °C, we could synchronously re-initiate replication in ~85% of all cells (Fig. 2, Supplementary Fig. 2). As
seen in Fig. 2a–c, cells placed at 40 °C maintained a single chromosome positioned at the center of the cell, as previously observed19. The intensity of the nucleoids was not homogeneous but
showed a remarkable heterogeneity with a pronounced periodic-like structure, as reported by Fisher et al.17. High-DNA intensity regions were observed to occur semi-periodically along the
nucleoid (Fig. 2d), where the number of the maxima was proportional to the length of the nucleoid. From the autocorrelation between the peaks, we estimate a periodicity of the undulation of
0.73 ± 0.15 μm (error bar denotes standard deviation (s.d.); _N_ = 30, Fig. 2e). This observed periodicity of the nucleoids is nontrivial, especially given that the period appears to be
independent of nucleoid length. Polymer modelling of chromosomes may elucidate this and it may be of interest to study whether this periodicity systematically varies as a function of cell
length or cell cycle, opening up new possibilities for future experiments. Note that the average cell length as well as the nucleoid length at the point of initiation of replication are
significantly expanded in these elongated cells at 40 °C (Fig. 2f, g). The average cell length and nucleoid length at 40 °C were 7.7 ± 0.2 and 3.3 ± 0.1 µm, respectively, (errors are
s.e.m.), and 4.7 ± 0.05 µm and 2.6 ± 0.05 µm (± s.e.m.), respectively, for cells grown at 30 °C. At both temperatures, we found a linear dependence between the nucleoid length and the cell
contour length, similar to other studies19,21 (Fig. 2h, which was universal and not dependent on the strain type of _E.coli_ used, nor of the labelling of the replisomes, Supplementary Fig.
3). Note that earlier work by our group showed that the size of individual nucleoids in elongated non-replicating cells reaches a saturation point for cells larger than ~15 µm,19 but here we
do not reach this saturation regime since the cells in our experiments were replicating and were shorter in length. After this initial characterization of the nucleoids, we monitored the
positioning of replisome foci relative to the nucleoid and cell contour. After initiating a single replication round, a single replisome focus was observed to form in the middle of the
chromosomes, with a deviation from the cell center of, on average, 0.45 µm, which is ~5% of the average cell length (Fig. 2i, j). Shortly thereafter, i.e., in less than 15 minutes of
initiation (which is 12% of the cell cycle time of 124 minutes in these conditions), the focus was seen to split into two foci in more than 70% of all cells (_N_ = 147), each with an almost
twice lower fluorescent intensity (2.3 ± 0.2 lower intensity, ±s.d., _N_ = 20) (Fig. 2i, j, Supplementary movie 2). The splitting of the replisome foci was observed to occur independent of
the number of chromosomes (Supplementary Fig. 4) and independent of temperature (as it was also observed in cells grown at 37 °C, Supplementary Fig. 5). After >30 minutes of replication
initiation, the number of cells with two foci gradually started to decrease (Supplementary Fig. 6), indicating that the fluorophores gradually bleached (Supplementary Fig. 7) and/or the
replisomes disassembled after finishing the replication. These observations directly conform to the train track model, where the replisomes first assembled at oriC, showing only one focus at
replication initiation since their inter-distance was not resolved due to the diffraction limit, whereupon two foci became visible as the replisomes spatially separated, each replicating
the material of an opposing chromosome arm in a different half of the cell length. After completing their function, the replisomes moved back towards each other (which was observed in ~25%
of all replicating cells (_N_ = 84), whereas the rest bleached during the measurement or had no or multiple replication bubbles) and after finishing the replication (Fig. 2k) disassembled,
reducing the observed number of foci per cell at replication termination. INDEPENDENTLY MOVING REPLISOMES FORM A REPLICATION BUBBLE To visualize the replication bubble, we used the same
dnaCts cells with the labelled DNA and replisome, but now added the MreB-inhibiting drug A22. Since MreB is essential for maintaining the rod shape of _E.coli_ cells22, the addition of A22
(which inhibits the MreB polymerisation) results in cells that are significantly wider than normal rod-shaped cells14,23,25. Our earlier work showed that cells treated with A22 stay
physiologically healthy and active, while the single nucleoid adopts a toroidal configuration within the larger available cell volume25. Importantly, these cells allow to follow the dynamics
of the replisomes and the nucleoid upon re-initiating replication. To verify whether the replisomes indeed move along the chromosomal arms, we thus expanded the cells with the A22 drug and
visualized the replication as it started within the toroidal-shaped nucleoid. In about 80% of all replicating cells (_N_ = 167), we could once again clearly observe a single replisome focus
near the center of the cell, that quickly split into two lower intensity foci that had a 1.9 ± 0.2 lower intensity (±s.d. _N_ = 30, Supplementary Fig. 8). The foci moved away from each other
along the nucleoid arms while replicating the DNA. Interestingly, we observed that the position of the replisomes was closely associated with regions of higher DNA intensity: As the
replisomes moved along the circular nucleoid, the high-intensity DNA regions also moved with them (Fig. 3b). From analyzing the correlation between the foci position and the clusters size
(see M&M), we found that the single replisome foci (after splitting) were typically near DNA domains that contained up to 20% of the whole chromosome signal. These clusters contained on
average twice more DNA than any random DNA cluster (Supplementary Fig. 9). These high-intensity regions represent spots where replisomes are actively duplicating new chromosome material and
our experiments allowed us to track the process of DNA replication in real-time. Interestingly, the data revealed an extended period where the newly replicated DNA stayed cohesed to the
mother DNA before genuinely separating into a replication bubble. In other words, we observed that the sister nucleoids did not mutually segregate into two separate strands immediately after
the initiation of DNA replication, but instead they stayed mutually cohesed along their length for some time (Fig. 3b, panel II and III). This in line with some earlier observations in
rod-shaped cells12,17,26. This period of mutual cohesion of the replicated DNA was typically ~15 min. It was followed by a quick segregation of sister chromosomes, leading to the
visualization of a clearly opened replication bubble as shown in Fig. 3b panel IV. Despite having an increased cell size and a single nucleoid, the cells were capable of fully replicating
the DNA and finishing the replication cycle, as seen in Fig. 3e, f. During replication, the nucleoids underwent large structural rearrangements, evolving from a toroid to a split toroid, to
a figure-8 shape, to finally two separated toroidal-shaped nucleoids in daughter cells. The widened cells thus could still replicate and segregate the DNA and fully divide the mother to
daughter cells, showing that the MreB filaments and the associated rod shape of cells were neither necessary for proper cell division nor for chromosome segregation14. Summing up, the
widening the _E. coli_ cells allowed to visualize the structural evolution of the nucleoid during replication at a level of detail that was inaccessible to earlier studies. We observed that,
rather than pulling the DNA through a joint factory, the replisomes function independently and move along the chromosome arms while replicating the DNA (Fig. 3f, replisomes moved back
towards each other in ~33% of all replicating cells; _N_ = 160). The replicated DNA stayed cohesed to the mother DNA for ~15 min, after which a replication bubble opened and the replication
proceeded until a figure 8 and finally two separate daughter chromosomes were formed. CHROMOSOME SEGREGATION DEPENDS ON THE LATERAL CELL WALL CONFINEMENT To better understand the nucleoid
rearrangements, in particular the segregation of chromosomes, in the replication process during the cell cycle, we imaged an _E.coli_ strain with a HU-mYpet labelled chromosome and ori1 and
ter3 FROS arrays25 with widefield and SIM microscopy (Fig. 4; Supplementary Movies 3 and 4; Supplementary Fig. 10). Consistent with the experiments described above, about half of all
replications (48% out of _N_ = 453) displayed replication bubbles and figure-8 shapes, again confirming the train-track model for replisomes (Fig. 4b–d). We found that the Left-Ori-Right
orientation of chromosomes that was reported earlier in rod-shaped _E. coli_ cells21,22,23,24 was preserved in these widened cell too. We observed the origin of replication of single
nucleoids to duplicate near the midcell location (Fig. 4e), but this positioning was not necessary for replication initiation, as cells with two chromosomes could also duplicate their
origins distal from the midcell position (Supplementary Fig. 11). In contrast to earlier studies10,27,28,29,30, we observed that shortly after splitting, the Ori foci moved into a random
direction (Fig. 4f), towards a region within the cell cytosol that was not yet occupied by the nucleoid. This is a nontrivial finding, as previous studies suggested a fine-tuned mechanism
that would drive the replicated ori’s to move towards the cell poles30. In very wide cells, the two replicated Ori’s could initially even orient along the short axis of the cell whereas only
after some time, as the amount of replicated DNA locally increased, they would re-orient towards the long axis and the cell poles (Supplementary Fig. 12). This observation suggests a
possible role for the spatial confinement of the cell wall in orienting the newly replicated nucleoids towards the cell poles. When monitoring large cells during several hours of
replication, we observed that they encountered difficulties in segregating their chromosomes (Fig. 4g and Supplementary Fig. 13). Quantitatively, a threefold increase in the cell area (from
1.8 µm2 to 5.2 µm2, _N_ = 371) at the moment of replication initiation decreased the probability of successful replication more than twofold (Fig. 4g). Interestingly, increasing the number
of chromosomes in larger cells (by keeping the cells longer at room temperature), compensated for the loss of cell wall confinement and chromosomes did segregate properly (Supplementary Fig.
14), similar to observations in earlier studies14,23. In rod-shaped cells grown at 30 °C, unsurprisingly, almost all cells (_N_ = 139) successfully segregated their chromosomes (mean cell
area 2.0 ± 0.6 µm2; error is s.e.m.). These data also indicate that the confinement exerted by the cell wall directs the sister chromosome segregation in _E. coli_ cells. Shortly after the
Ori foci splitting (typically around 15–20 min after replication initiation), the Ter foci moved towards the midcell location and stably positioned there for long periods of time (Fig. 4h,
Supplementary movie 4). That the Ter foci position typically coincided with the midcell location suggests a spatiotemporal correlation between Ter and the divisome components31. Once the Ter
focus duplicated, the foci quickly moved towards the respective cell halves enabling the septum to finish division of the cells and form two daughter cells (Fig. 4h). After division, both
chromosomes recovered the toroidal topology, consistent with the notion that it is the physiologically active form of the _E. coli_ chromosome25. As expected, inhibiting the supercoiling
homeostasis32 by perturbed the activity of TopoIV33 and gyrases34 upon administering Novobiocin drug reduced the capability of replicated chromosomes to timely separate35 with up to 30% of
cells (_N_ = 340) ending up with cohesed chromosomes that were seen to get stuck at the division septum (Supplementary Figs. 15 and 16). Our data thus show that the cell wall confinement
acting on the chromosomes is important for the segregation of daughter chromosomes and that there is a fine-tuned temporal correlation between the DNA replication and cell division.
DISCUSSION The process of DNA replication and its consecutive transfer from the mother cell to its progeny is one of the most intriguing processes in all living organisms. Surprisingly, even
for the best studied organism, such as the _E.coli_ bacterium, there is currently no unified view on the spatiotemporal control of DNA replication and segregation. Here, we addressed this
by monitoring the replication and segregating of single chromosome in shape-modified cells. The use of a temperature-sensitive strain was advantageous for two reasons: first, it enabled us
to synchronously initiate a single round of replication across the population of cells, and second, the nucleoids in these cells were elongated and thus permitted a higher spatial resolution
(Fig. 2). Most importantly, we observed separate replisomes that independently moved from the origin to the terminus of replication along each of the two arms of the circular chromosome
(Fig. 2k). We could visualize and study “text-book examples” of replication bubbles that provide direct evidence for the train track model describing the replication. Some early studies on
rod-shaped cells reported a single replisome focus near the midcell position pointing instead toward the factory model of DNA replication. We believe that the authors of these studies
observed a single replisome focus because the nucleoids were highly confined which prevented the replisomes from moving further apart than the optical diffraction limit (~200 nm). Indeed,
while in more recent work Mangiameli et al.7 observed a single replication focus in ~80% of all cells, they, interestingly, also observed ~20% of foci to split into two foci for short
periods of time, hinting that the replisomes could possibly spatially separate. Our experiments extend these studies and provide increased resolution to resolve that the factory model can be
rigorously ruled out. A second major finding from our results is that chromosome segregation in slowly growing _E. coli_ cells is found to be directed by the cell width. In rod-shaped
cells, we saw that the cells did segregate the chromosomes properly for a variety of cell sizes. Upon using the A22 drug to widen the cells with single chromosomes, however, the segregation
process partially impaired. After replication initiation at OriC, newly synthesized DNA mass started to build up until the emerging two daughter chromosomes started to detach from each
other, to, from there on, quickly segregate to form a replication bubble. The movement of the newly replicated DNA appeared to be driven by redistribution of DNA mass from strongly confined
towards less confined space, which explains the initially random movement of the Ori’s towards the available free space in the widened cells (Fig. 4f). When running into the confining cell
boundary along the short axis, the segregating DNA material was re-distributed toward unoccupied space which was mainly available towards the cell poles (Supplementary Fig. 12). This also
explains the observation that larger cells with single chromosomes had trouble segregating their chromosomes to the daughter cells (Fig. 4g, Supplementary Fig. 13). Interestingly, similar
results were observed by the lab of Jeff Errington and colleagues in cell wall deficient (l-form) _Bacillus subtilis_ cells, where forcing cells into narrow microfluidics channels increased
the efficiency of successful chromosome segregation36. Our experimental data are supportive of the theoretical model by Jun and Mulder that predicted that entropy can be the driver for
sister chromosome segregation15 given a particular (rod-shape) confinement for given DNA concentrations37. Indeed, we observed that increasing the DNA amount inside a given confinement (by
initiating multiple replication rounds in widened cells; Supplementary Fig. 14), one would recover a proper segregation of the chromosomes to the daughter cells. Taken together, our results
show that DNA replication in _E.coli_ proceeds as predicted by the train track model of independently moving replisomes and that cell wall confinement plays an important role in segregating
the nucleoids. METHODS STRAIN CONSTRUCTION All strains are derivatives of _E. coli_ K12 AB1157 strain and were constructed by P1 transduction38. To construct strain AJ2818 (_dnaN- mCherry,
hupA- mYPet:: frt, dnaC2 (ts):: aph frt_), mCherry–dnaN strain39, a kind gift from Nynke Dekker, was transduced with P1 phage derived from strain FW155140 (_hupA-mYPet::aph frt)_ for
endogenous HU labelling. The resulting strain was cured of antibiotic resistance by flippase expressed from pCP2041. Then the strain was transduced with P1 phage FW195718 (_dnaC2(ts)
ΔmdoB::aph:: frt_) to result in a DnaC temperature sensitivity. The final strain was selected for kanamycin resistance and temperature sensitivity and was subsequently cured of antibiotic
resistance by flippase. For experiments with Ori1/Ter3 labels, strain FW2179 (_ori1:: lacOx240::hygR, ter3::tetOx240::accC1 ΔgalK::tetR-mCerulean:: frt, ΔleuB::lacI-mCherry:: frt, hupA-
mYPet:: frt, dnaC2 (ts):: aph frt_)25, was used. To generate MG1655 dnaCts and AB1157 dnaCts strains described in Supplementary Fig. 3, we first transduced the wildtype strains with
_hupA-mYPet::aph_ from FW1551, then cured of kanamycin resistance using pCP20, and further transduced with _dnaC2 ΔmdoB::aph frt_ from FW195725. GROWTH CONDITIONS For experiments with linear
cells, we grew cells in liquid M9 minimum medium (Fluka Analytical) supplemented with 2 mM MgSO4, 0.1 mM CaCl2, 0.4% glycerol (Sigma-Aldrich), and 0.1% protein hydrolysate amicase (PHA)
(Fluka Analytical) overnight at 30 °C to reach late exponential phase. On the day of the experiment, the overnight culture was refreshed (1:100 vol) for 2 h on fresh M9 medium at 30 °C. We
then pipetted 1 μl culture onto a cover glass and immediately covered the cells with a flat agarose pad, containing the above composition of M9 medium as well as 3% agarose. The cover glass
was then placed onto a baseplate and sealed with parafilm to prevent evaporation. The baseplate was placed onto the microscope inside a 40 °C incubator for 2 h to stop the cells from
replicating and to let them grow longer. To reinitiate DNA replication, the baseplate was moved to room-temperature for 10 min before placing it back onto the microscope inside the 40 °C
chamber for imaging. To obtain circular chromosomes, we used the same protocol as described above, with minor changes: We grew cells in liquid M9 minimum medium (Fluka Analytical)
supplemented with 2 mM MgSO4, 0.1 mM CaCl2, 0.4% glycerol (Sigma-Aldrich), and 0.01% PHA (Fluka Analytical) overnight at 30 °C to reach late exponential phase. On the day of the experiment,
the overnight culture was refreshed (1:100 vol) for 2 h on fresh M9 minimal medium at 30 °C. We then pipetted 1 μl culture onto a cover glass and immediately covered the cells with a flat
agarose pad, containing the above composition of M9 medium, A22 (final 3 μg/ml), as well as 3% agarose. The cover glass was then placed onto a baseplate and sealed with parafilm to prevent
evaporation. The baseplate was placed onto the microscope inside a 40 °C incubator for 2.5 h to stop the cells from replicating and to let them grow into round shapes. To reinitiate DNA
replication, the baseplate was moved to room-temperature for 10 min before placing it back onto the microscope (inside 40 °C chamber) for imaging. For treatment of replicating cells with
Novobiocin, we first grew the cells in the presence of A22 as described above for 2.5 h to ensure they reach desired size and shape. Then we moved the baseplate to room-temperature for 10
min and afterwards added 10 µl of Novobiocin (~50 µg/ml final) to the agarose pad during replication initiation phase. Finally the cells were moved back to 40 °C chamber and imaged.
STATISTICS AND REPRODUCIBILITY All samples were repeated at least in biological duplicates. Bacterial growth experiments in bulk. _E.coli_ cells were grown on a clear-bottom 96-well plate
(Nunc) with a final volume of 150 μl of the solution in each well. The plates were loaded into an Infinite 200Pro fluorescence plate reader (Tecan, Männedorf, Switzerland) and incubated at
30 °C in the presence of various concentrations of Novobiocin drug (25, 50, and 100 µg/ml). Samples were shaken with orbital agitation (2.5 mm amplitude) for a period of ~12 h. The cell
density was measured at 600 nm with 15 min intervals, measured in biological triplicates. FLUORESCENCE IMAGING Wide-field Z scans were carried out using a Nikon Ti-E microscope with a 100X
CFI Plan Apo Lambda Oil objective with an NA of 1.45. The microscope was enclosed by a custom-made chamber that was pre-heated overnight and kept at 40 °C. mCerulean was excited by SpectraX
LED (Lumencor) _λ_ex = 430-450 through a CFP filter cube (_λ_ex/_λ_bs/_λ_em = 426–446/455/460–500 nm). mYPet signal was excited by SpectraX LED _λ_ex = 510/25 nm through a triple bandpass
filter _λ_em = 465/25–545/30–630/60 nm. mCherry signals was excited by SpectraX LED _λ_ex = 575/25 through the same triple bandpass filter. Fluorescent signals were captured by Andor Zyla
USB3.0 CMOS Camera. For each channel, between 3 and 11 slices were taken with a vertical step size of 227 nm (in total up to 2.3 μm). Structured Illumination Microscopy imaging was carried
out using a Nikon Ti-E microscope and a SIM module. A 100X CFI Apo Oil objective with an NA of 1.49 was used. Samples were illuminated with 515 nm laser line and a Nikon YFP SIM filter cube.
mYPet, mCerulean, and mCherry signals of the same sample were also captured through wide-field imaging using a Nikon-Intensilight lamp. Filter cubes used for the wide-field imaging
corresponding to the SIM images were CFP filters (_λ_ex/_λ_bs/_λ_em = 426–446/455/460–500 nm), YFP filters (_λ_ex/_λ_bs/_λ_em = 490–510/515/520–550 nm), and RFP filters (_λ_ex/_λ_bs/_λ_em =
540-580 / 585 / 592–668). Up to 19 slices were taken with a vertical step size of 100 nm (in total 1.8 μm). SIM image reconstruction was done by using NIS-Elements (version 4.51) software.
During image reconstruction, special care was taken to use the recommended parameters to avoid reconstruction artefacts. Furthermore, care was taken to check for photo-bleaching during image
acquisition (which was negligible), to minimize drift during imaging, and to avoid artifactual signatures in the Fourier transforms of the reconstructed images42 (Supplementary Fig. 17).
DECONVOLUTION Image stacks of 3–19 slices of Z stack in wide-field imaging were deconvolved using the Huygens Professional deconvolution software (Scientific Volume Imaging, Hilversum, The
Netherlands), using an iterative Classic Maximum Likelihood Estimate (CMLE) algorithm with a point spread function (PSF) experimentally measured using 200 nm multicolor Tetrabeads
(Invitrogen). The PSF of the single-frame non-deconvolved widefield images had a FWHM of 350 nm horizontally and 800 nm vertically. Deconvolution, to a great extent, reduced the out-of-focus
noise in the images, which also led to an improvement in lateral resolution. REPORTING SUMMARY Further information on research design is available in the Nature Research Reporting Summary
linked to this article. DATA AVAILABILITY The source data underlying Fig. 2e, h are provided as a Source data file. The raw microscopy data supporting the findings of this manuscript (Figs.
2–4, and Supplementary Figs. 1, 2, 5, 6, 7, 10, 11, 13, 14, 16 and 17) are freely available for download from 4TU.ResearchData repository
[https://data.4tu.nl/repository/uuid:23de478d-8d08-4149-abd6-3398cbe14847]. All data is available from the authors upon reasonable request. Source data are provided with this paper.
REFERENCES * Kuempel, P. L., Pelletier, A. J. & Hill, T. M. Tus and the terminators: the arrest of replication in prokaryotes. _Cell_ 59, 581–583 (1989). Article CAS Google Scholar *
Moolman, M. C. et al. The progression of replication forks at natural replication barriers in live bacteria. _Nucleic Acids Res._ 44, 6262–6273 (2016). Article CAS Google Scholar *
Nagata, T. & Meselson, M. Periodic replication of DNA in steadily growing Escherichia coli: the localized origin of replication. _Cold Spring Harb. Symp. Quant. Biol._ 33, 553–557
(1968). Article CAS Google Scholar * Lemon, K. P. & Grossman, A. D. Localization of bacterial DNA polymerase: evidence for a factory model of replication. _Science_ 282, 1516–1519
(1998). Article CAS Google Scholar * Dingman, C. W. Bidirectional chromosome replication: some topological considerations. _J. Theor. Biol._ 43, 187–195 (1974). Article CAS Google
Scholar * Reyes-Lamothe, R., Possoz, C., Danilova, O. & Sherratt, D. J. Independent positioning and action of Escherichia coli replisomes in live cells. _Cell_ 133, 90–102 (2008).
Article CAS Google Scholar * Mangiameli, S. M., Veit, B. T., Merrikh, H. & Wiggins, P. A. The replisomes remain spatially proximal throughout the cell cycle in bacteria. _PLoS Genet._
13, 1–17 (2017). Article Google Scholar * Cass, J. A., Kuwada, N. J., Traxler, B. & Wiggins, P. A. Escherichia coli chromosomal loci segregate from midcell with universal dynamics.
_Biophys. J._ 110, 2597–2609 (2016). Article ADS CAS Google Scholar * Wiggins, P. A., Cheveralls, K. C., Martin, J. S., Lintner, R. & Kondev, J. Strong intranucleoid interactions
organize the Escherichia colichromosome into a nucleoid filament. _Proc. Natl Acad. Sci. USA_ 107, 4991–4995 (2010). Article ADS CAS Google Scholar * Youngren, B., Nielsen, H. J., Jun,
S. & Austin, S. The multifork Escherichia coli chromosome is a self-duplicating and self-segregating thermodynamic ring polymer. _Genes Dev._ 28, 71–84 (2014). Article CAS Google
Scholar * Nielsen, H. J., Youngren, B., Hansen, F. G. & Austin, S. Dynamics of Escherichia coli chromosome segregation during multifork replication. _J. Bacteriol._ 189, 8660–8666
(2007). Article CAS Google Scholar * Bates, D. & Kleckner, N. Chromosome and replisome dynamics in E. coli: Loss of sister cohesion triggers global chromosome movement and mediates
chromosome segregation. _Cell_ 121, 899–911 (2005). Article CAS Google Scholar * Fogel, M. A. & Waldor, M. K. A dynamic, mitotic-like mechanism for bacterial chromosome segregation.
_Genes Dev._ 20, 3269–3282 (2006). Article CAS Google Scholar * Wang, X. & Sherratt, D. J. Independent segregation of the two arms of the Escherichia coli ori region requires neither
RNA synthesis nor MreB dynamics. _J. Bacteriol._ 192, 6143–6153 (2010). Article CAS Google Scholar * Jun, S. & Mulder, B. Entropy-driven spatial organization of highly confined
polymers: Lessons for the bacterial chromosome. _Proc. Natl Acad. Sci. USA_. https://doi.org/10.1073/pnas.0605305103 (2006). * Kleckner, N. E., Chatzi, K., White, M. A., Fisher, J. K. &
Stouf, M. Coordination of growth, chromosome replication/segregation, and cell division in E. coli. _Front. Microbiol._ 9, 1469 (2018). Article Google Scholar * Fisher, J. K. et al.
Four-dimensional imaging of E. coli nucleoid organization and dynamics in living cells. _Cell_ 153, 882–895 (2013). Article CAS Google Scholar * Saifi, B. & Ferat, J. L. Replication
fork reactivation in a dnaC2 mutant at non-permissive temperature in escherichia coli. _PLoS ONE_. 7, e33613 (2012). * Wu, F. et al. Cell boundary confinement sets the size and position of
the E. coli chromosome. _Curr. Biol._ 29, 2131–2144.e4 (2019). Article CAS Google Scholar * Kelman, Z. DNA polymerase III holoenzyme: structure and function of a chromosomal replicating
machine. _Ann. Rev. Biochem._ 64 www.annualreviews.org (1995). * Gray, W. T. et al. Nucleoid size scaling and intracellular organization of translation across bacteria. _Cell_ 177,
1632–1648.e20 (2019). Article CAS Google Scholar * Wachi, M. et al. Mutant isolation and molecular cloning of mre genes, which determine cell shape, sensitivity to mecillinam, and amount
of penicillin-binding proteins in Escherichia coli. _J. Bacteriol_. 169 http://jb.asm.org/ (1987). * Karczmarek, A. et al. DNA and origin region segregation are not affected by the
transition from rod to sphere after inhibition of Escherichia coli MreB by A22. _Mol. Microbiol._ 65, 51–63 (2007). Article CAS Google Scholar * Woldringh, C. L., Hansen, F. G., Vischer,
N. O. E. & Atlung, T. Segregation of chromosome arms in growing and non-growing Escherichia coli cells. _Front. Microbiol_. 6, 448 (2015). * Wu, F. et al. Direct imaging of the circular
chromosome in a live bacterium. _Nat. Commun._ 10, 1–9 (2019). Article ADS Google Scholar * Sunako, Y., Onogi, T. & Hiraga, S. Sister chromosome cohesion of Escherichia coli. _Mol.
Microbiol_ 42, 1233–1241 (2001). Article CAS Google Scholar * Lau, I. F. et al. Spatial and temporal organization of replicating Escherichia coli chromosomes. _Mol. Microbiol_ 49, 731–743
(2003). Article CAS Google Scholar * Viollier, P. H. et al. Rapid and sequential movement of individual chromosomal loci to specific subcellular locations during bacterial DNA
replication. _Proc. Natl Acad. Sci. USA_ 101, 9257–9262 (2004). Article ADS CAS Google Scholar * Wang, X., Lesterlin, C., Reyes-Lamothe, R., Ball, G. & Sherratt, D. J. Replication
and segregation of an Escherichia coli chromosome with two replication origins. _Proc. Natl Acad. Sci. USA_ 108, E243–E250 (2011). Article ADS Google Scholar * Hofmann, A., Mäkelä, J.,
Sherratt, D. J., Heermann, D. & Murray, S. M. Self-organised segregation of bacterial chromosomal origins. _Elife_. 8, e46564 (2019). * Espéli, O. et al. A MatP-divisome interaction
coordinates chromosome segregation with cell division in E. coli. _EMBO J._ 31, 3198–3211 (2012). Article Google Scholar * Sobetzko, P., Travers, A. & Muskhelishvili, G. Gene order and
chromosome dynamics coordinate spatiotemporal gene expression during the bacterial growth cycle. _Proc. Natl Acad. Sci. USA_ 109, E42–E50 (2012). Article ADS CAS Google Scholar *
Zechiedrich, E. L., Khodursky, A. B. & Cozzarelli, N. R. Topoisomerase IV, not gyrase, decatenates products of site-specific recombination in Escherichia coli. _Genes Dev._ 11, 2580–2592
(1997). Article CAS Google Scholar * Maxwell, A. The interaction between coumarin drugs and DNA gyrase. _Mol. Microbiol._ 9, 681–686 (1993). Article CAS Google Scholar * Khodursky, A.
B. et al. Analysis of topoisomerase function in bacterial replication fork movement: Use of DNA microarrays. _Proc. Natl Acad. Sci. USA_. 97 www.pnas.org (2000). * Wu, L. J. et al.
Geometric principles underlying the proliferation of a model cell system. Preprint at https://doi.org/10.1101/843979 (2019). * Jun, S. & Wright, A. Entropy as the driver of chromosome
segregation. _Nat. Rev. Microbiol_. 8 www.nature.com/reviews/micro (2010). * Thomason, L. C., Costantino, N. & Court, D. L. E. coli Genome Manipulation by P1 Transduction. in _Current
Protocols in Molecular Biology_, Vol. 79, 1.17.1–1.17.8 (John Wiley & Sons, Inc., 2007). * Moolman, M. C. et al. Slow unloading leads to DNA-bound β2-sliding clamp accumulation in live
Escherichia coli cells. _Nat. Commun._ 5, 5820 (2014). Article ADS Google Scholar * Wu, F., Van Rijn, E., Van Schie, B. G. C., Keymer, J. E. & Dekker, C. Multi-color imaging of the
bacterial nucleoid and division proteins with blue, orange, and near-infrared fluorescent proteins. _Front. Microbiol_ 6, 1–15 (2015). Google Scholar * Datsenko, K. A. & Wanner, B. L.
One-step inactivation of chromosomal genes in Escherichia coli K-12 using PCR products. _Proc. Natl Acad. Sci. USA._ 97, 6640–6645 (2000). * Ball, G. et al. SIMcheck: A toolbox for
successful super-resolution structured illumination microscopy. _Sci. Rep_. 5, 15915 (2015). Download references ACKNOWLEDGEMENTS We thank Nynke Dekker and Sumit Deb Roy for the kind gift of
replisome-labelled _E.coli_ strain, and them as well as David Sherratt for discussions. The work was supported by ERC Advanced Grant SynDiv (no. 669598) to C.D., and by the Netherlands
Organisation for Scientific Research (NWO/OCW), as part of the NanoFront and BaSyC programs. A.J. acknowledges support by the Swiss National Science Foundation (Grants P2ELP2_168554 and
P300P2_177768). AUTHOR INFORMATION AUTHORS AND AFFILIATIONS * Department of Bionanoscience, Kavli Institute of Nanoscience Delft, Delft University of Technology, Van der Maasweg 9, 2629 HZ,
Delft, The Netherlands Aleksandre Japaridze, Christos Gogou, Jacob W. J. Kerssemakers, Huyen My Nguyen & Cees Dekker Authors * Aleksandre Japaridze View author publications You can also
search for this author inPubMed Google Scholar * Christos Gogou View author publications You can also search for this author inPubMed Google Scholar * Jacob W. J. Kerssemakers View author
publications You can also search for this author inPubMed Google Scholar * Huyen My Nguyen View author publications You can also search for this author inPubMed Google Scholar * Cees Dekker
View author publications You can also search for this author inPubMed Google Scholar CONTRIBUTIONS A.J. and C.D. conceived and designed the project. A.J. and H.M.N. constructed the bacterial
strains. A.J., C.G., and H.M.N. did the microscopy experiments. J.K. led image analyses. All authors wrote the paper. C.D. supervised the project. CORRESPONDING AUTHOR Correspondence to
Cees Dekker. ETHICS DECLARATIONS COMPETING INTERESTS The authors declare no competing interests. ADDITIONAL INFORMATION PEER REVIEW INFORMATION _Nature Communications_ thanks the anonymous
reviewer(s) for their contribution to the peer review of this work. Peer reviewer reports are available. PUBLISHER’S NOTE Springer Nature remains neutral with regard to jurisdictional claims
in published maps and institutional affiliations. SUPPLEMENTARY INFORMATION SUPPLEMENTARY INFORMATION PEER REVIEW FILE DESCRIPTION OF ADDITIONAL SUPPLEMENTARY FILES SUPPLEMENTARY MOVIE 1
SUPPLEMENTARY MOVIE 2 SUPPLEMENTARY MOVIE 3 SUPPLEMENTARY MOVIE 4 REPORTING SUMMARY SOURCE DATA SOURCE DATA RIGHTS AND PERMISSIONS OPEN ACCESS This article is licensed under a Creative
Commons Attribution 4.0 International License, which permits use, sharing, adaptation, distribution and reproduction in any medium or format, as long as you give appropriate credit to the
original author(s) and the source, provide a link to the Creative Commons license, and indicate if changes were made. The images or other third party material in this article are included in
the article’s Creative Commons license, unless indicated otherwise in a credit line to the material. If material is not included in the article’s Creative Commons license and your intended
use is not permitted by statutory regulation or exceeds the permitted use, you will need to obtain permission directly from the copyright holder. To view a copy of this license, visit
http://creativecommons.org/licenses/by/4.0/. Reprints and permissions ABOUT THIS ARTICLE CITE THIS ARTICLE Japaridze, A., Gogou, C., Kerssemakers, J.W.J. _et al._ Direct observation of
independently moving replisomes in _Escherichia coli_. _Nat Commun_ 11, 3109 (2020). https://doi.org/10.1038/s41467-020-16946-7 Download citation * Received: 12 August 2019 * Accepted: 29
May 2020 * Published: 19 June 2020 * DOI: https://doi.org/10.1038/s41467-020-16946-7 SHARE THIS ARTICLE Anyone you share the following link with will be able to read this content: Get
shareable link Sorry, a shareable link is not currently available for this article. Copy to clipboard Provided by the Springer Nature SharedIt content-sharing initiative