Play all audios:
ABSTRACT Community mitigation strategies to combat COVID-19, ranging from healthy hygiene to shelter-in-place orders, exact substantial socioeconomic costs. Judicious implementation and
relaxation of restrictions amplify their public health benefits while reducing costs. We derive optimal strategies for toggling between mitigation stages using daily COVID-19 hospital
admissions. With public compliance, the policy triggers ensure adequate intensive care unit capacity with high probability while minimizing the duration of strict mitigation measures. In
comparison, we show that other sensible COVID-19 staging policies, including France’s ICU-based thresholds and a widely adopted indicator for reopening schools and businesses, require overly
restrictive measures or trigger strict stages too late to avert catastrophic surges. As proof-of-concept, we describe the optimization and maintenance of the staged alert system that has
guided COVID-19 policy in a large US city (Austin, Texas) since May 2020. As cities worldwide face future pandemic waves, our findings provide a robust strategy for tracking COVID-19
hospital admissions as an early indicator of hospital surges and enacting staged measures to ensure integrity of the health system, safety of the health workforce, and public confidence.
SIMILAR CONTENT BEING VIEWED BY OTHERS HIT-COVID, A GLOBAL DATABASE TRACKING PUBLIC HEALTH INTERVENTIONS TO COVID-19 Article Open access 27 August 2020 A COMPREHENSIVE COUNTY LEVEL MODEL TO
IDENTIFY FACTORS AFFECTING HOSPITAL CAPACITY AND PREDICT FUTURE HOSPITAL DEMAND Article Open access 29 November 2021 MODELING THE IMPACT OF NATIONAL AND REGIONAL LOCKDOWNS ON THE 2020 SPRING
WAVE OF COVID-19 IN FRANCE Article Open access 01 February 2023 INTRODUCTION Throughout the COVID-19 pandemic, community mitigation activities have proved vital to slowing viral
transmission and ensuring the integrity of healthcare systems. Along with viral testing, strategies such as social distancing, face-mask ordinances, business closures, travel restrictions,
and stay-home orders have remained paramount, even as safe and efficacious vaccines have become widely available and utilized. By April of 2020, strict stay-home orders were enacted almost
universally to combat initial waves of transmission. Within two months, however, many regions lifted restrictions hoping to alleviate socioeconomic hardship, although the risks of resurgence
were high1,2. In the US—which has reported over 583,000 COVID-19 deaths as of May 13, 20213—communities have scrambled to tighten and relax mitigation policies in response to threatening
surges in hospitalizations. Governmental bodies worldwide have established a variety of COVID-19 alert systems to provide situational awareness and policy directives for the public. They
typically monitor one or more data streams—such as COVID-19 case counts, test positivity, hospital capacity, or deaths—and trigger changes in alert level when the data reach specified
thresholds4. Although most systems include intermediate levels that are intended to slow transmission and reduce the need for full-blown shelter-in-place orders, they vary considerably in
complexity, key indicators, and policy levers. France, for example, has a four-stage system; the maximum level is triggered when weekly regional COVID-19 incidence exceeds 250 infections per
100,000 people and COVID-19 patients in the intensive care unit (ICU) occupy at least 60% of capacity5. New Zealand, Singapore, South Africa, and the UK have national systems ranging from
three to five alert levels that track data on various combinations of COVID-19 incidence, hospitalizations, death, and available healthcare capacity6,7; the alert-level system in South
Africa includes both economic and public health considerations, while the systems in New Zealand and Singapore focus on public health alone. Within the US, states and cities have established
various COVID-19 alert systems. New York’s NY Forward Plan8 monitors seven indicators, including hospital admissions, hospital census, and deaths, to determine a re-opening with four
phases. Illinois has a five-stage plan with 11 geographic regions, which tracks test positivity, COVID hospital admissions, and the availability of hospital surge beds, ICU beds, and
ventilators9. Such COVID-19 alert systems can provide valuable public guidance and flexible policy levers to slow the spread and control alarming surges. However, their public-facing
dashboards rarely provide information regarding the underlying design of the system, the choice of data indicators, or the specific thresholds for action. To the best of our knowledge, many
are grounded in expert opinion rather than rigorous trade-off analyses that balance COVID-19 burden with economic and social hardship. Although COVID-19 policies may be dictated by divergent
political and cultural considerations, they universally aim to prevent unmanageable surges that threaten the integrity of healthcare systems, like the early pandemic waves in Wuhan, Italy,
and New York10. Overwhelming numbers of COVID-19 hospitalizations can lead to excess serious complications and mortality for those with COVID-19 or other medical conditions like cancer or
cardiovascular disease, who may not receive timely or safe care11. For example, influxes of COVID-19 patients have undermined oncology services in the UK12 and colorectal medicine in
Italy13. Hospital surges also put healthcare workers at risk, potentially diminishing the workforce and further undermining the quality of care14,15. During COVID-19 surges in the US,
intensive care units neared capacity more quickly than other medical units16,17,18, with trained healthcare professionals rather than space, medical equipment, or PPE being the key limiting
resource17. Early data from China and Italy suggest that 5% of cases who test positive for COVID-1919 and 16% of hospitalized patients require ICU-level care20. In the fall and winter of
2020-2021, cities throughout the US and Europe again faced overwhelming COVID-19 healthcare surges despite community mitigation efforts21,22. Many have deployed temporary medical facilities,
often called field hospitals or alternate care sites, to accommodate overflow, although most are not equipped to provide ICU care23. For example, the Javits New York Medical Station has 42
ventilators and the Navy hospital ship USNS Comfort has 100 ICU beds as of April 202024, and Wisconsin, with over 85% of the state’s hospital beds and over 88% of the state’s ICU beds
occupied in early November 202025, began sending patients to a field hospital at the Wisconsin State Fair Park26. In this study, we apply stochastic optimization to recommend policy triggers
governing stages of community mitigation to prevent overwhelming hospital surges and ensure adequate capacity in the unlikely case that they occur. Strict community mitigation measures,
such as shelter-in-place orders, are socioeconomically detrimental and only proposed when the existing healthcare system risks inundation. Our data-driven optimization model is built atop a
high fidelity SEIR-style (susceptible-exposed-infectious-recovered) simulation model of SARS-CoV-2 transmission. We can rapidly solve for optimized thresholds for daily COVID-19 hospital
admissions at which community mitigation measures should be enhanced or relaxed. To validate the approach, we compare the optimized policies to established policies in terms of the expected
duration of restrictive closures and the probability that COVID-19 will overwhelm local healthcare capacity. Our principled framework can guide public policy, reducing socioeconomic hardship
while ensuring the integrity of the healthcare system. Our framework was rapidly developed and applied by a task force of scientists, public health authorities, hospital systems, and
elected officials during April and May of 2020 to create a robust COVID-19 alert system that has been used for nearly a year to guide public policy in the Austin, Texas metropolitan area,
with a population of about 2.2 million27. Here, we significantly extend a previously published pilot study28, which toggled between just two stages, into a practical data-driven framework
for building staged alert systems to mitigate competing risks in the face uncertainty and provide actionable policy insights based on the experiences in Austin. To demonstrate the
versatility of the method, we optimize a similar alert system for the larger Houston, Texas MSA, and extend the method to stand up an alternate care site if mitigation measures fail (see
Supplementary Discussion 1). RESULTS To solve for optimal policies, we simulate COVID-19 transmission under a staged alert system using a stochastic SEIR model, which includes ten
compartments for each of ten age-risk categories. In the model, the alert stages govern the COVID-19 transmission rate and the stages change when the seven-day moving average in COVID-19
hospital admissions crosses defined thresholds. Our stochastic optimization model identifies stage-specific thresholds that minimize the total expected cost while ensuring sufficient
healthcare capacity with high probability, using Monte Carlo estimates. We provide results for the Austin, Texas MSA, which implemented a COVID-19 alert system built via this approach on May
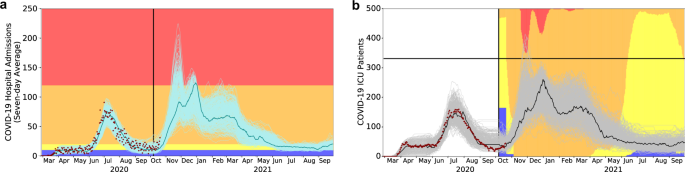
13, 202029, and provide analogous results for the Houston, Texas MSA in Supplementary Discussion 1. Our model includes four alert stages, blue (new normal), yellow (moderate risk), orange
(high risk), and red (very high risk), that progressively reduce transmission from an unmitigated baseline, and more so among high-risk sub-populations (Table 1). The reductions are based on
the least-squares fitting of the model to comprehensive COVID-19 hospitalization data from the Austin MSA from February 28 through October 7, 2020 (Supplementary Method 2). During the June
2020 pandemic surge the three major hospital systems in Austin estimated a total COVID-19 inpatient capacity of 1500 beds, including a COVID ICU capacity of 331 beds. Based on COVID-19
hospitalization and ICU counts in Austin, we estimate that the daily proportion of COVID-19 patients in ICUs dropped from 45% to 30% from March 19, 2020 to August 10, 2020. Even at 30%, ICU
capacity would likely be breached before general hospital capacity, as was corroborated by the June 2020 COVID-19 surge (Fig. 1). Thus, we design policies to ensure that COVID-19 healthcare
demand does not exceed the tighter constraint of ICU beds. While general ward beds can be converted to ICU beds, the requisite critical care nurses, physicians, and equipment such as
ventilators can be in short supply precisely when needed. Based on 12-month COVID-19 projections for Austin starting on October 7, 2020, we identify thresholds that provide at least 95%
assurance that Austin will not run out of ICU capacity while minimizing the overall socioeconomic cost, represented by a sum of daily penalties whose magnitude grows with stricter stages of
mitigation. Increasingly strict stages of yellow, orange, and red are triggered when the rolling seven-day average of COVID admissions exceeds 10, 20, or 120 cases, respectively (Table 2).
Assuming the observed reduction in transmission from July until October 7th, we expect that hospitalizations will rise to the point of triggering the orange stage by November and possibly
requiring a short-lived lock-down (red) between late November and mid-March (Fig. 1). We compare the optimized triggers to four alternative policies—an optimized two-stage system (with
access only to the red and yellow stages) that again respects ICU capacity, an optimized four-stage system that instead ensures total hospital capacity is respected with high probability
(0.95), thresholds based on France’s COVID-19 alert system, and widely cited reopening criteria developed by the Harvard Global Health Institute (HGHI)30 (Table 2 and Fig. 2). The policy
optimized to preserve overall inpatient rather than ICU capacity fails to ensure safe ICU capacity with an estimated 20% chance of an unmanageable surge. The distribution of ICU patient-days
above capacity is highly skewed with a median of 0 days, a 95th percentile of 1476 days, and a 99th percentile of 2388 days. Likewise, the France-based policy has a 38% chance of exceeding
ICU capacity with the median, 95th, and 99th percentiles of 0, 1273, and 2948 days. The other two policies err on the side of caution, providing strong guarantees that COVID-19 will not
overwhelm ICU capacity, but at the cost of longer duration of lock-downs. Under the optimal strategy, we would expect a median scenario to have two weeks of stage-red restrictions (14 [90%
PI: 0–16] days). The median lock-down periods increase to nine weeks and six weeks under the optimized two-stage system and Harvard-based policy, respectively. DISCUSSION As US states
relaxed and reinstated community mitigation measures during the early months of the COVID-19 pandemic, policymakers sought clarity on which data to track and when to take action. In April of
2020, we developed this data-driven optimization framework out of necessity, as the civic, healthcare, and public health leadership in the Austin metropolitan area raced to implement a
robust policy that would ensure the integrity of area hospitals while minimizing socioeconomic damage and complying with state-mandated reopening orders. The solution we derived for Austin,
which continues to guide policy as of May 2021, is to track daily new COVID-19 hospital admissions as an early indicator of hospital surges and enact staged restrictions when the 7-day
moving average crosses predetermined thresholds27,31. For plausible COVID-19 scenarios in Austin (Results) and Houston (Supplementary Discussion 1), we find that limited stay-at-home (red)
periods should suffice to respect healthcare capacity. In developing this approach, we addressed two early policy challenges that still persist in many jurisdictions. The first is
identifying a source of data that provides reliable and timely COVID-19 situational awareness. The two most widely collected and cited indicators—case counts and death counts—give unreliable
signals. Spikes and dips in confirmed case counts reflect the rapidly changing capacity and purview for testing, perhaps more than the pace of the pandemic itself, which may be compounded
by long turn-around times32,33 and delayed data reporting due to aged IT infrastructure and an over-tasked workforce34,35. Setting aside possible under-reporting of deaths, COVID-19
mortality data should more clearly indicate whether policies are having the desired effect on repressing transmission, but not until several weeks after the fact, given the 3-week average
course of fatal disease, and given the time taken to report such deaths. COVID-19 hospitalization counts may provide similar fidelity with a shorter lag, but inferring transmission rates
from such data may be complicated by variable duration of hospital stays, depending on the changing demographics of COVID-19 cases and the availability of alternative post acute-care
facilities. Of the various data streams, we find that COVID-19 hospital admissions provide the clearest early signal of recent transmission and imminent hospital surges. However, hospital
admissions are not typically reported on city, county, state, or national COVID-19 dashboards. Austin’s efforts to collect and publicize this data27 serve as an exemplar of local leadership
providing decision-makers and the public with a reliable real-time indicator of changing pandemic risks. The second persistent challenge is articulating clear policy goals that reflect the
universal desire to prevent suffering and loss of both life and livelihood while ensuring consistency with state and federal requirements. Early deliberations led Austin’s leadership to
posit a two-part goal. The first goal is to prevent overwhelming surges in hospitalizations that would potentially increase morbidity and mortality for any patients requiring care and
increase risks to the healthcare workforce. The second goal is to minimize the duration of economically restrictive policies. Designing policies to achieve concise and widely acceptable
objectives, like these, allows policymakers to anticipate potential limitations and provide transparent and intuitive justifications for the public. Cities, states, and countries worldwide
have enacted staged COVID-19 mitigation policies. However, few provide detailed rationales for the choice of data indicators or the trigger conditions for changing stages. They may, in fact,
be grounded in rigorous assessments of both data reliability and probability of achieving explicit policy goals. However, our comparative evaluation of two examples—France’s
ICU-capacity-based triggers and the Harvard Global Health Institute’s incidence-based triggers—suggest that such systems may be sensible but sub-optimal. They may err in the direction of
either failing to prevent overwhelming surges of COVID-19 hospitalizations or imposing unnecessarily early or long restrictions. Throughout the COVID-19 pandemic, various branches of the US
government, including city and state authorities, have engaged in highly polarized disputes regarding COVID-19 mitigation36. We designed this optimization framework during the spring of
2020, amidst considerable national tension over the White House’s Opening Up America Again plan37. In that climate, we aimed to provide an adaptive decision framework that would be
universally acceptable to all stakeholders, including our city, state, and federal governments, to ensure that the policies would not face political or legal challenges. Given the horrific
images from hospitals in Italy and New York in early 202038,39, there was broad consensus that local authorities should take measures to prevent overwhelming healthcare surges while opening
up the economy as much as possible. This led us to align our alert systems towards two goals—ensuring hospital capacity is not overrun while minimizing the duration of restrictive measures.
Since Austin implemented the recommended staged alert system in May 2020, city leadership has proactively socialized the framework through a public-facing dashboard that tracks hospital
admissions and visualizes the key thresholds27, and through daily public messaging via news outlets and social media40. Behind the scenes, the city’s COVID-19 task force has continually
pressure tested and updated the alert system, as our understanding of the virus, local healthcare resources, and behavioral responses have changed. For example, in October 2020, the major
hospital systems reduced their estimate of COVID-19 ICU capacity from 331 beds to 200 beds, stemming from an increase in non-COVID patients and staffing challenges. We quickly updated our
optimization analysis and determined that the triggers for transitioning to the strictest orange and red stages should be reduced. However, to avoid undermining public trust, the city did
not immediately announce the policy change. Instead, they waited until hospitalizations began trending upwards, but with ample time to cultivate community buy-in before the triggers hit. In
accordance with the revised triggers, Austin transitioned to the most stringent alert stage (red) on December 23, 2020, and relaxed to the orange and then yellow stages on February 9, 2021,
and March 13, 2021, respectively, when hospital admissions dropped below the corresponding thresholds. Austin’s staged system was optimized to prevent catastrophic healthcare surges while
minimizing the duration of costly measures. As designed, the shift to red in December prevented an overwhelming surge in COVID-19 ICU utilization, but just barely. The ICU census in the
metropolitan area peaked just below the local capacity of 200 beds on January 12, 2021 (Supplementary Discussion 2). As an indirect byproduct of flattening the hospitalization curve, the
system has also mitigated overall morbidity and mortality. As of March 22, 2021, Travis County (Austin) reported 73 COVID-19 deaths per 100,000 residents, which was considerably lower than
the statewide death rate of 161 per 100,00041. Other major metropolitan areas in Texas fared worse, with Harris County (Houston), Dallas County (Dallas), Bexar County (San Antonio) reporting
120, 143, and 162 COVID-19 deaths per 100,000 people, respectively. Texas’ hardest hit regions include the Rio Grande Valley with 281 (Hidalgo County) and 335 (Cameron County) COVID-19
deaths per 100,000 people, and West Texas with 300 (El Paso) and 249 (Lubbock) COVID deaths per 100,000 people. The staged alert system also seems to have achieved the goal of reducing
socioeconomic costs. Across 22 different trauma service areas of Texas42, the Austin area spent the fewest days under state-ordered restrictions on elective surgeries and
restaurant/bar/retail occupancy during the winter surge (Executive Order G32)43. There are important limitations to our approach. If the reporting of hospitalization data is delayed, biased,
or inconsistent, the system may be prone to false or delayed alarms44. Second, our analyses make strong assumptions about the reduction in transmission under various alert stages. Although
these are directly estimated from data during various pandemic periods in Austin, the future impact of staged restrictions may change with public willingness to comply with guidelines on
distancing, face coverings, and hygiene. If future restrictions lead to greater reductions in transmission than assumed in our model, then the policies would be conservative. That is, their
guarantee against overwhelming ICU surges would exceed 95%, at the expense of longer than necessary restrictions. If behavior is more lax than expected, then the policy may fail to protect
the healthcare system, potentially requiring personnel and resources from state or federal agencies, transferring of patients to other jurisdictions, or use of alternate care sites. Third,
our model assumes that hospital and ICU capacity for COVID-19 patients is fixed. However, other events or diseases, such as natural disasters or seasonal influenza may cause substantial
reductions in COVID-19 capacity. While predictable fluctuations can be incorporated into the model a priori, unpredictable events may pose significant risks. In fact, we have been validating
our model assumptions on a weekly basis throughout the pandemic. Our Austin COVID-19 healthcare dashboard45 provides daily estimates of the current reproduction number and three-week out
projections for hospital and ICU demand. As behavior and conditions in the city have evolved, we have adjusted our model and re-derived the optimal trigger policy thresholds. In all but one
case, we determined that the originally derived triggers were robust even if no longer optimal per our model. The one exception was an October 2020 update of local ICU capacity, based on
increased occupancy by non-COVID cases, that suggests a need to trigger the orange and red stages earlier than originally prescribed. Our framework for designing policy provides a path for
any city to reduce the need for strict shelter-in-place orders while ensuring the integrity of the health system, safety of the health workforce, and public confidence. It can be flexibly
tailored to determine policy triggers based on local demographics, health risks, behavioral responses to COVID-19, and healthcare capacity, as demonstrated for the city of Houston, Texas
(see Supplementary Discussion 1). Describing the strategy is easy—track daily new COVID-19 hospital admissions as a reliable indicator of an impending surge in hospitalizations and trigger
changes in policy when the seven-day moving average crosses predetermined thresholds. Implementation of this strategy is harder but can be done quickly with little additional cost. It
requires adding daily hospital admission counts to COVID-19 dashboards, firming up estimates for local COVID-19 ICU hospital surge capacity, and using straightforward models to determine
early warning indicators for when a surge is coming. As of May of 2021, SARS-CoV-2 vaccines are rolling out unevenly across the globe and the virus continues to wreak havoc on several
continents. The continual emergence of new viral variants may cause future resurgences, even in highly vaccinated communities. Thus, staged alert systems will continue to be an important
option for mitigating the risks of COVID-19, as well as future pandemics, particularly if they are carefully tailored to the changing state of the pandemic and effectively communicated to
encourage public compliance. METHODS Our SEIR simulation model assumes that pre-symptomatic, symptomatic, and asymptomatic cases have different levels of infectiousness. Contact rates vary
by age group, differ on weekdays and weekends, and decrease during school holidays and closures. We account for micro-stochastics using binomially distributed numbers of transitions between
compartments and macro-stochastics by randomly sampling parameter values from specified distributions; see Supplementary Methods 2, 3. We train, i.e., optimize, a policy on one set of 300
Monte Carlo simulations and require 95% stay within capacity, but report results using 300 independent, i.e., out-of-sample, test scenarios. Supplementary Method 1 details the optimization
model and its probabilistic constraint. The prediction intervals and the percentiles we report are based on order statistics from the 300 test scenarios. The simulation and optimization
models and the optimization algorithm are implemented in Python. We model four alert stages, each corresponding to a different level of transmission reduction. A day spent in the blue stage
incurs a unit socioeconomic cost, and each day spent in the next most restrictive stage increases the cost by a factor of 10. The trigger policy works as follows: as hospitalizations rise,
we move to a stricter stage of physical distancing when the seven-day moving average of daily admissions surpasses a threshold. As hospitalizations fall, we relax restrictions when the
seven-day moving average falls below the same threshold. These rules are coupled with a requirement that we spend at least two weeks in a stage. Institutional Review Board (IRB) approval was
not required for two reasons. First, the implementation of the staged alert system was deemed to be public health practice, and hence not subject to IRB approval46. Second, hospitalization
admissions and census data used to inform the staged alert system are publicly available27, and the use of anonymized patient experience data (Supplementary Method 2) was approved as exempt
human subjects research by the IRB of The University of Texas at Austin. REPORTING SUMMARY Further information on research design is available in the Nature Research Reporting Summary linked
to this article. DATA AVAILABILITY The hospital admissions and census data that supported this study can be found at the GitHub repository:
https://github.com/haoxiangyang89/COVID_Staged_Alert. The remaining data used in our analysis are also available at the GitHub repository and further made available and described in the
Supplementary Information. CODE AVAILABILITY The codes for performing the required analysis, and detailed instructions on installing and running the codes, are available at the repository
https://github.com/haoxiangyang89/COVID_Staged_Alert. The DOI for the GitHub repository is https://doi.org/10.5281/zenodo.475927847. REFERENCES * Kissler, S. M., Tedijanto, C., Lipsitch, M.
& Grad, Y. Social distancing strategies for curbing the COVID-19 epidemic. _MedRxiv_. (2020). https://www.medrxiv.org/content/10.1101/2020.03.22.20041079v1. * Prem, K. et al. The effect
of control strategies to reduce social mixing on outcomes of the COVID-19 epidemic in Wuhan, China: a modelling study. _Lancet Public Health_ 5, e261–e270 (2020). Article Google Scholar *
Centers for Disease Control and Prevention (CDC). United States COVID-19 cases and deaths by state (2020). https://covid.cdc.gov/covid-data-tracker/#cases. * Vital Strategies,
PreventEpidemics.org. Staying alert: Navigating COVID-19 risk toward a new normal (2020). https://preventepidemics.org/covid19/resources/levels/. * Ministère des Solidarités et de La Sante.
Point hebdomadaire COVID-19 (2020). https://www.gouvernement.fr/sites/default/files/cfiles/prez_-_conf_de_presse_23092020_-_vdef.pdf. * Vital Strategies, PreventEpidemics.org. Annex 2
Example of an alert-level system and supporting communication tools: U.S. (2020). https://preventepidemics.org/covid19/resources/levels/. * GOV.UK. Local COVID alert levels: what you need to
know (2020). https://www.gov.uk/guidance/local-covid-alert-levels-what-you-need-to-know. * State of New York. NY Forward: A guide to reopening New York & building back better (2020).
https://www.governor.ny.gov/sites/governor.ny.gov/files/atoms/files/NYForwardReopeningGuide.pdf. * Illinois Department of Public Health. Restore Illinois: a public health approach to safely
reopen our state (2020). https://www.dph.illinois.gov/restore. * Remuzzi, A. & Remuzzi, G. COVID-19 and Italy: what next? _Lancet_ 395, 1225–1228 (2020). Article CAS Google Scholar *
Sharpless, N. E. COVID-19 and cancer. _Science_ 368, 1290–1290 (2020). Article CAS ADS Google Scholar * Burki, T. K. Cancer guidelines during the COVID-19 pandemic. _Lancet Oncol._ 21,
629–630 (2020). Article CAS Google Scholar * Lisi, G., Campanelli, M., Spoletini, D. & Carlini, M. The possible impact of COVID-19 on colorectal surgery in Italy. _Colorectal Dis._
22, 641–642 (2020). Article CAS Google Scholar * Nguyen, L. H. et al. Risk of COVID-19 among front-line health-care workers and the general community: a prospective cohort study. _Lancet
Public Health_ 5, e475–e483 (2020). Article Google Scholar * McGarry, B. E., Grabowski, D. C. & Barnett, M. L. Severe staffing and personal protective equipment shortages faced by
nursing homes during the COVID-19 pandemic. _Health Aff._ (2020). https://doi.org/10.1377/hlthaff.2020.01269. * Tsai, T. C., Jacobson, B. H. & Jha, A. K. American hospital capacity and
projected need for COVID-19 patient care. _Health Aff. Blog_ (2020). https://doi.org/10.1377/hblog20200317.457910/full/. * Abir, M. et al. Critical care surge response strategies for the
2020 COVID-19 outbreak in the United States. Techical Report, RAND Corporation (2020). * Murthy, S., Gomersall, C. D. & Fowler, R. A. Care for critically ill patients with COVID-19.
_JAMA_ 323, 1499–1500 (2020). Article Google Scholar * Guan, W. et al. Clinical characteristics of coronavirus disease 2019 in China. _N. Engl. J. Med._ 382, 1708–1720 (2020). Article CAS
Google Scholar * Grasselli, G., Pesenti, A. & Cecconi, M. Critical care utilization for the COVID-19 outbreak in Lombardy, Italy. _JAMA_ 323, 1545 (2020). Article CAS Google Scholar
* Euronews. Coronavirus second wave: How are rising infections in Europe affecting COVID-19 deaths? (2020).
https://www.euronews.com/2020/11/04/coronavirus-second-wave-how-are-rising-infections-in-europe-affecting-covid-19-deaths. * Chiwaya, N. & Siemaszko, C. COVID-19 cases, deaths rising
rapidly ahead of election day (2020). https://www.nbcnews.com/news/us-news/covid-19-cases-deaths-rising-rapid-rate-ahead-election-day-n1245780. * Meyer, G. S., Blanchfield, B. B., Bohmer, R.
M. J., Mountford, J. & Vanderwagen, C. Alternative care sites for the COVID-19 pandemic: the early US and UK experience. _NEJM Catal. Innov. Care Deliv._ (2020).
https://doi.org/10.1056/CAT.20.0224. * Lopez, C. T. Comfort, Javits Center Open Care to COVID-19 patients (2020).
https://www.defense.gov/Explore/News/Article/Article/2140535/comfort-javits-center-open-care-to-covid-19-patients/. * Wisconsin Department of Health Services. COVID-19: hospital capacity by
region and county (2020). https://www.dhs.wisconsin.gov/covid-19/capacity.htm. * NPR. Wisconsin opens a field hospital at State Fair Grounds as coronavirus cases spike (2020).
https://www.npr.org/2020/10/22/926809402/wisconsin-opens-a-field-hospital-at-state-fair-grounds-as-coronavirus-cases-spik. * City of Austin. Key indicators for staging (2020).
https://austin.maps.arcgis.com/apps/dashboards/0ad7fa50ba504e73be9945ec2a7841cb. * Duque, D. et al. Timing social distancing to avert unmanageable COVID-19 hospital surges. _Proc. Natl Acad.
Sci._ 117, 19873–19878 (2020). Article CAS Google Scholar * Austin Public Health. New risk-based guidelines to help the community stay safe during COVID-19 pandemic. (2020).
https://austintexas.gov/news/new-risk-based-guidelines-help-community-stay-safe-during-covid-19-pandemic. * Harvard Global Health Institute. Key metrics for COVID suppression (2020).
https://globalepidemics.org/wp-content/uploads/2020/09/key_metrics_and_indicators_v5-1.pdf. * Austin Public Health. COVID-19: Risk-based guidelines. (2020).
https://austintexas.gov/news/austin-public-healths-risk-based-guidelines-chart-revised. * Vong, S. & Kakkar, M. Monitoring COVID-19 where capacity for testing is limited: use of a
three-step analysis based on test positivity ratio. _WHO South-East Asia J. Public Health_ 2, 141–146 (2020). Article Google Scholar * Stein, R. Coronavirus test results get faster, but
still too slow to help slow disease spread (2020).
https://www.npr.org/sections/health-shots/2020/10/19/923972496/covid-19-test-results-get-faster-but-still-too-slow-to-help-slow-disease-spread#:~:text=Live20Sessions-,Coronavirus%20Testing%20Delays%20Still%20Prevent%20Effective%20Disease%20Control%2C%20Survey%20Finds,spreading%20the%20virus%2C%20researchers%20report.
* Washington State Department of Health. Statement from the Washington State Department of Health (2020).
https://www.doh.wa.gov/Newsroom/Articles/ID/1246/Statement-from-the-Washington-State-Department-of-Health. * Landler, M. & Mueller, B. In U.K.’s test and trace: Now you see ’em, now you
don’t. _The New York Times_ (2020). https://www.nytimes.com/2020/10/05/world/europe/uk-testing-johnson-hancock.html. * Maizland, L. Comparing coronavirus lockdowns: the federal-local divide
(2020). https://www.cfr.org/in-brief/comparing-coronavirus-lockdowns-federal-local-divide. * The White House and Centers for Disease Control and Prevention. Guidelines: Opening Up America
Again (2020). https://trumpwhitehouse.archives.gov/openingamerica/ * Berger, P. NYC dead stay in freezer trucks set up during spring Covid-19 surge. _Wall Street J._ (2020).
https://www.wsj.com/articles/nyc-dead-stay-in-freezer-trucks-set-up-during-spring-covid-19-surge-11606050000. * Cheng, M. & Thomas, T. ‘not a wave, a tsunami.’ Italy hospitals at virus
limit. _PBS News Hour_ (2020). https://www.pbs.org/newshour/health/not-a-wave-a-tsunami-italy-hospitals-at-virus-limit. * City of Austin. Media News (2021).
https://www.austintexas.gov/department/news/3697. * Blackman, J., Wermund, B. & Bureau, W. Gov. Abbott again urges mask use as Texas tops 100 COVID-19 deaths per day. _Houston Chronicle_
(2020). https://www.houstonchronicle.com/news/houston-texas/article/White-House-document-says-half-of-Texas-is-in-15416245.php. * Texas Administrative Code. Section 157.122. Trauma Service
Areas (2021). http://txrules.elaws.us/rule/title25_chapter157_sec.157.122. * The Governor of Texas. Executive Order GA32: Relating to the continued response to the COVID-19 disaster as Texas
reopens (2020). https://gov.texas.gov/uploads/files/press/EO-GA-32_continued_response_to_COVID-19_IMAGE_10-07-2020.pdf. * Wang, X. et al. Impact of social distancing measures on coronavirus
disease healthcare demand, central Texas, USA. _Emerg. Infect. Dis._ 26, 2361–2369 (2020). Article Google Scholar * The University of Texas COVID-19 Modeling Consortium. Texas projections
(2020). https://covid-19.tacc.utexas.edu/texas-projections/. * Otto, J. L., Holodniy, M. & DeFraites, R. F. Public health practice is not research. _Am. J. Public Health_ 104, 596–602
(2014). Article Google Scholar * Yang, H. et al. Staged alert systems to ensure healthcare capacity (2021). _Repository name: COVID_Staged_Alert_. https://doi.org/10.5281/zenodo.4759278.
https://github.com/haoxiangyang89/COVID_Staged_Alert. Download references ACKNOWLEDGEMENTS The authors thank Achyut Kasi and Cindy Sanchez for code to produce graphs and reports used in the
manuscript. The Center for Nonlinear Studies at Los Alamos National Laboratory supported Haoxiang Yang’s work. Bismark Singh was co-financed by the Bavarian-Czech Academic Agency with funds
from the Free State of Bavaria. This work was further supported by the National Institutes of Health under Grant NIH R01 AI151176 and by the U.S. Department of Homeland Security under Grant
2017-ST-061-QA0001. The views and conclusions contained in this document are those of the authors and should not be interpreted as necessarily representing the official policies, either
expressed or implied, of the U.S. Department of Homeland Security. AUTHOR INFORMATION AUTHORS AND AFFILIATIONS * Los Alamos National Laboratory, Los Alamos, NM, USA Haoxiang Yang *
Industrial Engineering and Management Sciences, Northwestern University, Evanston, IL, USA Özge Sürer, Daniel Duque & David P. Morton * Department of Mathematics,
Friedrich-Alexander-Universität Erlangen-Nürnberg, Erlangen, Germany Bismark Singh * Integrative Biology, The University of Texas at Austin, Austin, TX, USA Spencer J. Fox, Zhanwei Du &
Lauren Ancel Meyers * Operations Research and Industrial Engineering, The University of Texas at Austin, Austin, TX, USA Remy Pasco * Texas Advanced Computing Center (TACC), The University
of Texas at Austin, Austin, TX, USA Kelly Pierce * Dell Medical School, The University of Texas at Austin, Austin, TX, USA Paul Rathouz, Victoria Valencia, Michael Pignone & S. Claiborne
Johnston * The City of Austin, Austin, TX, USA Mark E. Escott & Stephen I. Adler * Santa Fe Institute, Santa Fe, NM, USA Lauren Ancel Meyers Authors * Haoxiang Yang View author
publications You can also search for this author inPubMed Google Scholar * Özge Sürer View author publications You can also search for this author inPubMed Google Scholar * Daniel Duque View
author publications You can also search for this author inPubMed Google Scholar * David P. Morton View author publications You can also search for this author inPubMed Google Scholar *
Bismark Singh View author publications You can also search for this author inPubMed Google Scholar * Spencer J. Fox View author publications You can also search for this author inPubMed
Google Scholar * Remy Pasco View author publications You can also search for this author inPubMed Google Scholar * Kelly Pierce View author publications You can also search for this author
inPubMed Google Scholar * Paul Rathouz View author publications You can also search for this author inPubMed Google Scholar * Victoria Valencia View author publications You can also search
for this author inPubMed Google Scholar * Zhanwei Du View author publications You can also search for this author inPubMed Google Scholar * Michael Pignone View author publications You can
also search for this author inPubMed Google Scholar * Mark E. Escott View author publications You can also search for this author inPubMed Google Scholar * Stephen I. Adler View author
publications You can also search for this author inPubMed Google Scholar * S. Claiborne Johnston View author publications You can also search for this author inPubMed Google Scholar * Lauren
Ancel Meyers View author publications You can also search for this author inPubMed Google Scholar CONTRIBUTIONS H.Y., D.P.M., and L.A.M. designed the research; H.Y., Ö.S., D.D., D.P.M.,
P.R., Z.D., and L.A.M. performed the research; H.Y., Ö.S., D.P.M., R.P., K.P., P.R., V.V., and L.A.M. analyzed data; M.P., M.E.E., S.I.A., and S.C.J. provided valuable insights regarding
public health policy and socializing the trigger-based staged-alert system; and H.Y., Ö.S., D.P.M., B.S., S.J.F., Z.D., and L.A.M. wrote the paper. CORRESPONDING AUTHOR Correspondence to
Lauren Ancel Meyers. ETHICS DECLARATIONS COMPETING INTERESTS The authors declare no competing interests. ADDITIONAL INFORMATION PEER REVIEW INFORMATION _Nature Communications_ thanks Cameron
Zachreson and the other, anonymous reviewer(s) for their contribution to the peer review of this work. Peer review reports are available. PUBLISHER’S NOTE Springer Nature remains neutral
with regard to jurisdictional claims in published maps and institutional affiliations. SUPPLEMENTARY INFORMATION SUPPLEMENTARY INFORMATION PEER REVIEW FILE REPORTING SUMMARY RIGHTS AND
PERMISSIONS OPEN ACCESS This article is licensed under a Creative Commons Attribution 4.0 International License, which permits use, sharing, adaptation, distribution and reproduction in any
medium or format, as long as you give appropriate credit to the original author(s) and the source, provide a link to the Creative Commons license, and indicate if changes were made. The
images or other third party material in this article are included in the article’s Creative Commons license, unless indicated otherwise in a credit line to the material. If material is not
included in the article’s Creative Commons license and your intended use is not permitted by statutory regulation or exceeds the permitted use, you will need to obtain permission directly
from the copyright holder. To view a copy of this license, visit http://creativecommons.org/licenses/by/4.0/. Reprints and permissions ABOUT THIS ARTICLE CITE THIS ARTICLE Yang, H., Sürer,
Ö., Duque, D. _et al._ Design of COVID-19 staged alert systems to ensure healthcare capacity with minimal closures. _Nat Commun_ 12, 3767 (2021). https://doi.org/10.1038/s41467-021-23989-x
Download citation * Received: 08 December 2020 * Accepted: 21 May 2021 * Published: 18 June 2021 * DOI: https://doi.org/10.1038/s41467-021-23989-x SHARE THIS ARTICLE Anyone you share the
following link with will be able to read this content: Get shareable link Sorry, a shareable link is not currently available for this article. Copy to clipboard Provided by the Springer
Nature SharedIt content-sharing initiative