Play all audios:
ABSTRACT The effect of past environmental changes on the demography and genetic diversity of natural populations remains a contentious issue and has rarely been investigated across multiple,
phylogenetically distant species. Here, we perform comparative population genomic analyses and demographic inferences for seven widely distributed and ecologically contrasting European
forest tree species based on concerted sampling of 164 populations across their natural ranges. For all seven species, the effective population size, _N__e_, increased or remained stable
over many glacial cycles and up to 15 million years in the most extreme cases. Surprisingly, the drastic environmental changes associated with the Pleistocene glacial cycles have had little
impact on the level of genetic diversity of dominant forest tree species, despite major shifts in their geographic ranges. Based on their trajectories of _N__e_ over time, the seven tree
species can be divided into three major groups, highlighting the importance of life history and range size in determining synchronous variation in genetic diversity over time. Altogether,
our results indicate that forest trees have been able to retain their evolutionary potential over very long periods of time despite strong environmental changes. SIMILAR CONTENT BEING VIEWED
BY OTHERS WEAK FOUNDER EFFECTS BUT SIGNIFICANT SPATIAL GENETIC IMPRINT OF RECENT CONTRACTION AND EXPANSION OF EUROPEAN BEECH POPULATIONS Article 23 November 2020 ROLLING DOWN THAT MOUNTAIN:
MICROGEOGRAPHICAL ADAPTIVE DIVERGENCE DURING A FAST POPULATION EXPANSION ALONG A STEEP ENVIRONMENTAL GRADIENT IN EUROPEAN BEECH Article Open access 18 June 2024 DISENTANGLING THE
CONTEMPORARY AND HISTORICAL EFFECTS OF LANDSCAPE ON THE POPULATION GENOMIC VARIATION OF TWO BIRD SPECIES RESTRICTED TO THE HIGHLAND FOREST ENCLAVES OF NORTHEASTERN BRAZIL Article 20 November
2023 INTRODUCTION Extant northern temperate and boreal tree species have existed for millions of years and survived multiple glacial cycles. Micro- and macrofossil data indicate that these
tree species have undergone huge range changes and large fluctuations in their census population sizes (_N__c_) over time1. This was largely corroborated by numerous phylogeographic
studies2. Yet, today most tree species harbor large amounts of genetic diversity3 and they have been shown to respond rapidly, both genetically and demographically, to recent environmental
challenges such as the Little Ice Age4 or the Last Glacial Maximum (LGM)5,6. While these rapid responses to new selection pressures are consistent with their current large population sizes,
high realized outcrossing rates, and efficient gene flow, they may seem paradoxical in view of the large census size changes suggested by the fossil records. Unfortunately, we still lack a
comprehensive view of the impact of past demographic changes on the effective population size (_N__e_), the key evolutionary parameter defining the genetic diversity and efficacy of
selection7. For example, did _N__e_ fluctuate strongly through time or, on the contrary, was it retained and stable over repeated glacial cycles despite changes in _N__c_? Were changes in
_N__e_ primarily driven by climatic events or do they also reflect intrinsic biological characteristics such as life history or physiological properties? In the former case one would expect
a high synchronicity in changes across multiple species independently of their biological properties while, in the latter case, one would expect species to form categories according to their
patterns of intraspecific diversity changes and shared biological properties8,9. In Europe, the LGM which occurred ~27,000 to 19,000 years ago, and ensuing Holocene recolonizations have
often been assumed to be the main drivers of the current distribution of intraspecific genetic diversity, with southern populations being typically more diverged than those from the more
northern core range10,11. Earlier analyses of the demographic histories of European forest tree species generally relied on organellar markers whose polymorphisms are informative on a
shorter time span than nuclear markers since in monoecious species their effective population size is half of that for nuclear markers and in dioecious a quarter12,13. Quite naturally,
outcomes were interpreted from the perspective of only the most recent glacial period (i.e., LGM)11. Further, inferences based on organellar markers that behave as a single locus and, in
most cases, are maternally inherited and only disperse via seeds, have limited relevance for nuclear genetic diversity wherein most of the genetic variation lies. Genome re-sequencing
combined with coalescence-based demographic methods allowed inferring the demographic history of forest trees and its timescale well beyond the LGM, up to millions of years. However, most
studies so far address single species or focus on inferring the timing of divergence and the extent of gene flow between populations or closely related species14,15,16,17,18. Congruence
between population history and glacial oscillations has been observed in some species14,19 but remained far from being conclusive in others20,21. A general conclusion on the drivers of
temporal changes in genetic diversity across species cannot, however, be drawn from the compilation of these studies, or even from the reanalysis of the data they present, due to the
heterogeneity of sampling strategies, genomic sources of polymorphism, and numbers of loci. Here, we carried out a comprehensive demographic inference of seven major European tree species,
distributed from the boreal to the Mediterranean regions (Table 1), based on a common strategy both for sampling populations across Europe and for sequencing genomic regions. All seven
species are wind-pollinated, three are conifers (_Picea abies_, _Pinus pinaster_, and _Pinus sylvestris_) and four are angiosperms (_Betula pendula_, _Fagus sylvatica_, _Populus nigra_, and
_Quercus petraea_). We conducted targeted nuclear DNA sequencing (~10,000 species-specific probes that covered ~3 Mbp of largely orthologous sequences) on a total of 3407 adult trees
collected from 19 to 26 locations per species (~25 individuals each) across large parts of their natural ranges (Figs. 1, S1, Supplementary Text, Table 1, S1, Supplementary Data 1)22. We
first conducted a comprehensive survey of the distribution of current genetic diversity in all seven species and used state-of-the-art coalescent approaches to reconstruct changes in _N__e_
over multiple glacial cycles and test for synchronous changes across species. In this work, we show that past glacial and interglacial cycles did not have a major impact on genetic diversity
of common European tree species. All seven species show signs of recent population growth and species cluster in both diversity-divergence spectrum and based on their demographic
trajectories. Importantly, this last clustering does not reflect their phylogenetic closeness, but instead is likely the consequence of shared ecological and biological characteristics.
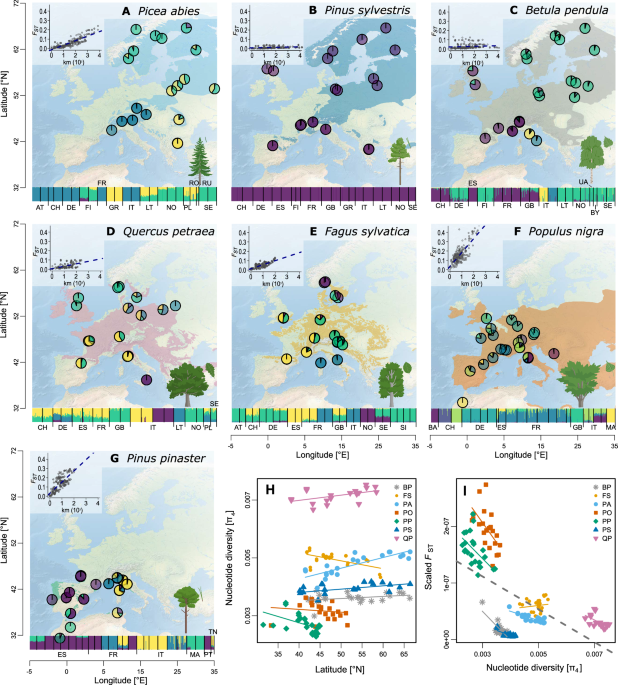
RESULTS PATTERNS OF GENETIC DIVERSITY DO NOT REFLECT PHYLOGENY OR ENVIRONMENTAL PREFERENCES Overall, current genetic diversity and structure in the seven species (Fig. 1) reflected neither
phylogeny nor current environmental preferences. The patterns likely followed from a combination of biological and ecological characteristics as well as range-limit constraints (biotic or
abiotic). With respect to genetic diversity and genetic differentiation among populations, the seven species can be divided into four sets: highly genetically structured and low diversity
_P. pinaster_ and _P. nigra_; moderately structured, and intermediate diversity _F. sylvatica_ and _P. abies_; moderately structured, high diversity _Q. petraea_; and finally, panmictic and
moderate diversity _P. sylvestris_ and _B. pendula_ (Fig. 1I). Nucleotide diversity at four-fold degenerate, synonymous sites (π4) ranged from 0.0027 to 0.0072 per bp across the seven
species (Table 1, Supplementary data 2), as is typical of outcrossing trees23, and was remarkably similar among populations of a given species (Fig. 1H). _Quercus petraea_ had the highest
genetic diversity and it increased towards the north. Also, boreal species (_P. abies_, _P. sylvestris_ and _B. pendula_) exhibited slightly higher diversity at high latitudes, whereas
genetic diversity tended to decrease northwards for the temperate species _P. nigra_, _F. sylvatica_ and _P. pinaster_ (Fig. 1H, Supplementary Data 2). Thus, the geographic distribution of
genetic diversity did not consistently follow the south–north latitudinal gradient that is often considered as a proxy for postglacial recolonization history24. Genetic differentiation
between populations (_F_ST) was low for most species, except for _P. pinaster_ and _P. nigra_ (Table 1). Isolation-by-distance at the range scale was significant for most species, likely
reflecting the distance-dependency of wind-mediated pollen dispersal over mere population-level genetic drift (Fig. 1A–G). However, the level of divergence was not uniform across the
species’ distributions. Generally, the most genetically divergent populations were found at southern latitudes (Fig. S2), similarly to what Petit et al.11 found across several angiosperm
trees. This result is also supported by the spatial distribution of ancestry proportions and principal component analysis (PCA) (Figs. 1A–G, S3–S23, Supplementary Data 2). Additionally,
populations at higher elevations were genetically more differentiated from the rest of the range (Fig. S2, Supplementary Data 3). Globally, genetic structure coincided with the main
discontinuities in the species’ distributions, but with considerable variation across species (Figs. 1A–G, S3–S16). MAIN DIVERGENCE EVENTS LARGELY PREDATE THE LAST GLACIAL MAXIMUM IN ALL
SEVEN SPECIES To compare divergence and demographic events across species, we analyzed different subsets of the data with, in each case, simple and consistent modeling choices and
methodology. The origin and timing of the divergence between populations (Table 1) was studied using demographic models implemented in fastsimcoal225,26. To estimate the timeframe of
population separation we analyzed in each species two non-admixed populations representing the main southern and northern clusters (Supplementary Data 4, Fig. S24). In all species,
divergence models with migration had better support than models without (Supplementary Data 4), and the estimated divergence times between major clusters largely predated the LGM, extending
from 0.6 Mya (middle Quaternary) up to 17 Mya within the Miocene (Fig. S25, Supplementary Data 4–6). Hence, for all species the formation of the main genetic groups was an outcome of
demographic events having occurred over multiple glacial cycles, and, importantly, these groups were preserved through glacial cycles despite extensive gene flow. Consequently, the overall
pattern of genetic differentiation better reflects topography and other persistent barriers to movement of populations, instead of recent divergence during the LGM. For example, the
mountains of southern Europe (e.g., Pyrenees, Alps) could have driven the recurrent formation of sky islands, i.e., isolated high-elevation regions to which cold-adapted species repeatedly
shifted during interglacial periods, resulting in higher divergence between southern high-elevation populations than between populations at lower altitudes or populations at more northern
latitudes27. GENERAL INCREASE IN _N_ _E_ OVER MULTIPLE GLACIAL CYCLES To infer the timescale of changes in _N_e in the seven species and over many glacial cycles, we used Stairway Plot 228,
a composite likelihood method that infers changes in _N_e over time from site frequency spectra (SFS). Because Stairway Plot 2 is model-flexible and inferences can be biased towards complex
models, with more demographic events occurring (overfitting), we tested the robustness of the results with the more constrained fastsimcoal2 2-epoch model. SFS-based inference of _N_e
trajectory measures changes in coalescence rates of gene genealogies, which depend on historical changes in _N_c affecting _N_e but also on barriers to gene flow in structured populations
and the way gene genealogies are sampled (29 and references therein). To account for the effect of sampling and population structure on demographic inferences30, we conducted analyses at the
species, population, and one-sample-per-population levels. With the last level, the analysis was focused on the dominating collecting phase of the genealogy31,32. All estimates of past and
present _N_e were in the range of tens or hundreds of thousands; these values are much smaller than any reasonable estimate of the study species’ current census sizes (_N_c), which is in the
scale of billions of individuals for most species33,34. While the observed ratios were lower than usual estimates of _N_e/_N_c, they fit with the trend of species with large _N_c displaying
below-average estimates of _N_e/_N_c35. All species, except _F. sylvatica_, showed an excess of rare variants in the SFS (Fig. 2) revealing a global signal of ancient population growth
(from 0.6 Mya in _P. sylvestris_ to 15 Mya in _Q. petraea_). This signal was consistent across sampling schemes and the two inference methods (Figs. 3A–B, S26) and is in line with earlier
studies on, e.g., _P. abies_ and _P. sylvestris_17,36. Strikingly, very few populations exhibited a signal of decreasing _N_e through time, and those populations were often disconnected from
the rest of the range and, thus, likely to have experienced stronger genetic drift (Fig. S27, Supplementary Data 7). The magnitude of increase in _N_e varied across species and was largest
for _P. sylvestris_ (from ~5000 to 500,000) and weakest for _F. sylvatica_, for which the proportional increase was only two-fold (from 100,000 to 200,000). Crucially, these patterns suggest
that the overall genetic diversity of each species, or equivalently for neutral loci their _N_e, has been maintained even during the massive range contractions caused by glacial advances.
In other words, dominant forest trees with large ranges, large _N_c, and efficient gene flow have retained genetic diversity over long periods of time, despite regional extinctions during
ecologically unfavorable periods. This contrasts with previous studies that generally tended to consider the LGM as the major cause of genetic change in forest tree species in Europe.
Simulations of unstructured populations undergoing cyclic 10-fold demographic changes confirm that _N__c_ fluctuations do not translate in fluctuating SFS-based _N__e_ trajectories when
_N__e_ remains large (>100,000) and generation time is long (>=15 years) but rather suggest an ancient decay of _N__e_ (Figs. S28–S31). SYNCHRONICITY AND IDIOSYNCRASY IN CHANGES IN _N_
E Across the seven species, the changes in _N__e_ over time were not entirely species-specific (Figs. 3C, S32 and Table S2). Instead, three groups of species could be distinguished based on
their demographic trajectories (Fig. 3C). A first group included the three boreal species (_P. abies, P. sylvestris_ and _B. pendula_) and the riparian _P. nigra_, a second group comprised
the two major temperate broadleaves (_F. sylvatica_ and _Q. petraea_), and the only Mediterranean conifer, _P. pinaster_, constituted a group of its own. Interestingly, this grouping differs
from the one established above based on current nucleotide diversity and population genetic structure. Neither patterns of _N_e of individual species nor synchronous changes align well with
the known glacial and interglacial periods (Fig. 3). This contrasts with some earlier results of individual forest tree species (e.g., refs. 14, 19, 37), but is in line with other
comparative studies8,9. The overall lack of correlation between changes in _N_e and climatic oscillations suggest that forest tree populations remained highly interconnected and acted as a
single, large metapopulation, whose _N_e was less affected by climatic fluctuations than _N_c. Still, repeated synchronous phases of slight decrease in _N_e can be detected despite the
global increasing trends, likely being the signature of shared, recurrent and possibly delayed influence of glacial cycles on these metapopulations (Fig. S32 and Table S2). DISCUSSION
CURRENT POPULATION GENETIC DIVERSITY IS THE RESULT OF LONG-TERM PROCESSES Our study demonstrates that these tree species have been able to retain their evolutionary potential through
multiple glacial cycles. This is in agreement with recent studies showing the ability of tree species to rapidly respond to environmental challenges4,6 and to swiftly colonize new areas as
they become suitable38. This potential likely reflects their unique biological features. Very large and genetically connected populations along with long generation time—hence, a limited
number of generations with elevated drift—allowed forest tree species to retain genetic diversity through time, despite intermittent, substantial geographical range contractions. This
diversity has taken shape and accumulated over very long periods of time, involving multiple glacial–interglacial cycles. Similarly, an investigation of the Distribution of Fitness Effects
(DFE) of new mutations for a subset of the same data showed differences in DFE between species but no differences among populations within species. This finding also suggests that
differences in DFE parameters accrue over long time periods39 and essentially reflect the collecting phase of the coalescent process of a many-demes model31,32. It is worth pointing out that
the seven species considered in this study are all widely distributed, relatively abundant, and ecologically important species of European forests. As such, they are interesting and
important models to study the effects of environmental factors on the evolutions of European forests across space and time. However, they do not form a representative sample of the modern
European tree flora. Furthermore, current species are those that survived past mass extinctions. At the Pliocene-Pleistocene transition the climate in the northern hemisphere changed
dramatically with the onset of the glacial-interglacial periods, resulting in large scale extinction of trees, especially in Europe40. The modern flora represents less than 30% of the tree
genera present during the Tertiary41,42. Extinctions eliminated deterministically cold sensitive species43, and following episodes of selection further favored species sharing invasiveness
attributes44 (prolificity, competitive ability, dispersal) that facilitated locally the replacement of the extinct species. While the use of pollen and macrofossil records as well as
low-resolution uni-parentally inherited organellar DNA markers in previous studies revealed post-LGM migration patterns11, these approaches did not give a complete understanding of the
dynamics of genetic diversity over time, simply because both data types cover a too short time period. Pollen records are informative on past plant population movements but chronologies of
tree pollen records are limited in time45, often uncertain especially at the species level46, and heterogeneous across space47. Further, they comprise no information on within-species
genetic relationships. Long-lived organisms, such as forest trees, have fewer generations per glacial cycle than annual and herbaceous species, and therefore will, for the same number of
generations, experience a larger number of glacial cycles. Simulations of demographic changes following glacial cycles show that inferred _N__e_ trajectory of annuals can capture the
demographic fluctuations of the last glacial-interglacial cycle. However, it is not the case for organisms with much longer generation time like trees (Figs. S28–S31). On the evolutionary
time scale, glacial cycles are shorter and recur faster for species with longer generation time and larger _N__e_. Hence, as was indeed observed, the current structure of genetic diversity
reasonably reflects the impact of many glacial cycles (e.g., refs. 48, 49). Importantly, our results explain how tree species that have survived repeated glacial cycles were able to retain
genetic diversity and, hence, a capacity to respond to new environmental challenges. However, genetic stability across millions of years does not exclude drastic changes in the short term,
e.g., in species distributions and local abundances, which can have major impacts on ecosystem and forest functions. Since we focused on inferring these demographic events based on current
genetic diversity, we disregarded individuals with a high degree of admixture. However, in most plant species, including trees, hybridization contributes significantly to genetic
diversity14,50,51. Among species included here, this primarily holds for _Q. petraea_52, which shows high nucleotide diversity (Fig. 1H) among the seven species we studied, but it may also
be relevant for others that show hybridization at least in parts of their ranges or have hybridized in the past (Table 1). For demographic inference, hybridization introduces signals of even
older evolutionary events and leads to elevated estimates of _N_e. For predicting population responses to climate change, more information on groups of closely related species will be
essential, especially as introgression can be important in environmental adaptation53. CHANGES IN _N_ _E_ ARE NOT ONLY DRIVEN BY GLACIAL CYCLES The genetic diversity of all seven species was
maintained across long periods of time: most of the time, _N__e_ either increased or remained stable. However, we did not observe a single shared dynamic of changes in _N__e_ across the
seven species, which would be expected if glacial cycles were the main drivers. Instead, there were three clear species groups based on _N__e_ change over time (Fig. 3C). In this respect,
our results are congruent with previous studies that also showed a tendency to low levels of overall synchronicity among species and even populations within species (8,9 and references
therein). Bai et al. 8 carried out a comparative demographic study in walnut species and showed that the timing and amplitude of changes in _N__e_ differed among species. They concluded that
the population histories of these walnut species were not driven by extrinsic environmental changes alone and that different species responded idiosyncratically to similar environmental
challenges8. Similarly, ref. 9 reconstructed the trajectories of _N__e_ of three palm species and four Annonaceae tree species from African rainforest. Here too, evolutionary responses were
largely asynchronous and individualistic. Interestingly, the three palm species had large _N__e_ (around 500,000) that increased regularly through time, as observed for our seven temperate
forest tree species. This was in contrast to the four Annonaceae species, whose _N_e were significantly smaller (around 50,000) and fluctuated strongly over the same time period. In the
present study, the peculiarity of _P. pinaster_ likely mirrors its more southern distribution as well as its highly fragmented range compared to the other six species while the synchronicity
between _Q. petraea_ and _F. sylvatica_ likely finds its origin in similarities in both biology (e.g., generation time, ecological niche, dispersal) and geographical distribution. The
recovered demographic histories of _Q. petraea_ and _F. sylvatica_ go back much further in time (i.e., ~32 and ~17 Mya, respectively) than for the other studied species. The depth of the _Q.
petraea_ genealogy and its relatively large _N_e are likely a consequence of continuous hybridization with other abundant and closely related white oak species54, combined with long
generation times. _Fagus sylvatica_ may have had small, secondary refugia outside the core refugial areas, maintaining local reservoirs of genetic diversity across glacial cycles47,55. The
synchronicity of the three boreal species also reflects some similarities in both biology and geographical distribution, although they also show marked differences in population genetic
estimates. One explanation for the grouping of _P. nigra_ with the boreal species could be that as a riparian species it was less affected by global climatic patterns and could have survived
glacial times in microrefugia close to rivers, also in colder regions. Finally, it is worth pointing out that the two pine species, _P. pinaster_ and _P. sylvestris_, were very distinct
from each other, despite similar mutation rates, rates of adaptive evolution and generation times, reflecting their different ecological characteristics and geographic ranges5,56. _N__e_
estimates and their timing scale according to the assumed mutation rates. We used the best current estimates obtained from forest trees based (see detail below). However, it is possible that
the scaling of events may extend or compress across the timeline as more precise estimates of mutation rates and generation time become available. It is noteworthy that the actual _N__e_
trajectories are not affected by the mutation rate, just their scaling. The present study highlights the existence of some commonalities in the _N__e_ trajectories of seven major European
forest tree species. Firstly, the _N__e_ of all seven species we analyzed showed a mostly monotonic growth over a large part of the Quaternary. Hence, the genetic diversity of large tree
metapopulations has been strikingly resilient to the drastic environmental changes during which the species experienced regional extinctions and extensive shifts in species distributions.
Secondly, the trajectories of _N_e through time were correlated within groups of species sharing ecological and biogeographical properties, but not across all species. This supports the idea
that changes in _N__e_ are not solely driven by climatic events but also reflect species’ shared biological characteristics such as life history or physiological properties. For instance,
two species, such as _B. pendula_ and _P. abies_, can have rather different extant population genetic structure across their similar distribution ranges, and yet have highly similar _N__e_
trajectories. Finally, it has been suggested that understanding individual species’ responses to past climatic oscillations is critical to predict their ability to cope with climate change9.
Our results, in contrast, suggest that species’ idiosyncratic responses, while highly desirable to understand for other purposes, may not be required for predicting their evolutionary
response to ongoing rapid climate change. However, recovering the evolutionary response of a wider spectrum of species would be needed to establish a reliable typology of demographic
histories and their effects on genetic diversity. METHODS SAMPLING We sampled seven tree species of considerable economic and/or ecological importance in Europe: _B. pendula_, _F.
sylvatica_, _P. nigra_, _P. abies_, _P. pinaster_, _P. sylvestris_ and _Q. petraea_. For each species, we sampled a minimum of 20 populations (Table S1, Supplementary Data 1) from across the
species’ natural distribution ranges (Fig. S1). Sampling was carried out within the framework of the EU Horizon 2020 project GenTree. The majority of the sampled populations are the same as
reported in ref. 22, with additional samples reported in Table S1. Sampling principles and details are described in ref. 22. We dried the samples with silica gel and collated them in a
single lab per species, where we extracted DNA (see Table S3 for details). We eluted the DNA in water, quality-checked it by UV spectrophotometry, and treated it with RNAse. We then sent all
DNA extracts to IGA Technology Services (Udine, Italy) for targeted sequencing. SEQUENCING AND SNP CALLING We focused on a limited part of the genome (3 Mbp) using targeted sequencing. The
targeted regions consisted of orthologous genes involved in putative functions of interest, species-specific candidate genes, and randomly selected genes (Table S4). We first established a
list of 2639 genes involved in functions of interest (e.g., response to stress, immune response, circadian clock, detection of abiotic stimulus) in _Arabidopsis thaliana_ using a term search
in Gene Ontology (GO) and Kyoto Encyclopedia of Genes and Genomes (Supplementary Data 8). For each species independently, we then identified putative orthologs to those 2639 genes using a
reciprocal best hit approach based on protein sequences (Blastp, BLAST v.2.5.0 +). Finally, we used Orthofinder v.1.1.457 on the complete set of putative orthologs to define orthogroups
across the seven species. The _Quercus robur_ reference genome was used to identify orthologs for _Q. petraea_, a closely related species with which it often hybridizes. The _Populus
trichocarpa_ reference genome was used for _P. nigra_. We selected 811 best orthogroups that included at least one gene for at least six of the seven tree species (Supplementary Data 9). For
some species, we also included a variable number of other orthogroups including genes that were found only in a reduced set of species (e.g., 59 additional genes across the three conifer
species; Supplementary Data 10). For each species, we then completed the ortholog list with genes of interest and randomly selected genes to reach up to 6 Mbp of sequence to serve as a
template for probe definition. Starting from the 6 Mbp of sequence mentioned above, Roche designed a set of uniquely mapping probes based on either a reference genome or coding sequence
(CDS) data coordinates (Table S4), relying on its custom probe design pipeline (454 Life Sciences, a Roche company, Branford, CT, USA) including the SSAHA algorithm58. We then restricted
candidate probes to cover 3 Mbp of sequence, prioritizing probes covering best-ortholog genes (Table S5). To estimate the quality of genomic DNA, we quantified random samples from each
96-well plate using a Qubit 2.0 Fluorometer (Invitrogen, Carlsbad, CA, USA) and a NanoDrop 1000 spectrophotometer (Thermo Fisher Scientific, Waltham, MA, USA). We quantified all 4754 samples
using the GloMax Explorer System (Promega Corporation, Madison, WI, USA) and prepared libraries for target enrichment using the SeqCap EZ – HyperPlus kit (Roche Sequencing Solutions,
Pleasanton, CA, USA) with 100 ng/µl of input DNA, following the manufacturer’s instructions. For _P. abies_ we conducted a second round of library preparation using 200 ng/µL of input DNA.
We evaluated library size using the Bioanalyzer High Sensitivity DNA assay (Agilent Technologies, Santa Clara, CA, USA) and quantified libraries using a Qubit 2.0 Fluorometer. We sequenced
the libraries on a HiSeq 2500 (125 cycles per read) for _P. abies_ and _B. pendula_ and on a NovaSeq 6000 (Illumina, San Diego, CA, USA; 150 cycles per read) for the remaining species, in
both cases working in paired-end mode. We used Illumina bcl2fastq v.2.20 for base calling and demultiplexing, and we used ERNE v.1.4.659 and Cutadapt60 for quality and adapter trimming, both
with default parameters. For mapping we used BWA mem v.0.7.1761 and samtools v.1.762 against the available reference genome of the same or closely related species, adding the mitochondrial
and chloroplast genomes when those were missing from the reference (Tables S6–S7, see https://github.com/GenTree-h2020-eu/GenTree/blob/master/Alignment_commands.txt for exact commands). In
brief, we removed reads mapping on the organellar genomes, multiple mapping reads using samtools, marked duplicates with Picard and removed them. We maintained only a relevant portion of the
genome with sufficient depth (>5n, where n = sample size) for the next step to speed up the SNP calling stage, which can be computationally demanding for large, fragmented genomes. We
performed SNP calling using the software package GATK v.4.0.10.059. Briefly, we ran HaplotypeCaller in GVCF mode to call potential variant sites at the single-sample level, then used
GenomicsDBImport and GenotypeGVCFs to perform joint genotyping on the entire cohort of samples. Command lines are available at
https://github.com/GenTree-h2020-eu/GenTree/blob/master/SNP_calling_commands.txt. QC AND SNP FILTERING We conducted initial quality control of the SNP data using PCA and ADMIXTURE. We
removed non-desired samples, e.g., misidentified species or obvious hybrids. We also removed samples with excessive amounts of missing data (\(\ge\) 60% for all species except _B. pendula_
where the threshold was \(\ge\) 20%) or extreme values of heterozygosity (\(\ge\) 6% of the calls heterozygous) for _P. nigra_ and _B. pendula_. Jupyter notebooks of initial quality control
are available at https://github.com/GenTree-h2020-eu/GenTree/tree/master/cervantesarango/JupyterNotebooks. We retained bi-allelic variants and followed GATK recommendations to exclude poorly
supported SNPs with scores QD < 0.25, QUAL < 20, SOR > 3.0, MQ < 30, MQRankSum < −12.5 and/or ReadPosRankSum < −8.0. Filtering code is available at
https://github.com/GenTree-h2020-eu/GenTree/tree/master/cervantesarango/GATK_rawSNPs_to_v2. We identified putative false SNPs derived from paralogs mapping to a single location in the
reference genome. We based the identification on heterozygote excess (H > 0.6) and deviation from the expected read ratio (D < −20 or D > 20) using the HDplot method
https://github.com/GenTree-h2020-eu/GenTree/tree/master/rellstab63. We further utilized the location information of each SNP to delineate regions with an especially large proportion of
paralog-derived SNPs $$\frac{{{{\rm{number}}}}\,{{{\rm{of}}}}\,{{{\rm{paralog}}}}\,{{{\rm{SNPs}}}}}{{{{\rm{number}}}}\,{{{\rm{of}}}}\,{{{\rm{SNPs}}}}} \, > \,
10\%\,{{{\rm{within}}}}\,250\,{{{\rm{bp}}}}$$ (1) and excluded all additional polymorphic positions included in those regions
(https://github.com/GenTree-h2020-eu/GenTree/tree/master/kastally/paralog_window_filtering). In addition to the variant-level filtering described above, we applied genotype-level filtering.
We reported genotype calls with depth (DP) < 8 or genotype quality (GQ) < 20 as missing data to ensure high-quality genotypes64, and we filtered out SNPs with >50% missing calls to
produce the v.5.3.2 VCF files. To estimate the size of the portion of the genome sequenced with sufficient quality and depth across individual of each species independently (available
genome, Table S7), we applied the same filtering procedure to the monomorphic positions, removing positions with DP < 8 and GQ < 20. Additionally, we excluded the same areas enriched
with paralogs. The exact limit of those areas was defined at mid-distance between the last paralog and the next retained SNP. Site-based annotation (4-fold degenerate, 2–3-fold degenerate
and 0-fold degenerate sites) of detected SNPs was completed using the python script NewAnnotateRef.py available at
https://github.com/fabbyrob/science/blob/master/pileup_analyzers/NewAnnotateRef.py. SNPs were classified as intergenic, intron, stop, up and down using ANNOVAR65 (Tables S8 and S9). SFS
SCALING Inference of demographic history can be done using SFS28,66. The SFS must be estimated on a sample of a given size for all sites, however, in real datasets sample size varies among
sites due to missing data. We therefore used the SNP set v.5.3.2 (see Supplementary Methods), removed SNPs with >50% of missing data in any population and down-sampled the SFS for each
population or subset used for demographic inference (see demographic analyses section for details) to half the initial sample size. The source code for resampling the SFS is available at
https://github.com/GenTree-h2020-eu/GenTree/tree/master/kastally/sfs_resampling. The SFSs produced were then used in downstream analyses (see below). POPULATION GENETIC STRUCTURE AND
ISOLATION-BY-DISTANCE To characterize the main genetic clusters among populations, we used SNP from dataset v.6.3.2 with only putatively neutral SNPs (i.e., 4-fold degenerate sites or
located in introns or intergenic regions), pruned for SNPs in high linkage disequilibrium and excluding singletons (plink v.1.9.), to compute ancestry components (Q score) for each
individual using ADMIXTURE v.1.367. We performed an unsupervised analysis of individual ancestry proportions based on maximum likelihood and implemented 20 replicates for each K value (1–12)
to assess cross-validation errors. Then, we averaged the Q scores of individuals for each population and visualized the geographic distribution of the genetic groups identified in ADMIXTURE
using the raster R package v.3.1.567. We calculated genetic distances with dataset v.6.3.1 based on pairwise _F_ST values68, implemented with the stamppFst function of the StAMPP R package
v.1.6.369. We then performed a hierarchical analysis of molecular variance (AMOVA), using the poppr.amova function of the poppr R package v.2.9.370, to assess the partitioning of genetic
variation: (i) between populations, (ii) between individuals within populations, and (iii) within individuals. We tested levels of significance using the randtest function of poppr. We
quantified the pattern of isolation-by-distance (IBD) with dataset v.6.3.1 by regressing the genetic distance between pairs of populations (_F_ST68) over the natural logarithm of the
geographic distance between populations, following Rousset’s71 approach for a two-dimensional stepping-stone model.
$$\frac{\widehat{{F}_{S{T}_{i}}}}{\left(1-\widehat{{F}_{S{T}_{i}}}\right)}={{{\rm{\beta }}}}{{\mathrm{ln}}}\left({x}_{i}\right)+{{{\rm{\alpha }}}}+{{{{\rm{\varepsilon }}}}}_{i}$$ (2) For
each pair of populations _i_, we estimated _F_ST using vcftools (v.0.1.13)72. xi is the geodesic distance separating the pair of populations in km (geosphere R package v.1.5-1073), _β_ is
the slope of the regression, _α_ is the intercept, and _ε_ is the error term. PRINCIPAL COMPONENT ANALYSIS In order to obtain a general picture of the main population structure of each
species, we conducted a PCA with EIGENSOFT and default parameters (v.7.2.0, https://github.com/DreichLab/EIG). For each species we used all populations included in the dataset v5.3 and kept
only 4-fold, intronic and intergenic SNPs pruned for high linkage disequilibrium. The whole procedure was repeated using dataset v.6.3.1 but removing the most divergent populations to
visualize more subtle population structure. SCALING _F_ ST AND COMPUTING POPULATION-SPECIFIC _F_ ST To investigate the change in population differentiation along latitude, longitude and
elevation, we computed the average population-specific _F_ST scaled by the natural logarithm of the geographic distance. For each focal population, we computed the average pairwise _F_ST
divided by the average distance (km) between each pair of populations in which the focal population was involved. MEASURING GENETIC DIVERSITY We estimated the pairwise nucleotide diversity,
π, for 4-fold (π4) and 0-fold sites (π0) as well as for silent sites (πs, comprising intergenic, intronic and 4-fold sites). Based on the allele frequencies obtained from the SFS after
down-sampling per species and per population based on SNP set v.5.3.2 (Table S10), we estimated the expected heterozygosity for each polymorphic site and summed the resulting values over all
segregating sites. To obtain a π value per site, we divided this sum by the total number of sites, including monomorphic sites: $${{{\rm{\pi }}}}=\frac{n}{L\left(n-1\right)}
{\sum}_{i=1}^{S}\left(1- {\sum}_{j=1}^{n}{p}_{{ji}}^{2}\right)$$ (3) where _n_ is the sample size, i.e., the number of allele copies, _S_ is the number of segregating sites, _p__ji_ is the
allele frequency at a polymorphic site _i_ for the _j_th allele, and _L_ is the total number of sites (polymorphic and monomorphic) in a class. Nucleotide diversity was estimated from and
averaged over 1000 resampled replicates using https://github.com/GenTree-h2020-eu/GenTree/blob/master/kastally/sfs_resampling/vcf2sfs_resample.R and
https://github.com/GenTree-h2020-eu/GenTree/blob/master/kbudde/pi_from_fsfs.R. DEMOGRAPHIC MODELING To infer past changes in the effective population size (_N__e_), we applied two approaches
based on the SFS: model-based estimates using fastsimcoal266 and model-free estimates with Stairway Plot 2 v.2.1.128. For both approaches, we used folded and rescaled SFS (see above) based
on 4-fold, intergenic and intronic sites (SNP set v5.3.2. without 0-fold sites). For the estimates using Stairway Plot 2, we applied different hierarchical levels and subsamples. First, we
made stairway plots by pooling all the samples together by species, to maximize the power to detect relatively recent demographic events by using large sample sizes74. Considering that the
SFS resulted from pooling all the samples together, different populations and especially population genetic clusters were not always equally represented, due to unequal missing data across
populations and unequal representation (in terms of populations and individuals) of different clusters. To investigate the impact of hierarchical population clustering on the stairway plots,
we reran Stairway Plot 2 at different hierarchical levels: (i) one sample per population (to account for unequal representation of populations) and (ii) separately for each population. For
the four broad-leaved species, we used the mutation rate of 7.77 × 10⁻⁹ per site per generation75 estimated for _Prunus_, which is close to estimates of the mutation rate per generation of 7
× 10-9 for _A. thaliana_76 and _Silene latifolia_77. To scale estimates of timing from generations to years, we assumed a generation time of 60 years for _Q. petraea_ and _F. sylvatica_,
and 15 years for _P. nigra_ and _B. pendula_. For the three conifers, we used a mutation rate of 2.7 × 10⁻⁸ per site per generation78 which is consistent with earlier, divergence-based
estimates, assuming a 25-year generation time17,79. We ran all stairway plot estimates using 67% of the sites for training and 200 resamplings from the SFS. We calculated breakpoints
following the suggestions in the stairway plot manual, i.e., at n/4, n/2, n*¾ and n-2 with n indicating the sample size. To confirm the results obtained with Stairway Plot 2, we used
fastsimcoal225,66 to infer the past demographic history of each species. We used the same folded SFSs (fSFS) as for Stairway Plot 2. We explored three single population models (Fig. S24): an
equilibrium model (standard neutral model, SNM), a model with one demographic change (epoch-2) and a model with two demographic changes (epoch-3). For all parameters (_N__e_ at each step
and each time of events, specifically: NCUR = most recent _N__e_; NANC = ancestral _N__e_; NBOT = _N__e_ after the first demographic event in the 3-epoch model; TBOT = time of the first
demographic event; TENDBOT: time of the second demographic event in the 3-epoch model), we set a log prior with a range of 10 to 107. We first inferred the best model by running 100
independent runs for each of the three models using fastsimcoal2 with 106 simulations (-n 1,000,000), a minimum of 10 conditional maximization algorithm (ECM) cycles for likelihood
computations (-l 10), 40 ECM cycles for parameter estimations (-L 40), and a minimum of one allele count for parameter estimation (–minSFScount 1; default value). For each model, we then
identified the run with the best likelihood score. We computed the AIC score for each run, and we compared the AIC values of different models. Finally, following Excoffier et al.66, we
computed confidence intervals for each parameter, selecting the parameter values of the best run for both 2-epoch and 3-epoch models to simulate 100 SFSs using fastsimcoal2. We then ran, for
each of those 100 SFSs, 100 independent runs of fastsimcoal2 using the same settings as before, obtaining 100 sets of parameters for each model, which we used to compute confidence
intervals for each model parameter. We used this same approach for each species, using the SFS computed over all samples and the SFS computed using only one haplotype per population. To
further test if more realistic models would better fit the observed data and impact our inference of past demographic changes, we tested four models of demographic changes including events
of divergence. For these models, we subset, for each species, samples from two locations, a southern and a northern one (we used admixture results to make sure that the samples came from two
distinct gene pools; Figs. S3–S16). From these sets, we explored the same three models, with no divergence events and pooling all samples together regardless of origin, and four models of
divergence differing regarding whether migration was possible after the divergence and including or not a demographic change before the divergence event. We used fastsimcoal2 to assess
models, using the fSFS of all samples pooled together for reference models, and the joint fSFS of the population pairs for models of divergence. We conducted the simulations and inference
with fastsimcoal2 by running 100 independent runs with 100,000 simulations each (-n 100,000), the same number of ECM cycles as used previously (-l 10 -L 40) and in folded mode (-m). We
explored all parameters (including all or some of the following for the divergence models: NCUR = _N__e_ before the split but after the demographic event; NANC = ancestral _N__e_; NPOP1 =
_N__e_ after the split for population 1; NPOP2 = _N__e_ after the split for population 2; TDIV = time of the split; TSEP = time of the demographic event; N1M21 = effective migration rate
from population 1 to population 2; N2M12 = effective migration rate from population 2 to population 1; and the same parameters as above for the panmictic models) with a logunif prior between
10 and 109, except for the parameters related to the number of effective migrants (the product between the migration rate and the effective population size, _N__e_ × m), which used logunif
priors set between 10-4 and 104. Finally, we compared the seven models using the likelihood and AIC score of the single best run out of 100, to identify the best model for each species and
its associated parameters. To test whether our results may be explained by a lack of statistical power, we tested the ability of Stairway Plot 2 to recover demographic cycles for a set of
parameter values relevant to our data and model species: generation time (1, 15, 25 and 60 years per generation), size of the sampled genome (1 Mbp or 6 Mbp), mutation rates (2.7 × 10⁻⁸ or
7.7 × 10⁻⁹ per site per generation), and current _N__e_ (103, 105, 106; the latest demographic event being an expansion, it is the highest _N__e_). The intensity of the expansion/contraction
of population size was set to 10-fold, and we implemented 10 events (i.e., 5 cycles of an expansion event followed by a contraction event) following the expected times of the glacial /
interglacial periods (i.e., a demographic expansion 15 kya, a decline 120 kya, then following a period of 120 kya, expansion or decline events successively, until a final decline about 1
Mya). Each event was modeled as an instantaneous change of _N__e_ with _N__e_ remaining stable in-between. These models were simulated with fastsimcoal2 to produce fSFS using a sample size
of 20 haploid genomes. We then ran demographic analyses with Stairway Plot 2 on the simulated fSFS using the settings used with the empirical fSFS (4 breakpoints fixed at sample sizes
following manual instructions and 200 simulations) (Figs. S28–S31). We also report nucleotide diversity (π) of each fSFS generated. To assess the influence that unaccounted for population
genetic structure may have on our analyses, we compare a set of three demographic inferences with Stairway plot 2 for each of the seven species. For the first one we artificially mixed two
populations, the second and third ones correspond to the analysis of each population separately (Fig. S33). For each species, we selected the same pairs of populations as for the demographic
modeling analyses (see above). In most cases, the inference is consistent across the mixed and separate analyses, suggesting that the level of population genetic structure we have in our
data has limited effects. SYNCHRONICITY ANALYSIS We then assessed whether the dynamics of changes in _N__e_ over time were species-specific or synchronous across species. To do so, we first
computed Kendall’s correlation coefficients between the output of Stairway Plot 2 for each pair of species and then investigated their covariance across the seven species using a heatmap
(heatmap3 R package, v.1.1.9 https://cran.r-project.org/package=heatmap3 with default parameters, Fig. 3C). This global approach allowed us to quantify the synchronous pattern in change in
_N__e_ over time between some species and test whether it was primarily driven by the global increase in _N__e_ over the period studied. This approach captures the main trend but will not
allow the identification of specific periods of high synchronicity between several species. In particular, it will miss decreases in _N__e_ that could be expected to be associated with
glacial periods. To specifically test whether periods over which the species experienced a decrease in _N__e_ showed higher synchronicity than expected given the actual change in _N__e_ over
time for the various species, we used a randomization approach. This analysis was conducted independently for the two groups of species showing the highest synchronicity _F. sylvatica_ and
_Q. petraea_ on the one hand, and _P. abies_, _B. pendula, P. sylvestris_ and _P. nigra_, on the other hand. More specifically, the Stairway Plot 2 output consists of a succession of
intervals, defined by a given _N__e_ estimate and two different time points. To simplify this, for each species independently, each interval was represented by a pair of values: the unique
_N__e_ value characteristic of the interval and the midpoint of the two time points. We excluded the most recent time point of the output of Stairway Plot 2 as it does not correspond to a
proper step. As the time points at which Stairway Plot 2 provides estimates of _N__e_ are species-specific, we inferred _N__e_ at every time point in the joint dataset by considering for
each species independently the value of the closest _N__e_ estimated by Stairway Plot 2. To smooth random fluctuations between time points and to mitigate the effects associated with small
deviations to our estimates of generation time and mutation rate, we averaged the changes in _N__e_ between two time points (_ΔN__e_ = _N__e(t)_ - _N__e(t+1)_) over 250 consecutive time
points, using sliding windows (_μΔN__e_). Finally, we used a randomization approach to detect periods of time during which the pattern of synchronicity in _N__e_ change is stronger than what
would be expected given species-specific change in _N__e_ over time; i.e., periods over which a larger number of species experienced a decrease in _N__e_ than expected if changes in _N__e_
were independently distributed across time in each species. For each species independently, we first randomized the vector of _ΔN__e_ values and averaged the randomized values over 250
consecutive time points using sliding windows (_μΔN__e_), as we did for the observed data. From the randomized time series, we recorded the maximum number of species experiencing a decrease
simultaneously, as well as the longest span over which synchronicity was conserved (i.e., the maximum number of consecutive positive _ΔN__e_). We repeated the whole procedure 10,000 times
and compared the observed values with the 95% percentile of the distribution of the maximum values obtained through the 10,000 simulations (Table S2 and Fig. S32). REPORTING SUMMARY Further
information on research design is available in the Nature Portfolio Reporting Summary linked to this article. DATA AVAILABILITY The short read data generated in this study have been
deposited to NCBI BioProjects under accession codes PRJNA602465, PRJNA602466, PRJNA602467, PRJNA602468, PRJNA602470, PRJNA602471, PRJNA602473. The vcf, ped and map -files generated in this
study are available in Data INRAE at https://doi.org/10.57745/DV2X0M80. Source data are provided as a Source Data file. Source data are provided with this paper. CODE AVAILABILITY Code is
available at: https://doi.org/10.5281/zenodo.794387681. REFERENCES * Birks, H. J. B. & W, T. in _European Atlas of_ _Forest Tree_ _Species_ (eds San-Miguel-Ayanz, J., de Rigo, D.,
Caudullo, G., Houston Durrant, T. & Mauri, A.) (Publication Office of the European Union, Luxembourg, 2016). * Lascoux, M., Palmé, A. E., Cheddadi, R. & Latta, R. G. Impact of ice
ages on the genetic structure of trees and shrubs. _Philos. Trans. R. Soc. Lond. Ser. B: Biol. Sci._ 359, 197–207 (2004). Article Google Scholar * Kremer, A. How well can existing forests
withstand climate change in: _Climate Change and Forest Genetic Diversity: Implications for Sustainable Forest Management in Europe._pp. 3–17. (eds. Koskela, J., Buck, A. & Teissier du
Cros, E.), (Bioversity International, Rome, 2007). * Saleh, D. et al. Genome-wide evolutionary response of European oaks during the Anthropocene. _Evolu. Lett._ 6, 4–20 (2022). Article ADS
Google Scholar * Alberto, F. J. et al. Potential for evolutionary responses to climate change - evidence from tree populations. _Glob. Change Biol._ 19, 1645–1661 (2013). Article ADS
Google Scholar * Li, L. et al. Teasing apart the joint effect of demography and natural selection in the birth of a contact zone. _N. Phytol._ 236, 1976–1987 (2022). Article Google Scholar
* Waples, R. S. What is Ne, anyway. _J. Heredity_ 113, 371–379 (2022). Article Google Scholar * Bai, W. et al. Demographically idiosyncratic responses to climate change and rapid
Pleistocene diversification of the walnut genus _Juglans_ (Juglandaceae) revealed by whole‐genome sequences. _N. Phytol._ 217, 1726–1736 (2018). Article CAS Google Scholar * Helmstetter,
A. J., Béthune, K., Kamdem, N. G., Sonké, B. & Couvreur, T. L. P. Individualistic evolutionary responses of Central African rain forest plants to Pleistocene climatic fluctuations.
_Proc. Natl Acad. Sci. USA_ 117, 32509–32518 (2020). Article ADS CAS PubMed PubMed Central Google Scholar * Taberlet, P., Fumagalli, L., Wust-Saucy, A. & Cosson, J. Comparative
phylogeography and postglacial colonization routes in Europe. _Mol. Ecol._ 7, 453–464 (1998). Article CAS PubMed Google Scholar * Petit, R. J. et al. Glacial refugia: Hotspots but not
melting pots of genetic diversity. _Science_ 300, 1563–1565 (2003). Article ADS CAS PubMed Google Scholar * Ballard, J. W. O. & Whitlock, M. C. The incomplete natural history of
mitochondria. _Mol. Ecol._ 13, 729–744 (2004). Article PubMed Google Scholar * Doyle, J. J. Defining coalescent genes: theory meets practice in organelle phylogenomics. _Syst. Biol._ 71,
476–489 (2022). Article CAS PubMed Google Scholar * Liu, S. et al. Demographic history and natural selection shape patterns of deleterious mutation load and barriers to introgression
across Populus genome. _Mol. Biol. Evol._ 39, msac008 (2022). Article CAS PubMed PubMed Central Google Scholar * Olsson, S. et al. Evolutionary history of the mediterranean Pinus
halepensis-brutia species complex using gene-resequencing and transcriptomic approaches. _Plant Mol. Biol._ 106, 367–380 (2021). Article CAS PubMed Google Scholar * Mayol, M. et al. A
multiscale approach to detect selection in nonmodel tree species: Widespread adaptation despite population decline in _Taxus baccata_ L. _Evolu. Appl._ 13, 143–160 (2020). Article CAS
Google Scholar * Chen, J. et al. Genomic data provide new insights on the demographic history and the extent of recent material transfers in Norway spruce. _Evolu. Appl._ 12, 1539–1551
(2019). Article Google Scholar * Hou, Z. & Li, A. Population genomics reveals demographic history and genomic differentiation of _Populus davidiana_ and _Populus tremula_. _Front.
Plant Sci._ 11, 553736 (2020). Article Google Scholar * Salojärvi, J. et al. Genome sequencing and population genomic analyses provide insights into the adaptive landscape of silver birch.
_Nat. Genet._ 49, 904–912 (2017). Article PubMed Google Scholar * Cai, M., Wen, Y., Uchiyama, K., Onuma, Y. & Tsumura, Y. Population genetic diversity and structure of ancient tree
populations of _Cryptomeria japonica_ var. _sinensis_ based on RAD-seq data. _Forests_ 11, 1192 (2020). Article Google Scholar * Capblancq, T. et al. Whole‐exome sequencing reveals a
long‐term decline in effective population size of red spruce (_Picea rubens_). _Evolu. Appl._ 13, 2190–2205 (2020). Article CAS Google Scholar * Opgenoorth, L. et al. The GenTree
Platform: growth traits and tree-level environmental data in 12 European forest tree species. _GigaScience_ 10, giab010 (2021). PubMed PubMed Central Google Scholar * Chen, J., Glémin, S.
& Lascoux, M. Genetic diversity and the efficacy of purifying selection across plant and animal species. _Mol. Biol. Evol._ 34, 1417–1428 (2017). Article CAS PubMed Google Scholar *
Eckert, C. G., Samis, K. E. & Lougheed, S. C. Genetic variation across species’ geographical ranges: the central–marginal hypothesis and beyond. _Mol. Ecol._ 17, 1170–1188 (2008).
Article CAS PubMed Google Scholar * Excoffier, L. & Foll, M. Fastsimcoal: a continuous-time coalescent simulator of genomic diversity under arbitrarily complex evolutionary
scenarios. _Bioinformatics_ 27, 1332–1334 (2011). Article CAS PubMed Google Scholar * Excoffier, L. et al. fastsimcoal2: demographic inference under complex evolutionary scenarios.
_Bioinformatics_ 37, 4882–4885 (2021). Article CAS PubMed PubMed Central Google Scholar * Hirao, A. S. et al. Genetic diversity within populations of an arctic-alpine species declines
with decreasing latitude across the Northern Hemisphere. _J. Biogeogr._ 44, 2740–2751 (2017). Article Google Scholar * Liu, X. & Fu, Y.-X. Stairway Plot 2: demographic history
inference with folded SNP frequency spectra. _Genome Biology_ 21, 280 (2020). * Mazet, O. & Noûs, C. Population genetics: coalescence rate and demographic parameters inference. _Peer
Community J._ 3, e53 (2023). Article Google Scholar * Chikhi, L., Sousa, V. C., Luisi, P., Goossens, B. & Beaumont, M. A. The confounding effects of population structure, genetic
diversity and the sampling scheme on the detection and quantification of population size changes. _Genetics_ 186, 983–995 (2010). Article PubMed PubMed Central Google Scholar * Wakeley,
J. & Aliacar, N. Gene genealogies in a metapopulation. _Genetics_ 159, 893–905 (2001). Article CAS PubMed PubMed Central Google Scholar * Wakeley, J. Nonequilibrium migration in
human history. _Genetics_ 153, 1863–1871 (1999). Article CAS PubMed PubMed Central Google Scholar * Petit, R. J. & Hampe, A. Some evolutionary consequences of being a tree. _Annu.
Rev. Ecol. Evol. Syst._ 37, 187–214 (2006). Article Google Scholar * Pyhäjärvi, T., Kujala, S. T. & Savolainen, O. 275 years of forestry meets genomics in _Pinus sylvestris_. _Evolu.
Appl._ 13, 11–30 (2020). Article Google Scholar * Palstra, F. P. & Fraser, D. J. Effective/census population size ratio estimation: a compendium and appraisal. _Ecol. Evol._ 2,
2357–2365 (2012). Article PubMed PubMed Central Google Scholar * Tyrmi, J. S. et al. Genomics of clinal local adaptation in _Pinus sylvestris_ under continuous environmental and spatial
genetic setting._G3: Genes, Genomes Genet._ 10, 2683–2696 (2020). Article CAS Google Scholar * Jaramillo-Correa, J. P. et al. Evolutionary rate and genetic load in an emblematic
Mediterranean tree following an ancient and prolonged population collapse. _Mol. Ecol._ 29, 4797–4811 (2020). Article CAS PubMed Google Scholar * Dial, R. J., Maher, C. T., Hewitt, R. E.
& Sullivan, P. F. Sufficient conditions for rapid range expansion of a boreal conifer. _Nature_ 608, 546–551 (2022). Article ADS CAS PubMed PubMed Central Google Scholar * James,
J. et al. Between but not within-species variation in the distribution of fitness effects. _Mol. Biol. Evol._ 40, msad228 (2023). Article CAS PubMed PubMed Central Google Scholar *
Rull, V. _Quaternary ecology, evolution, and biogeography_ (Academic Press, 2020). * Eiserhardt, W. L., Borchsenius, F., Eiserhardt WL, B. F., Plum, C. M., Ordonez, A. & Svenning, J. C.
Climate‐driven extinctions shape the phylogenetic structure of temperate tree floras. _Ecol. Lett._ 18, 263–272 (2015). Article PubMed Google Scholar * Latham, R. E. & Ricklefs, R. E.
Global patterns of tree species richness in moist forests: energy-diversity theory does not account for variation in species richness. _Oikos_ 67, 325–333 (1993). Article ADS Google
Scholar * Svenning, J. C. Deterministic Plio‐Pleistocene extinctions in the European cool‐temperate tree flora. _Ecol. Lett._ 6, 646–653 (2003). Article Google Scholar * Lamarque, L. J.,
Delzon, S. & Lortie, C. J. Tree invasions: a comparative test of the dominant hypotheses and functional traits. _Biol. Invasions_ 13, 1969–1989 (2011). Article Google Scholar * Birks,
H. J. B. Contributions of Quaternary botany to modern ecology and biogeography. _Plant Ecol. Divers._ 12, 189–385 (2019). Article Google Scholar * Petit, R. J. et al. Identification of
refugia and post-glacial colonisation routes of European white oaks based on chloroplast DNA and fossil pollen evidence. _For. Ecol. Manag._ 156, 49–74 (2002). Article Google Scholar *
Magri, D. et al. A new scenario for the Quaternary history of European beech populations: palaeobotanical evidence and genetic consequences. _N. Phytol._ 171, 199–221 (2006). Article CAS
Google Scholar * Shalev, T. J. et al. The western redcedar genome reveals low genetic diversity in a self-compatible conifer. _Genome Res._ 32, 1952–1964 (2022). PubMed PubMed Central
Google Scholar * Gugerli, F. et al. A range‐wide postglacial history of Swiss stone pine based on molecular markers and palaeoecological evidence. _J. Biogeogr._ 50, 1049–1062 (2023).
Article Google Scholar * Whitham, T. G., Morrow, P. A. & Potts, B. M. Conservation of hybrid plants. _Science_ 254, 5033 (1991). Article Google Scholar * Fu, R. et al. Genome-wide
analyses of introgression between two sympatric Asian oak species. _Nat. Ecol. Evol._ 6, 924–935 (2022). Article PubMed Google Scholar * Petit, R. J., Bodénès, C., Ducousso, A., Roussel,
G. & Kremer, A. Hybridization as a mechanism of invasion in oaks. _N. Phytol._ 161, 151–164 (2004). Article CAS Google Scholar * Suarez-Gonzalez, A., Lexer, C. & Cronk, Q. C. B.
Adaptive introgression: a plant perspective. _Biol. Lett._ 14, 20170688 (2018). * Leroy, T. et al. Extensive recent secondary contacts between four European white oak species. _N. Phytol._
214, 865–878 (2017). Article CAS Google Scholar * Magri, D. Patterns of post‐glacial spread and the extent of glacial refugia of European beech (_Fagus sylvatica_). _J. Biogeogr._ 35,
450–463 (2008). Article Google Scholar * Grivet, D. et al. High rate of adaptive evolution in two widespread European pines. _Mol. Ecol._ 26, 6857–6870 (2017). Article PubMed Google
Scholar * Emms, D. M. & Kelly, S. OrthoFinder: solving fundamental biases in whole genome comparisons dramatically improves orthogroup inference accuracy. _Genome Biol._ 16, 1–14
(2015). Article CAS Google Scholar * Ning, Z., Cox, A. J. & Mullikin, J. C. SSAHA: a fast search method for large DNA databases. _Genome Res._ 11, 1725–1729 (2001). Article CAS
PubMed PubMed Central Google Scholar * McKenna, A. et al. The genome analysis Toolkit: a MapReduce framework for analyzing next-generation DNA sequencing data. _Genome Res._ 20, 1297–1303
(2010). Article CAS PubMed PubMed Central Google Scholar * Martin, M. Cutadapt removes adapter sequences from high-throughput sequencing reads. _EMBnet. J._ 17, 10–12 (2011). Article
Google Scholar * Li, H. Aligning sequence reads, clone sequences and assembly contigs with BWA-MEM. a_rXiv preprint arXiv_:_1303.3997_ (2013). * Danecek, P. et al. Twelve years of SAMtools
and BCFtools. _Gigascience_ 10, giab008 (2021). Article PubMed PubMed Central Google Scholar * McKinney, G. J., Waples, R. K., Seeb, L. W. & Seeb, J. E. Paralogs are revealed by
proportion of heterozygotes and deviations in read ratios in genotyping-by-sequencing data from natural populations. _Mol. Ecol. Resour._ 17, 656–669 (2017). Article CAS PubMed Google
Scholar * Carson, A. R. et al. Effective filtering strategies to improve data quality from population-based whole exome sequencing studies. _BMC Bioinform._ 15, 1–15 (2014). Article Google
Scholar * Wang, K., Li, M. & Hakonarson, H. ANNOVAR: functional annotation of genetic variants from high-throughput sequencing data. _Nucleic Acids Res._ 38, e164–e164 (2010). Article
PubMed PubMed Central Google Scholar * Excoffier, L., Dupanloup, I., Huerta-Sánchez, E., Sousa, V. C. & Foll, M. Robust demographic inference from genomic and SNP data. _PLoS
Genet._ 9, e1003905 (2013). Article PubMed PubMed Central Google Scholar * Alexander, D. H. & Lange, K. Enhancements to the ADMIXTURE algorithm for individual ancestry estimation.
_BMC Bioinform._ 12, 1–6 (2011). Article Google Scholar * Weir, B. S. & Cockerham, C. C. Estimating F-statistics for the analysis of population structure. _Evolution_ 38, 1358–1370
(1984). CAS PubMed Google Scholar * Pembleton, L. W., Cogan, N. O. I. & Forster, J. W. St AMPP: an R package for calculation of genetic differentiation and structure of mixed‐ploidy
level populations. _Mol. Ecol. Resour._ 13, 946–952 (2013). Article CAS PubMed Google Scholar * Kamvar, Z. N., Tabima, J. F. & Grünwald, N. J. Poppr: an R package for genetic
analysis of populations with clonal, partially clonal, and/or sexual reproduction. _PeerJ_ 2, e281 (2014). Article PubMed PubMed Central Google Scholar * Rousset, F. Genetic
differentiation and estimation of gene flow from F-statistics under isolation by distance. _Genetics_ 145, 1219–1228 (1997). Article CAS PubMed PubMed Central Google Scholar * Danecek,
P. et al. The variant call format and VCFtools. _Bioinformatics_ 27, 2156–2158 (2011). Article CAS PubMed PubMed Central Google Scholar * Hijmans R. J. Spherical Trigonometry, R package
geosphere version 1.5–10. (2019). * Keinan, A. & Clark, A. G. Recent explosive human population growth has resulted in an excess of rare genetic variants. _Science_ 336, 740–743 (2012).
Article ADS CAS PubMed PubMed Central Google Scholar * Xie, Z. et al. Mutation rate analysis via parent–progeny sequencing of the perennial peach. I. A low rate in woody perennials
and a higher mutagenicity in hybrids. _Proc. R. Soc. B: Biol. Sci._ 283, 20161016 (2016). Article Google Scholar * Ossowski, S. et al. The rate and molecular spectrum of spontaneous
mutations in _Arabidopsis thaliana_. _Science_ 327, 92–94 (2010). Article ADS CAS PubMed Google Scholar * Krasovec, M., Chester, M., Ridout, K. & Filatov, D. A. The mutation rate
and the age of the sex chromosomes in _Silene latifolia_. _Curr. Biol._ 28, 1832–1838.e4 (2018). Article CAS PubMed Google Scholar * Hanlon, V. C. T., Otto, S. P. & Aitken, S. N.
Somatic mutations substantially increase the per-generation mutation rate in the conifer _Picea sitchensis_. _Evol. Lett._ 3, 348–358 (2019). Article PubMed PubMed Central Google Scholar
* Willyard, A., Syring, J., Gernandt, D. S., Liston, A. & Cronn, R. Fossil calibration of molecular divergence infers a moderate mutation rate and recent radiations for Pinus. _Mol.
Biol. Evol._ 24, 90–101 (2007). Article PubMed Google Scholar * Pyhäjärvi, T. et al. Gene sequence variation data for 3407 adult individuals from 164 range-wide populations of 7 widely
distributed European forest tree species, https://doi.org/10.57745/DV2X0M (2023). * PyhaTanja et al. GenTree-h2020-eu/GenTree: GenTree - Milesi et al. 2023 v1.0 (v1.0),
https://zenodo.org/records/7943876 (2023). * Caudullo, G., Welk, E. & San-Miguel-Ayanz, J. Chorological data for the main European woody species. _Mendeley Data_ V18,
https://data.mendeley.com/datasets/hr5h2hcgg4/18 (2024). * Lapierre, M., Lambert, A. & Achaz, G. Accuracy of demographic inferences from the site frequency spectrum: the case of the
Yoruba population. _Genetics_ 206, 439–449 (2017). Article PubMed PubMed Central Google Scholar * Nawa, N. & Tajima, F. Simple method for analyzing the pattern of DNA polymorphism
and its application to SNP data of human. _Genes Genet. Syst._ 83, 353–360 (2008). Article PubMed Google Scholar * Achaz, G. Frequency spectrum neutrality tests: one for all and all for
one. _Genetics_ 183, 249–258 (2009). Article PubMed PubMed Central Google Scholar Download references ACKNOWLEDGEMENTS Computations were made possible using resources from projects SNIC
2017/7-328, SNIC 2020/15-107 and SNIC 2021/5-540 of the Swedish National Infrastructure for Computing (SNIC) at UPPMAX, partially funded by the Swedish Research Council through grant
agreement no. 2018-05973. The CSC – IT Center for Science (Finland), the Genotoul Bioinformatics platform at Toulouse (France) and the Genetic Diversity Centre at ETH Zurich (Switzerland)
are acknowledged for generous computational and storage resources. This work also benefited from the Scientific Compute Cluster at GWDG, the joint data center of the Max Planck Society for
the Advancement of Science (MPG) and the University of Göttingen (Germany). We also thank all GenTree partners, the Slovenian Forestry Institute (Slovenian Research and Innovation Agency
grant P4-0107 and LIFEGENMON) and the Natural Resources Institute Finland (LUKE) for their contribution to sampling. This work was funded by European Union’s Horizon 2020 Research and
Innovation Programme grant agreement no. 676876; Academy of Finland grant nr. 287431 (T.P.); Swiss Secretariat for Education, Research and Innovation (SERI) contract no. 6.0032 (F.G.);
Spanish Ministry of Agriculture, Fisheries and Food (MAPAMA) grant no. AEG 17-048 (D.G.); European Agricultural Fund for Rural Development (EAFRD) (D.G.); Swedish Research Council for
Sustainable Development (FORMAS) grant nos. 2016-00780, 2020-01456 (M.L.); Spanish Ministry of Economy and Competitiveness (MINECO) contract n. PTA2015-10836-I (S.O.); LIFEGENMON (LIFE13
ENV/SI/000148) (M.W.); The Slovenian Research Agency, research core funding no. P4-0107 (M.W.); Biocenter Oulu (S.C.). FUNDING Open access funding provided by Uppsala University. AUTHOR
INFORMATION Author notes * These authors contributed equally: Pascal Milesi, Chedly Kastally, Benjamin Dauphin, Sandra Cervantes, Martin Lascoux, Tanja Pyhäjärvi. AUTHORS AND AFFILIATIONS *
Department of Ecology and Genetics, Evolutionary Biology Centre, Uppsala University, Uppsala, Sweden Pascal Milesi & Martin Lascoux * SciLifeLab, Uppsala University, Uppsala, Sweden
Pascal Milesi & Martin Lascoux * Department of Forest Sciences, University of Helsinki, Helsinki, Finland Chedly Kastally & Tanja Pyhäjärvi * Viikki Plant Science Centre, University
of Helsinki, Helsinki, Finland Chedly Kastally & Tanja Pyhäjärvi * Biodiversity and Conservation Biology, Swiss Federal Research Institute WSL, Birmensdorf, Switzerland Benjamin Dauphin,
Felix Gugerli, Lars Opgenoorth & Christian Rellstab * Department of Ecology and Genetics, University of Oulu, Oulu, Finland Sandra Cervantes * Biocenter Oulu, University of Oulu, Oulu,
Finland Sandra Cervantes * Institute of Biosciences and Bioresources, National Research Council of Italy (IBBR-CNR), Sesto Fiorentino, Italy Francesca Bagnoli, Sara Pinosio & Giovanni G.
Vendramin * Department of Forest Genetics and Forest Tree Breeding, Georg-August-University Goettingen, Göttingen, Germany Katharina B. Budde * Department of Forest Genetic Resources,
Northwest German Forest Research Institute, Hann. Münden, Germany Katharina B. Budde * UK Centre for Ecology & Hydrology (UKCEH), Bush Estate, UK Stephen Cavers * INRAE, URFM, Ecology of
Mediterranean Forests, Avignon, France Bruno Fady & Ivan Scotti * University of Paris-Saclay, INRAE, EPGV, Evry, France Patricia Faivre-Rampant * University of Bordeaux, INRAE, BIOGECO,
Cestas, France Santiago C. González-Martínez, Isabelle Lesur Kupin & Christophe Plomion * Institute of Forest Sciences (ICIFOR), INIA-CSIC, Madrid, Spain Delphine Grivet & Sanna
Olsson * INRAE, ONF, BioForA, Orléans, France Véronique Jorge & Odile Rogier * Helix Venture, Mérignac, France Isabelle Lesur Kupin * Department of Forest Biodiversity, Norwegian
Institute of Bioeconomy Research (NIBIO), Aas, Norway Dario I. Ojeda * Plant Ecology and Geobotany, Philipps-Universität Marburg, Marburg, Germany Lars Opgenoorth * Institute of Applied
Genomics (IGA), Udine, Italy Sara Pinosio * IGA Technology Services S.r.l., Udine, Italy Simone Scalabrin * Slovenian Forestry Institute, Ljubljana, Slovenia Marjana Westergren Authors *
Pascal Milesi View author publications You can also search for this author inPubMed Google Scholar * Chedly Kastally View author publications You can also search for this author inPubMed
Google Scholar * Benjamin Dauphin View author publications You can also search for this author inPubMed Google Scholar * Sandra Cervantes View author publications You can also search for
this author inPubMed Google Scholar * Francesca Bagnoli View author publications You can also search for this author inPubMed Google Scholar * Katharina B. Budde View author publications You
can also search for this author inPubMed Google Scholar * Stephen Cavers View author publications You can also search for this author inPubMed Google Scholar * Bruno Fady View author
publications You can also search for this author inPubMed Google Scholar * Patricia Faivre-Rampant View author publications You can also search for this author inPubMed Google Scholar *
Santiago C. González-Martínez View author publications You can also search for this author inPubMed Google Scholar * Delphine Grivet View author publications You can also search for this
author inPubMed Google Scholar * Felix Gugerli View author publications You can also search for this author inPubMed Google Scholar * Véronique Jorge View author publications You can also
search for this author inPubMed Google Scholar * Isabelle Lesur Kupin View author publications You can also search for this author inPubMed Google Scholar * Dario I. Ojeda View author
publications You can also search for this author inPubMed Google Scholar * Sanna Olsson View author publications You can also search for this author inPubMed Google Scholar * Lars Opgenoorth
View author publications You can also search for this author inPubMed Google Scholar * Sara Pinosio View author publications You can also search for this author inPubMed Google Scholar *
Christophe Plomion View author publications You can also search for this author inPubMed Google Scholar * Christian Rellstab View author publications You can also search for this author
inPubMed Google Scholar * Odile Rogier View author publications You can also search for this author inPubMed Google Scholar * Simone Scalabrin View author publications You can also search
for this author inPubMed Google Scholar * Ivan Scotti View author publications You can also search for this author inPubMed Google Scholar * Giovanni G. Vendramin View author publications
You can also search for this author inPubMed Google Scholar * Marjana Westergren View author publications You can also search for this author inPubMed Google Scholar * Martin Lascoux View
author publications You can also search for this author inPubMed Google Scholar * Tanja Pyhäjärvi View author publications You can also search for this author inPubMed Google Scholar
CONSORTIA ON BEHALF OF THE GENTREE CONSORTIUM * Pascal Milesi * , Chedly Kastally * , Benjamin Dauphin * , Sandra Cervantes * , Francesca Bagnoli * , Katharina B. Budde * , Stephen Cavers *
, Bruno Fady * , Patricia Faivre-Rampant * , Santiago C. González-Martínez * , Delphine Grivet * , Felix Gugerli * , Véronique Jorge * , Isabelle Lesur Kupin * , Dario I. Ojeda * , Sanna
Olsson * , Lars Opgenoorth * , Sara Pinosio * , Christophe Plomion * , Christian Rellstab * , Odile Rogier * , Simone Scalabrin * , Ivan Scotti * , Giovanni G. Vendramin * , Marjana
Westergren * , Martin Lascoux * & Tanja Pyhäjärvi CONTRIBUTIONS Conceptualization: St.C., S.C.G.M., D.G., M.L., P.M., T.P., and G.G.V. Methodology: K.B.B., P.F.R., S.C.G.M., C.K., M.L.,
P.M., S.P., T.P., C.R., and S.S. Software: K.B.B., B.D., C.K., S.P., T.P., S.S., and I.S. Validation: Sa.C., V.J., P.M., T.P., and S.S. Formal Analysis: F.B., K.B.B., Sa.C., B.D., P.F.R.,
S.C.G.M., D.I.O., V.J., C.K., I.L.K., P.M., L.O., S.P., C.P., T.P., C.R., O.R., and I.S. Investigation: F.B., S.C.G.M., D.G., F.G., V.J., M.L., I.L.K., P.M., S.O., L.O., C.P., T.P., C.R.,
I.S., and M.W. Resources: B.D., P.F.R., S.C.G.M., D.G., F.G., M.L., S.O., L.O., C.P., C.R., and I.S., Data curation: B.D., Sa.C., V.J., C.K., P.M., L.O., and T.P. Visualization: B.D., C.K.,
P.M., I.S., and M.W. Funding acquisition: St.C., B.F., S.C.G.M., D.G., F.G., M.L., S.O., L.O., T.P., G.G.V., and M.W. Project administration: St.C., B.F., S.C.G.M., F.G., M.L., L.O., T.P.,
and G.G.V. Supervision: F.B., S.C.G.M., F.G., V.J., M.L., L.O., C.P., T.P., C.R., G.G.V., and M.W. Writing – original draft: K.B.B., Sa.C., B.D., S.C.G.M., V.J., C.K., M.L., P.M., L.O.,
S.P., T.P., C.R., O.R., and I.S. Writing – review & editing: F.B., K.B.B., B.D., B.F., P.F.R., S.C.G.M., F.G., V.J., C.K., M.L., I.L.K., P.M., L.O., C.R., S.S., I.S., G.G.V., and M.W.
CORRESPONDING AUTHORS Correspondence to Pascal Milesi, Martin Lascoux or Tanja Pyhäjärvi. ETHICS DECLARATIONS COMPETING INTERESTS The authors declare no competing interests. PEER REVIEW PEER
REVIEW INFORMATION _Nature Communications_ thanks Olivier Hardy and the other, anonymous, reviewer(s) for their contribution to the peer review of this work. A peer review file is
available. ADDITIONAL INFORMATION PUBLISHER’S NOTE Springer Nature remains neutral with regard to jurisdictional claims in published maps and institutional affiliations. SUPPLEMENTARY
INFORMATION SUPPLEMENTARY INFORMATION PEER REVIEW FILE REPORTING SUMMARY DESCRIPTION OF ADDITIONAL SUPPLEMENTARY FILES SUPPLEMENTARY DATASET 1 SUPPLEMENTARY DATASET 2 SUPPLEMENTARY DATASET 3
SUPPLEMENTARY DATASET 4 SUPPLEMENTARY DATASET 5 SUPPLEMENTARY DATASET 6 SUPPLEMENTARY DATASET 7 SUPPLEMENTARY DATASET 8 SUPPLEMENTARY DATASET 9 SUPPLEMENTARY DATASET 10 SOURCE DATA SOURCE
DATA ZIP RIGHTS AND PERMISSIONS OPEN ACCESS This article is licensed under a Creative Commons Attribution 4.0 International License, which permits use, sharing, adaptation, distribution and
reproduction in any medium or format, as long as you give appropriate credit to the original author(s) and the source, provide a link to the Creative Commons licence, and indicate if changes
were made. The images or other third party material in this article are included in the article’s Creative Commons licence, unless indicated otherwise in a credit line to the material. If
material is not included in the article’s Creative Commons licence and your intended use is not permitted by statutory regulation or exceeds the permitted use, you will need to obtain
permission directly from the copyright holder. To view a copy of this licence, visit http://creativecommons.org/licenses/by/4.0/. Reprints and permissions ABOUT THIS ARTICLE CITE THIS
ARTICLE Milesi, P., Kastally, C., Dauphin, B. _et al._ Resilience of genetic diversity in forest trees over the Quaternary. _Nat Commun_ 15, 8538 (2024).
https://doi.org/10.1038/s41467-024-52612-y Download citation * Received: 15 December 2023 * Accepted: 11 September 2024 * Published: 14 October 2024 * DOI:
https://doi.org/10.1038/s41467-024-52612-y SHARE THIS ARTICLE Anyone you share the following link with will be able to read this content: Get shareable link Sorry, a shareable link is not
currently available for this article. Copy to clipboard Provided by the Springer Nature SharedIt content-sharing initiative