Play all audios:
ABSTRACT An unusual pattern among the scaling laws in nature is that the fastest animals are neither the largest, nor the smallest, but rather intermediately sized. Because of the enormous
diversity in animal shape, the mechanisms underlying this have long been difficult to determine. To address this, we challenge predictive human musculoskeletal simulations, scaled in mass
from the size of a mouse (0.1 kg) to the size of an elephant (2000 kg), to move as fast as possible. Our models replicate patterns observed across extant animals including: (i) an
intermediate optimal body mass for speed; (ii) a reduction in the cost of transport with increasing size; and (iii) crouched postures at smaller body masses and upright postures at larger
body masses. Finally, we use our models to determine the mechanical limitations of speed with size, showing larger animals may be limited by their ability to produce muscular force while
smaller animals are likely limited by their ability to produce larger ground reaction forces. Despite their bipedal gait, our models replicate patterns observed across quadrupedal animals,
suggesting these biological phenomena likely represent general rules and are not the result of phylogenetic or other ecological factors that typically hinder comparative studies. SIMILAR
CONTENT BEING VIEWED BY OTHERS DYNAMIC SIMILARITY AND THE PECULIAR ALLOMETRY OF MAXIMUM RUNNING SPEED Article Open access 11 March 2024 COORDINATING LIMBS AND SPINE: (PARETO-)OPTIMAL
LOCOMOTION IN THEORY, IN VIVO, AND IN ROBOTS Article Open access 22 July 2024 HUMANS USE MINIMUM COST MOVEMENTS IN A WHOLE-BODY TASK Article Open access 11 October 2021 INTRODUCTION Body
mass is the most obvious and arguably the most fundamental characteristic of an organism, impacting many important attributes of its life history, ecology, and evolution. Body size
correlates with metabolic rate, energy expenditure, diet, thermoregulation, and home range size1,2,3,4,5. A key theme linking these life history strategies to body size is locomotor ability.
The relationship between size and speed among all mammals has been extensively explored with the curious result that the fastest animals are not the largest nor the smallest but rather an
intermediate size6,7 (Fig. 1A). The predominance of this has been observed in quadrupedal mammals, yet the mechanistic origin of this curve is still a mystery. This is partly because it’s a
challenging question to tackle in diverse mammal groups owing to their variation in shape. Computational modelling offers a unique opportunity to explore this question because morphology and
musculoskeletal anatomy can be maintained the same while exploring the effects of body size, and the most detailed of these models are based on hominin form8. Throughout the history of
hominins, size has varied significantly–from the ~30 kg _Australopithecus afarensis_ (Lucy) 3–3.5 Ma to the ~80 kg _Homo erectus_ ~ 1.9 Ma. Generally, body mass has increased over time,
though often displaying a high degree of variability for each group of hominins (Supplementary Fig. 1a, b)9,10,11,12,13,14. For example, the isolated small-bodied individuals of _Homo
naledi_ (~0.3 Ma, ~37 kg) and _Homo floresiensis_ (~0.1 Ma, ~27 kg) represent important exceptions to this general growth rule15,16. The reasons for the rise and fall of body size over time
are not clear but have overall resulted in a mean body mass among modern humans of ~62 kg16. Previous studies have even argued that locomotor capacity, particularly endurance running, has
been instrumental in the evolution of the human body form15. Thus, hominins represent an important group for understanding how body size might influence locomotor performance, not only to
explore the extent to which this might have influenced hominin evolution, but also as a unique phenotype to explore the detailed patterns between size, speed, and movement economy. Recent
advances in physics-based musculoskeletal simulations have changed the way we can study movement. Numerical tools have increased the computational speed of simulations by 20-fold, enabling
us to predict novel movements based on first principles of the musculoskeletal system without the reliance on experimental data17,18,19. These techniques are important since large variation
in body mass are not often present in extant groups, and where changes in mass do occur, they are often associated with drastic changes in phylogenetic relatedness, body shape, diet, and
behaviour—making comparisons across scales of size challenging. In this work we created 3D computational models of the human musculoskeletal system across body masses ranging from 0.1 kg to
2000 kg (Fig. 1C). Musculoskeletal properties in each model were scaled with geometric similarity such that segment masses scaled as m1.0, linear dimensions of bones and muscles scaled as
m0.33, and muscle maximum isometric forces scaled as m0.67 (i.e. proportional to cross-sectional area). We generated predictive muscle-driven simulations in these models across a range of
gait speeds (Supplementary Movie 1) and examined how maximum speed and cost of transport vary across this 20,000-fold size range. We show that the speed-mass relationship displays a
hyperbolic pattern whereby locomotor speed is maximised at an intermediate body mass and that the simulated gaits at different body masses can reproduce the variation in posture and cost of
transport (COT) seen among the phylogenetically broad group of extant species for which this information is available. RESULTS SIMULATION FRAMEWORK FOR PREDICTING GAIT We solved for steady
state (i.e. periodic) gaits based on a musculoskeletal model that captured the dependency of muscle forces on excitation (constrained to be between zero and maximum possible excitation),
muscle cross-sectional area, fibre length, and contraction velocity. For each simulation, we prescribed movement speed and solved for the gait that minimized a cost function, which was
previously found to yield good similarity between simulated and empirical walking patterns19. Speed was increased (resolution of 0.05 m s−1) until that speed was no longer feasible given the
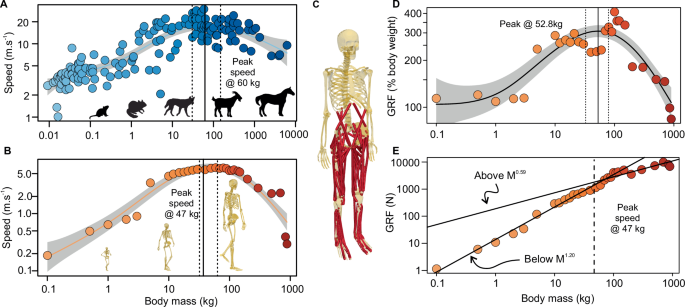
above physiological constraints. The maximum speed was defined as the highest speed for which a feasible solution was found. AN INTERMEDIATE OPTIMAL BODY MASS FOR MAXIMUM SPEED Among our 30
models ranging in body mass from 0.1 kg to 900 kg, we found a curvilinear relationship with maximum running speed, reflecting that seen in quadrupedal mammals and other animal groups (Fig.
1A, B6,7). Simulations based on our largest models of 1000 kg, 1500 kg and 2000 kg failed to converge to a feasible solution, meaning that there was no physiologically feasible (i.e.
consistent with musculoskeletal dynamics) solution for moving forward with a bipedal steady-state gait. This suggests that substantial allometric changes to the musculoskeletal system would
be necessary for this phenotype to be capable of locomotion, and possibly putting an upper limit on body mass variation in hominins. Of the body masses tested, 60 kg was the fastest—capable
of running at 6.3 m s−1; from the statistical fit to all masses, the estimated optimal body mass that maximized speed was ~47 kg (95% CIs 33-63 kg). This is similar to the body mass at
optimum speed reported among quadrupeds (60 kg; CIs 29–152 kg) (Fig. 1A). Further, this body size range encompasses much of the variation in body mass among hominin evolution, with the
fastest 60 kg model closely resembling the average body mass (62 kg) of modern-day _Homo sapiens_ (Supplementary Fig. 1a, b14). Reduced locomotor capacity, among other life-history traits,
might explain why small body size was only capable of persisting in isolated populations (e.g. _Homo naledi, Homo floresiensis_) and why larger-bodied mid-Pleistocene hominins were replaced
by smaller-bodied modern species14. Together, this suggests that locomotor speed may have been an important contributor to the success of modern-day hominins. SIMULATION PREDICTIONS ARE
SUPPORTED WITH EMPIRICAL DATA To support the predictions from our simulations, we evaluated gait features between our 60 kg and 80 kg model against experimental data from walking and running
humans which spanned a similar body size range. The simulated data were consistent with experimental data across a range of movement speeds (Fig. 2). Variations in lower limb stride
parameters and kinetics mirrored those reported in modern-day humans. Increases in locomotor speed were accompanied by increases in ground reaction forces, decreases in ground contact time
(i.e. stance time), and increases in stride length (Fig. 2). For example, peak ground reaction forces increased consistently between 2 m s−1 and 6 m s−1 for the experimental results and the
simulation predictions. Previous studies within extant humans have suggested that maximum running speeds are limited by how forcefully a human can strike the ground20. Surprisingly, slow and
fast runners take approximately the same time to swing their legs21 but the fastest runners achieve their higher top speeds by applying greater forces to the ground in shorter periods of
time20,21. Intriguingly, this result also appears to be supported in our data over a wide range of body masses (Fig. 3). Between masses of 1 kg to ~100 kg, swing time varies only slightly
(Fig. 3C), suggesting that models reach faster top speeds, not by repositioning their limbs more rapidly in the air, but by applying greater support forces to the ground. This is consistent
with empirical data in humans collected by us (Fig. 2D) and others20,21 and is supported by the simulated vertical ground reaction forces, which peak near the fastest model (Fig. 1D, ~53 kg,
CIs 33–79 kg, Supplementary Fig. 2) – suggesting a force limit to maximum running speed. Thus, results from in silico and in vivo approaches both support the hypothesis that maximum running
speeds are achieved by greater ground reaction forces, not by more rapid leg movements. DISCUSSION What limits the larger and smaller body sizes from moving faster? Greater movement speeds
are achieved by applying greater ground reaction forces (Fig. 2D, E), so what limits the smaller and larger (slower) models from generating greater forces? The maximum force a muscle is
capable of producing during locomotion is a product of its cross-sectional area, its position in the musculoskeletal system (e.g. moment arms about joints), along with its neuro-mechanical
properties including muscle activation, force-length and force-velocity relationships22. Our musculoskeletal model allowed us to explore the mechanisms that enable or limit speed across
multiple scales—spanning from the level of whole body to the joint- and the individual muscle. Among geometrically similar animals, the cross-sectional area of muscle is expected to increase
with mass0.66. Stress depends on the amount of force applied over a certain cross-sectional area, and because the force a muscle must support is expected to increase with mass1.0, geometric
scaling predicts that the stresses placed on bones and muscles will increase with mass0.33. Therefore, if the cross-sectional area of muscle was limiting the ability to produce forces, we
might expect a gradual decline in speed among all body masses. This certainly could explain the decrease in speed above the optimal body mass for maximum speed. In fact, our results predict
an increase in peak absolute vertical ground reaction force that scales as m0.59 above 60 kg; this nearly matches the expected change in force due to the geometric scaling of muscle
cross-sectional area (Fig. 1E). Thus, the reduction in speed at body masses >60 kg might be necessary to keep muscle forces within the physiological constraints dictated by
cross-sectional area. To test this hypothesis, we determined the safety factors (i.e. the ratio of maximal muscle stress/observed muscle stress) for the hip extensors, knee extensors, and
ankle extensors for each of our models. As expected, the safety factors for the hip and ankle extensors are low for the ~60 kg model and continue to stay low for body masses >60 kg (Fig.
3E, G). As size increases safety factors for the knee extensors increase (Fig. 3F). This suggests that strength in the ankle and hip extensor musculature limits maximum locomotor speed at
larger body sizes. Yet, if safety factors were the ultimate limit to speed, then we might expect the smallest models to run the fastest, however, this is not observed in neither empirical
data nor simulations. The stresses acting on muscles in dynamic systems are complicated as the relative orientation of muscles to the ground reaction force vector will depend on the posture
of the animal. Among a diverse group of quadrupedal mammals, posture tends to change predictably, with smaller mammals moving with a crouched posture, in which their limbs are flexed
underneath their body, whereas larger animals move with an upright posture using extended limb joints23,24. Our simulations appear to recapitulate this. Smaller models locomote with crouched
postures where mean joint angles at the hip, knee, and ankle all trend toward an upright posture at the largest body masses (Supplementary Figs. 3, 4; Supplementary Movie 2). These results
are also consistent with alterations in lower limb kinematics with obesity, whereby obese individuals walk with their lower limb joints ∼6 deg. more extended compared to lighter individuals
moving at similar speeds25. These changes in posture will influence the effective mechanical advantage (EMA) of limb joints, measured as the ratio of the ground reaction force to the
extensor muscle force acting about each joint. Previous studies have shown that by becoming more upright, larger animals can reduce the stresses acting on the musculoskeletal system, as more
upright limbs can balance joint moments with lower muscle forces than expected for their size23,24. Our simulations show not only an increase in EMA with body mass but that this change
occurs at a similar rate to that seen among quadrupedal mammals (Fig. 4A, B). As the models become larger, a reduction in ground reaction forces and more upright postures result from a
reduction in peak forces with respect to body weight. This might then explain the reduction in speed above the fastest model. However, it does not explain why speed, and ground reaction
forces, are reduced below this mass, nor can it explain why smaller body masses adopt a crouched posture. Previous conceptual models have suggested that small animals may be prevented from
higher speeds owing to the muscle power demands during the stance phase26, or from the potential constraint of activating muscles at relatively high absolute frequencies27. More recently,
theoretical models suggest that no one limiting factor applies across all body sizes, but rather smaller animals (<54 kg) are limited by the kinetic energy capacity of muscle, and larger
animals by the work capacity of muscle28. Our simulation framework enables us to expand upon and test these ideas, providing a mechanistic link for reductions in speed at smaller and larger
sizes. We can begin by exploring a muscle-level explanation. These conceptual models suggest that when a muscle contracts against a sufficiently large mass, the impulse, work and speed it
can produce is limited by its strain capacity, termed the ‘Borelli limit’28,29. Our models, in part, support this as maximum muscle fibre strains (measured as minimum normalized fibre length
during stance) generally increased in the extensor muscles that cross the knee and ankle joints, but not the hip (Supplementary Fig. 5a–c). This highlights how strain and stress (as earlier
indicated by lower safety factors) might be important components in the limits of GRF production in larger models. At the other end of the scale, these conceptual models predict that
muscles which contract against a small load reach a ‘Hill limit’, where the impulse, work and speed produced are limited by the maximum strain rate of the muscle28,29. Here our models
deviate from this theory. When the maximum strain rate is extracted and averaged for the hip, knee and ankle extensors (Supplementary Fig. 5d–f), none appear to show smaller-sized models
with exceptionally high strain rates in comparison to larger models. The reason for this disparity is likely because previous conceptual models do not capture the dynamically changing
posture adopted by models during the stance phase. Instead, we need to consider the interaction between muscle forces and varying kinematic parameters among different limb joints. Based on a
ground reaction force limitation, we hypothesize that small models appear to maximize work output by adopting a crouched posture to enable (relatively) larger ground reaction forces.
Smaller animals generally cannot produce higher ground reaction forces since increasing the force applied to the ground will cause an earlier aerial phase30,31. The small models appear to
compensate for this reduction in contact time by adopting a more crouched posture (Supplementary Fig. 3, 4a–c). This crouched posture allows them to flex their limbs more during the stance
phase (Supplementary Fig. 4d–f), extending the time they are in contact with the ground (Fig. 3D), and thus allowing them to produce a (relatively) greater impulse. However, the longer
stance phase will also limit stride frequency. As stance time increases, stride frequency must decrease. This is evident in the close match (similar inflection point) of stride frequency and
stance time displayed in Fig. 3B, C. The trade-off between stance time and stride frequency ultimately limits the speed the smaller models can achieve (Fig. 3B, Supplementary Fig. 3a–c).
Speed at smaller body sizes appears limited by the ability to stay on the ground long enough to produce higher ground reaction forces, while speed at larger body sizes is limited by the
ability of the muscular system to produce forces. At intermediate body sizes an optimal trade-off between both constraints is achieved, leading to maximal speeds. We further explored the
effects of the athletic phenotype on locomotor performance. Top speeds among elite sprinters have been recorded at >10.4 m s−1, well exceeding that of our fastest model (6.3 m s−1). To
further test whether muscle force limits maximum speed, we predicted locomotor performance for humans of greater athleticism. To do this, we created an ‘athletic’ model whereby individual
muscle strengths were varied to match the phenotype of sprinters. We adjusted maximum isometric force, and thus force-generating capacity of lower limb muscles (by values ranging from +54%
to −8% on a muscle-specific basis) to represent the hypertrophied musculature in elite sprinters32. We performed predictive simulations of maximum speed running, and perhaps unsurprisingly,
humans with athletic phenotypes were capable of running 0.3 m s−1 faster when compared to a musculoskeletal model of a generic/average human (Fig. 2A, B). This increase in speed is
relatively small compared to the measured differences in maximum running speed between healthy humans and elite sprinters. The modest improvement may be attributed to elite sprinters
representing just one athletic phenotype and muscle size being one of many physiological traits that have been shown to influence locomotor performance. For example, elite sprinters have
longer toes and smaller Achilles tendon moment arms33 as well as a predominance of fast-twitch (type II) fibres in their leg muscles34—adaptations that are all suggested to increase running
speed. Simulations have also demonstrated that maximum running speed is sensitive to the shape of the force-velocity relationship of skeletal muscle35. Here, we have altered just one
morphological feature, muscle strength, and it is likely that top speeds in elite sprinters are achieved via a complex combination of morphological, physiological, and genetic factors.
Predictive simulations provide the ideal framework to test these and other questions about links between form and function. Future studies can apply these tools to explore the impacts of
anatomical variability, for example across world-class athletes, hominin species, or individuals with musculoskeletal diseases. Although maximum speed is critical for escape or predation
events, animals rarely locomote at their top speed during everyday movement, instead choosing gait speeds that tend to minimize energy use36,37. It has even been suggested that the
transition from our semi-quadrupedal ancestors (e.g. chimpanzees) onto a primarily bipedal gait, a defining feature of the earliest hominins, evolved to reduce locomotor costs38. Here, we
show that the minimum cost of transport (COT), a proxy for locomotor economy (i.e. the energy expended to move 1 kg of body mass 1 m) decreases with increasing body mass, to the 700 kg model
(Fig. 4C). Smaller models incur higher costs likely owing to their crouched posture, with a strong relationship between COT and posture reported among our models (Supplementary Fig. 6d-f).
Locomotion with flexed limbs reduces the mechanical advantage and increases the required muscle forces, and thus the energy needed to propel the body forward39,40. Beyond 700 kg, COT
increased rapidly, with the 850 and 900 kg models showing a much higher COT, and appearing to pay an energetic price for moving at such slow speeds (<0.3 m s−1). These results are
consistent with mammals, which show a decrease in the COT across a size range from a 0.007 kg pygmy house mouse to a 254 kg zebu cattle41 (Fig. 4D). Above this mass the COT again rises
rapidly, with the COT for the world’s largest living land animals, African and Asian elephants, falling above confidence intervals for other mammals42. Predictive musculoskeletal simulations
are a uniquely powerful technique to explore the limits of locomotor speed and economy with body size. Locomotion emerges from complex interactions between the nervous, the muscular, and
the skeletal systems. Previously it has been challenging to determine the influence of body size on biomechanical or physiological outcomes beyond the size range we observe in extant
species43. Even within this range, without modelling, it remains difficult to understand how the properties of each sub-system influence performance, because experiments designed to isolate
or manipulate independent parts of the whole system are limited, if not impossible. Here, we show that changing one parameter (body mass) in a physics-based model of the musculoskeletal
system explains three biological phenomena: (i) an intermediate optimal body mass for speed6,7; (ii) a reduction in the cost of transport with increasing body mass41; and (iii) the presence
of crouched postures at smaller body sizes and erect postures at larger body sizes23. We show that there is not one limitation to maximum movement speed, but rather the limitation arises
from an interaction with body mass. Muscle force appears to limit speed in large body masses, with a ground reaction force limitation at smaller body sizes. Remarkably these biological
patterns emerge independent of pedalism, with patterns of speed, posture and COT showing similar trends for both quadrupedal and bipedal gaits. This suggests that the size-dependent limits
to locomotion explored here reflect generalized rules that can predict how an animal of any size will move, with the effects of limb use likely having a much smaller effect. Our findings
provide insights into where the limits of locomotor performance lie, independent of evolutionary pressures which have guided the phenotypes of extant and extinct animals. METHODS
MUSCULOSKELETAL MODEL To simulate human locomotion, we used a full body OpenSim musculoskeletal model with 29 degrees of freedom (6 between the pelvis and ground; 3 at each hip; 1 at each
knee; and 2 at each ankle; 3 at the lumbar joint between the trunk and pelvis; and 4 per arm)8,44 (Fig. 1C). The musculoskeletal model was driven by 92 muscle-tendon units actuating the
lower limbs and the trunk (43 per leg and 6 actuating the lumbar joint), 8 ideal torque actuators at the arms. Foot-ground contact was modelled by 6 contact spheres per foot and a compliant
Hunt-Crossley contact model45. To model ligaments and other passive tissues, we added passive stiffness and linear damping to the lower limb joints46. We modelled skeletal motion based on
rigid-body dynamics8,45. Model parameters were consistent with previous data-driven simulations of human movement19. Each muscle-tendon unit actuator was modelled as a massless Hill-type
muscle model with excitation-activation dynamics based on Raasch et al.47. The normalized force–length and force–velocity relationships of muscle were represented by active and passive
contractile dynamics defined by muscle fibre length and pennation angle, while the passive force–length properties of the tendon were represented by an in-series, non-linear elastic
element18. The intrinsic properties of the muscles and tendons were defined by the optimal fibre length (lo), maximal contraction velocity (Vmax), maximum isometric force (Fmax), as well as
tendon slack length and pennation angle at lo. Muscle-tendon lengths, velocities, and moment arms were defined as a polynomial function of joint positions and velocities to increase
computational speed19. SCALING OF MODEL SIZE AND MUSCULOSKELETAL PROPERTIES We scaled the generic musculoskeletal model to create 33 models across a body size range of 0.1 kg to 2000 kg.
Musculoskeletal properties in each model were scaled according to geometric similarity. Segment mass, inertia, and linear dimensions were scaled as m1.0, m1.67 and m0.33, respectively.
Maximum isometric force, Fmax was scaled with m0.67 given that a muscle's maximum isometric force is proportional to its cross-sectional area. Linear dimensions for segments of the
skeleton, as well as muscle-tendon properties, optimal fibre length, and tendon slack length were scaled with m0.33. Pennation angle and Vmax remained size invariant across all models. While
we appreciate that these scaling exponents may differ from empirical data whereby musculoskeletal parameters scale with positive or negative allometry (e.g. refs. 7,48,49,50), however,
there is a lack of robust data sets which span a similar body size range in hominins, which means we would be forced to extrapolate from a smaller dataset. Further, many of the changes we
observe in muscle and bone size can often be attributed to phylogenetic history rather than the direct result of size, which also tends to bias empirical data sets (see ref. 43). Finally, by
using geometric scaling, our simulations act as a ‘null hypothesis’ against which empirical data can be compared, thus providing an opportunity for further analysis. OPTIMAL CONTROL
FRAMEWORK We used a previously established predictive muscle-driven simulation framework18,19 to generate simulations at different gait speeds ranging from 0.1 m s−1 to 6.6 m s−1 in
increments of ~0.1 m s−1. Here we briefly summarize the optimal control framework, as the details of the problem formulation have been previously described19. We formulated predictive
simulations of gait as optimal control problems. We identified muscle excitations and the gait cycle duration that minimised a multi-objective cost function (Eq. 1) while satisfying
constraints that represented musculoskeletal dynamics. We imposed left–right symmetry (steady-state gaits) and prescribed gait speed ranging from 0.1 to 6.6 m s−1 (defined as the distance
travelled by the pelvis divided by the gait cycle duration). To solve the optimal control problem, we used direct collocation methods17,51, which overcome challenges owing to the stiffness
of the differential equations describing muscle and skeleton dynamics. Due to the stiff differential equations, a small change in muscle excitations can have a large impact on the simulated
movement pattern and cost function. In contrast to shooting methods that integrate the dynamics over the entire time horizon, direct collocation reduces the sensitivity of the cost function
to the optimization variables by reducing the time horizon of the integration. Controls and states are discretized and the discretized dynamic equations are imposed as constraints. These
constraints are only guaranteed to be met in the optimal solution meaning that optimization variables at intermediate iterations might not be dynamically consistent. The muscle–tendon
dynamics and the dynamics of the musculoskeletal system were implicitly formulated18,52 to further improve the numerical conditioning of the problem, and we imposed activation dynamics by
linear constraints such that muscle excitations were eliminated from the control problem to further reduce computation time. Excitations could be computed in post-processing and never
exceeded the physiological range (0–1)51. MULTI-OBJECTIVE COST FUNCTION We used a multi-objective cost function that describes trade-offs between physiologically important performance
criteria and consisted of five terms19, metabolic energy rate, muscle activity, joint accelerations, passive joint torques and arm excitations: $$J=\frac{1}{d}{\int
}_{\!\!\!\!\!0}^{{t}_{f}}\left({w}_{1}\parallel \dot{E}{\parallel }_{2}^{2}+{w}_{2}\parallel a{\parallel }_{2}^{2}+{w}_{3}\parallel {u}_{{{{\rm{dv}}}},{{{\rm{lt}}}}}{\parallel
}_{2}^{2}+{w}_{4}\parallel {T}_{{{{\rm{p}}}}}{\parallel }_{2}^{2}+{w}_{5}\parallel {e}_{{{{\rm{arms}}}}}{\parallel }_{2}^{2}\right){dt}$$ (1) where _d_ is the distance travelled by the
pelvis in the forward direction, _t__f_ is half gait cycle duration, \(\dot{E}\) is the metabolic energy rate, _a_ is the muscle activation, \({u}_{{{{\rm{dv}}}},{{{\rm{lt}}}}}\) are angular
lower limb and trunk joint accelerations, _T_p are passive joint torques, _e_arms are the excitations for the ideal actuators driving the arms, _t_ is time, and _w_1-5 were the weights for
each of the five terms. The metabolic energy rate was based on a phenomenological model described by Bhargava et al.53 with parameters for fibre type composition and muscle-specific tension
taken from the literature54. This model accounts for temperature differences in frog and human muscle when calculating activation and maintenance heat rates but does not account for the
recruitment of different fibre types across various movement speeds, which may influence energetics. The cost function was proposed because it outperformed alternative cost functions in
predicting walking mechanics and was found to capture how gait mechanics and energetics vary with speed19. We formulated the optimal control problem for each model-speed combination with a
maximum of 10,000 iterations. Our criterion to establish the maximum gait speed at each body size were: (i) a feasible solution within 10,000 iterations, and (ii) the simulated ground
reaction force characterised by a defined ground contact phase and an aerial phase. Supplementary Fig. 7 shows that most simulations converged in <1000 iterations. 10,000 reflects a very
conservative limit, under which we expect all simulations to converge if a feasible solution exists. All optimal control problems were solved using Matlab (Mathworks Inc., Natick, USA) in
conjunction with automatic differentiation using a nonlinear optimizer (CasADi55). We started each optimization with a quasi-random initial guess that did not rely on any experimental data.
Varying the initial guess, for example between data-informed and quasi-random, has little influence on the predicted gait patterns19. Details regarding how the quasi-random guess is defined
are provided in Falisse et al. 2019 (see Table S1 in ref. 19), briefly, the model was placed in anatomical position and tracked forward at the prescribed speed given a constant value of 0.1
for muscle states. Our framework predicted a continuum of walking and running gaits as we varied the prescribed speed. Prescribed speeds were increased in increments of 0.1 m s−1 until no
feasible solution could be found. Thereafter we began at the highest speed which did result in a feasible solution and increased speed by an increment of 0.05 m s−1 to obtain a resolution of
0.05 m s−1 for maximum speed. Within this particular simulation framework, it is possible to use maximum speed as the objective. However, while piloting such approach, we found that doing
so gave poor convergence, meaning that we could not find a solution across many iterations. Therefore, we chose to prescribe speed and increased the prescribed speed until the optimization
problem no longer converged because there was no feasible solution. We note that the same maximal speed should result from both methods. Based on the simulated gaits, we determined locomotor
function across scales including variables that ranged from the whole body (stride parameters, ground reaction forces, COT), to the joint (range of motion, angular velocity), and the
individual muscle (forces, activation, strain rates). Whereas the cost function might influence gait mechanics at submaximal speeds, we do not expect that altering the cost function would
have an influence on maximal gait speed, since maximal gait speed is determined by feasibility, i.e. by the existence of a gait solution that complies with musculoskeletal dynamics and the
bounds on muscle excitations for the imposed movement speed. SAFETY FACTORS Safety factors, also known as factors of safety56,57, were determined from the predicted peak muscle stresses,
normalized to maximum isometric stress, over the stance phase for each extensor muscle at the hip, knee, and ankle joints. Each musculoskeletal model comprised 11 hip extensors, 4 knee
extensors, and 8 ankle extensors (i.e. plantarflexors) (See Supplementary Table 1 for details). For each group of muscles at each joint, we determined the mean normalized peak muscle stress
and calculated the inverse of this value to quantify the safety factor for each muscle group. EFFECTIVE MECHANICAL ADVANTAGE Effective mechanical advantage (EMA) was calculated for each
joint as the ratio of the ground reaction force impulse to the muscle force impulse over the stance phase of gait. The magnitude of the resultant ground reaction force was calculated as the
square root of the sum of the squared forces from the three ground force components. The sum of the muscle forces acting about each lower limb joint was determined from the simulations.
Ground reaction force and muscle impulses were then calculated as the integral of the ground reaction force and muscle force magnitude over the stance phase, respectively. COST OF TRANSPORT
The minimum cost of transport (COT) was determined for each musculoskeletal model across the size range by plotting COT (the energy expended to move 1 kg of body mass 1 m) against speed for
each body mass and using a generalized additive statistical model to find the minimum predicted value (Supplementary Fig. 8). HUMAN GAIT EXPERIMENTS Seven healthy adults (4 males, 3 females)
participated in this study after providing written informed consent in accordance with the University of Queensland Human Research Ethics (2022/HE001089) (average ± SD; age, 28.4 ± 7.5
years; height, 1.7 ± 0.2 m; mass, 66.1 ± 4.8 kg). Participants performed walking and running trials on an instrumented treadmill (ITC-21-20L, Bertec Corp., Ohio, USA). Following a 5 min
warm-up, participants were strapped into an upper-body harness suspended from the ceiling. We collected ground reaction forces (2000 Hz) at speeds ranging from 1.5 m s−1 to 6.5 m s−1 with
speed increments of 0.5 m s−1. Each trial began with the participants standing on the stationary left belt of the treadmill and moving onto the right belt whilst supporting their weight with
a handrail located at the front of the treadmill. Participants transferred their weight from the handrails while initiating the leg movements necessary to begin walking or running on the
moving treadmill belt. The transition from assisted to unassisted running typically occurred over 2–5 strides and force data was recorded only during unassisted gait. All walking and running
trials lasted ~30 s. After each speed, participants were instructed to recover fully, which typically took 15–60 s. Stride parameters were determined from vertical ground reaction forces
over 10–15 strides for each speed. Stance time was determined from the time the applied force exceeded baseline noise (~0 N) on the force plate (experimental data) or 10% of body weight
(simulated data). Stride time was determined as the time between consecutive footfalls of the same foot. Stride frequency was calculated as the inverse of stride time. Stride length
corresponded to the belt distance travelled between successive contact periods of the same foot and was calculated by dividing the treadmill velocity by stride frequency. BUILDING AN
ATHLETIC PHENOTYPE MUSCULOSKELETAL MODEL To investigate the influence of an athletic phenotype on maximum running speed, we altered the strength of lower limb muscles and generated
predictive simulations of running at speeds of 6.3–6.6 m s−1. We adjusted the maximum isometric force of 43 lower limb muscles per leg in the 60 kg model to represent the hypertrophied
musculature of elite sprinters, measured using magnetic resonance imaging32. Alterations in maximum isometric force were modified for each muscle independently based on differences in muscle
volumes between sprinters and non-sprinters, and ranged from +54% to −8%. Our criterion to establish the maximum gait speed in this athletic model was consistent with previous models.
STATISTICS For analysis only the maximum speed that was capable of successfully compiling, was retained for further analysis for each model. All mass, speed and linear dimensions were log
transformed before analysis to normalise the data. Given the non-linear response in nearly all of our variables, we used generalized additive models (GAMs) to explore how each variable
changed with body size, implemented using the gam.R function from the mgcv package in R (v1.8-2458). The body mass at which each variable reached its maximum or minimum was determined using
the predict.gam function, including a sequence of 1000 mass points between 0.1 kg and 1000 kg. Confidence intervals for the peak were similarly estimated using the predict.gam function with
Type= ‘lpmatrix’ to return the linear prediction matrix, which was used to estimate prior probabilities. The uncertainty in the model was estimated by simulating 1000 models with the same
model coefficients and covariance matrix as our model using the mvrnorm function from the MASS package. Confidence intervals were then extracted using the quantile.R function in R. The data
generated in this study are provided in the Source Data file, and code to reproduce these results are available here https://doi.org/10.6084/m9.figshare.25921297.v3. REPORTING SUMMARY
Further information on research design is available in the Nature Portfolio Reporting Summary linked to this article. DATA AVAILABILITY All data are available in the main text or the
supplementary materials, and can also be found here https://doi.org/10.6084/m9.figshare.25921297.v3. Source data are provided with this paper. CODE AVAILABILITY Code to reproduce the figures
and results can be found here https://doi.org/10.6084/m9.figshare.25921297.v3. REFERENCES * Peters, R. H. & Peters, R. H. _The ecological implications of body size_. Vol. 2 (Cambridge
university press, 1986). * Damuth, J. D., Damuth, J., MacFadden, B. J. & John, D. _Body size in mammalian paleobiology: estimation and biological implications_. (Cambridge University
Press, 1990). * Lindstedt, S. L., Miller, B. J. & Buskirk, S. W. Home range, time, and body size in mammals. _Ecology_ 67, 413–418 (1986). Article Google Scholar * Cardillo, M. et al.
Multiple causes of high extinction risk in large mammal species. _Science_ 309, 1239–1241 (2005). Article ADS CAS PubMed Google Scholar * Speakman, J. R. Body size, energy metabolism
and lifespan. _J. Exp. Biol._ 208, 1717–1730 (2005). Article PubMed Google Scholar * Garland, T. The relation between maximal running speed and body mass in terrestrial mammals. _J.
Zool._ 199, 157–170 (1983). Article Google Scholar * Dick, T. J. & Clemente, C. J. Where have all the giants gone? How animals deal with the problem of size. _PLoS Biol._ 15, e2000473
(2017). Article PubMed PubMed Central Google Scholar * Delp, S. L. et al. OpenSim: open-source software to create and analyze dynamic simulations of movement. _IEEE Trans. Biomed. Eng._
54, 1940–1950 (2007). Article PubMed Google Scholar * Antón, S. C., Potts, R. & Aiello, L. C. Evolution of early Homo: An integrated biological perspective. _science_ 345, 1236828
(2014). Article PubMed Google Scholar * Foley, R. _Another unique species: Patterns in human evolutionary ecology_. (Pearson/Education, 1987). * McHenry, H. M. in _Evolutionary history of
the “robust” australopithecines_ 133–148 (Aldine de Gruyter New York, 1988). * McHenry, H. M. Femoral lengths and stature in Plio‐Pleistocene hominids. _Am. J. Phys. Anthropol._ 85, 149–158
(1991). Article CAS PubMed Google Scholar * Pontzer, H. Ecological energetics in early Homo. _Curr. Anthropol._ 53, S346–S358 (2012). Article Google Scholar * Will, M., Pablos, A.
& Stock, J. T. Long-term patterns of body mass and stature evolution within the hominin lineage. _R. Soc. open Sci._ 4, 171339 (2017). Article PubMed PubMed Central Google Scholar *
Bramble, D. M. & Lieberman, D. E. Endurance running and the evolution of Homo. _nature_ 432, 345–352 (2004). Article ADS CAS PubMed Google Scholar * Grabowski, M., Hatala, K. G.,
Jungers, W. L. & Richmond, B. G. Body mass estimates of hominin fossils and the evolution of human body size. _J. Hum. Evolut._ 85, 75–93 (2015). Article Google Scholar * Ackermann, M.
& Van den Bogert, A. J. Optimality principles for model-based prediction of human gait. _J. Biomech._ 43, 1055–1060 (2010). Article PubMed PubMed Central Google Scholar * De Groote,
F., Kinney, A. L., Rao, A. V. & Fregly, B. J. Evaluation of direct collocation optimal control problem formulations for solving the muscle redundancy problem. _Ann. Biomed. Eng._ 44,
2922–2936 (2016). Article PubMed PubMed Central Google Scholar * Falisse, A. et al. Rapid predictive simulations with complex musculoskeletal models suggest that diverse healthy and
pathological human gaits can emerge from similar control strategies. _J. R. Soc. Interface_ 16, 20190402 (2019). Article PubMed PubMed Central Google Scholar * Weyand, P. G., Sandell, R.
F., Prime, D. N. & Bundle, M. W. The biological limits to running speed are imposed from the ground up. _J. Appl. Physiol._ 108, 950–961 (2010). Article PubMed Google Scholar *
Weyand, P. G., Sternlight, D. B., Bellizzi, M. J. & Wright, S. Faster top running speeds are achieved with greater ground forces not more rapid leg movements. _J. Appl. Physiol._ 89,
1991–1999 (2000). Article CAS PubMed Google Scholar * Zajac, F. E. Muscle and tendon: properties, models, scaling, and application to biomechanics and motor control. _Crit. Rev. Biomed.
Eng._ 17, 359–411 (1989). CAS PubMed Google Scholar * Biewener, A. Scaling body support in mammals: limb posture and muscle mechanics. _Science_ 245, 45–48 (1989). Article ADS CAS
PubMed Google Scholar * Biewener, A. A. Biomechanical consequences of scaling. _J. Exp. Biol._ 208, 1665–1676 (2005). Article PubMed Google Scholar * DeVita, P. & Hortobágyi, T.
Obesity is not associated with increased knee joint torque and power during level walking. _J. Biomech._ 36, 1355–1362 (2003). Article PubMed Google Scholar * Usherwood, J. & Gladman,
N. Why are the fastest runners of intermediate size? Contrasting scaling of mechanical demands and muscle supply of work and power. _Biol. Lett._ 16, 20200579 (2020). Article CAS PubMed
PubMed Central Google Scholar * Daley, M. A. & Birn-Jeffery, A. Scaling of avian bipedal locomotion reveals independent effects of body mass and leg posture on gait. _J. Exp. Biol._
221, jeb152538 (2018). Article PubMed Google Scholar * Labonte, D., Bishop, P. J., Dick, T. J. & Clemente, C. J. Dynamic similarity and the peculiar allometry of maximum running
speed. _Nat. Commun._ 15, 2181 (2024). Article ADS CAS PubMed PubMed Central Google Scholar * Labonte, D. A theory of physiological similarity in muscle-driven motion. _Proc. Natl
Acad. Sci._ 120, e2221217120 (2023). Article MathSciNet CAS PubMed PubMed Central Google Scholar * Channon, A. J., Usherwood, J. R., Crompton, R. H., Günther, M. M. & Vereecke, E.
E. The extraordinary athletic performance of leaping gibbons. _Biol. Lett._ 8, 46–49 (2012). Article PubMed Google Scholar * Bennet-Clark, H. Scale effects in jumping animals. _Scale
Effects in Animals Locomotion_ 185 (1975). * Handsfield, G. et al. Adding muscle where you need it: non‐uniform hypertrophy patterns in elite sprinters. _Scand. J. Med. Sci. Sports_ 27,
1050–1060 (2017). Article CAS PubMed Google Scholar * Lee, S. S. & Piazza, S. J. Built for speed: musculoskeletal structure and sprinting ability. _J. Exp. Biol._ 212, 3700–3707
(2009). Article PubMed Google Scholar * Gollnick, P., Armstrong, R., Saubert, C. 4th, Piehl, K. & Saltin, B. Enzyme activity and fiber composition in skeletal muscle of untrained and
trained men. _J. Appl. Physiol._ 33, 312–319 (1972). Article CAS PubMed Google Scholar * Miller, R. H., Umberger, B. R. & Caldwell, G. E. Limitations to maximum sprinting speed
imposed by muscle mechanical properties. _J. Biomech._ 45, 1092–1097 (2012). Article PubMed Google Scholar * Hoyt, D. F. & Taylor, C. R. Gait and the energetics of locomotion in
horses. _Nature_ 292, 239–240 (1981). Article ADS Google Scholar * Ralston, H. J. Energy-speed relation and optimal speed during level walking. _Int. Z. f.ür. Angew. Physiologie Einschl.
Arbeitsphysiologie_ 17, 277–283 (1958). CAS Google Scholar * Sockol, M. D., Raichlen, D. A. & Pontzer, H. Chimpanzee locomotor energetics and the origin of human bipedalism. _Proc.
Natl Acad. Sci._ 104, 12265–12269 (2007). Article ADS CAS PubMed PubMed Central Google Scholar * Biewener, A. A., Farley, C. T., Roberts, T. J. & Temaner, M. Muscle mechanical
advantage of human walking and running: implications for energy cost. _J. Appl. Physiol._ 97, 2266–2274 (2004). Article PubMed Google Scholar * Roberts, T. J., Kram, R., Weyand, P. G.
& Taylor, C. R. Energetics of bipedal running. I. Metabolic cost of generating force. _J. Exp. Biol._ 201, 2745–2751 (1998). Article CAS PubMed Google Scholar * Taylor, C. R.,
Heglund, N. C. & Maloiy, G. M. Energetics and mechanics of terrestrial locomotion. I. Metabolic energy consumption as a function of speed and body size in birds and mammals. _J. Exp.
Biol._ 97, 1–21 (1982). Article CAS PubMed Google Scholar * Langman, V. A., Rowe, M. F., Roberts, T. J., Langman, N. V. & Taylor, C. R. Minimum cost of transport in Asian elephants:
do we really need a bigger elephant? _J. Exp. Biol._ 215, 1509–1514 (2012). Article PubMed Google Scholar * Clemente, C. J. & Dick, T. J. M. How scaling approaches can reveal
fundamental principles in physiology and biomechanics. _J. Exp. Biol._ 226, jeb245310 (2023). Article PubMed Google Scholar * Hamner, S. R., Seth, A. & Delp, S. L. Muscle
contributions to propulsion and support during running. _J. Biomech._ 43, 2709–2716 (2010). Article PubMed PubMed Central Google Scholar * Sherman, M. A., Seth, A. & Delp, S. L.
Simbody: multibody dynamics for biomedical research. _Procedia IUTAM_ 2, 241–261 (2011). Article PubMed PubMed Central Google Scholar * Anderson, F. C. & Pandy, M. G. Dynamic
optimization of human walking. _J. Biomech. Eng._ 123, 381–390 (2001). Article CAS PubMed Google Scholar * Raasch, C. C., Zajac, F. E., Ma, B. & Levine, W. S. Muscle coordination of
maximum-speed pedaling. _J. Biomech._ 30, 595–602 (1997). Article CAS PubMed Google Scholar * Dick, T. J. & Clemente, C. J. How to build your dragon: scaling of muscle architecture
from the world’s smallest to the world’s largest monitor lizard. _Front. Zool._ 13, 1–17 (2016). Article Google Scholar * Alexander, R. M., Jayes, A., Maloiy, G. & Wathuta, E.
Allometry of the leg muscles of mammals. _J. Zool._ 194, 539–552 (1981). Article Google Scholar * Pollock, C. M. & Shadwick, R. E. Allometry of muscle, tendon, and elastic energy
storage capacity in mammals. _Am. J. Physiol. Regul. Integr. Comp. Physiol._ 266, R1022–R1031 (1994). Article CAS Google Scholar * De Groote, F. et al. A physiology based inverse dynamic
analysis of human gait: potential and perspectives. _Comput. Methods Biomech. Biomed. Eng._ 12, 563–574 (2009). Article Google Scholar * Van Den Bogert, A. J., Blana, D. & Heinrich, D.
Implicit methods for efficient musculoskeletal simulation and optimal control. _Procedia IUTAM_ 2, 297–316 (2011). Article PubMed PubMed Central Google Scholar * Bhargava, L. J., Pandy,
M. G. & Anderson, F. C. A phenomenological model for estimating metabolic energy consumption in muscle contraction. _J. Biomech._ 37, 81–88 (2004). Article PubMed Google Scholar *
Uchida, T. K., Hicks, J. L., Dembia, C. L. & Delp, S. L. Stretching your energetic budget: how tendon compliance affects the metabolic cost of running. _PloS One_ 11, e0150378 (2016).
Article PubMed PubMed Central Google Scholar * Andersson, J. A., Gillis, J., Horn, G., Rawlings, J. B. & Diehl, M. CasADi: a software framework for nonlinear optimization and optimal
control. _Math. Program. Comput._ 11, 1–36 (2019). Article MathSciNet Google Scholar * Alexander, R. M. Factors of safety in the structure of animals. _Sci. Prog_. 67, 109–130 (1981). *
Meltzer, S. J. The factors of safety in animal structure and animal economy. _J. Am. Med. Assoc._ 48, 655–664 (1907). Article CAS Google Scholar * Wood, S. & Wood, M. S. Package
‘mgcv’. _R. package version_ 1, 729 (2015). Google Scholar * Iriarte-Díaz, J. Differential scaling of locomotor performance in small and large terrestrial mammals. _J. Exp. Biol._ 205,
2897–2908 (2002). Article PubMed Google Scholar * Skinner, J. D. & Chimimba, C. T. _The mammals of the southern African sub-region_. (Cambridge University Press, 2005). * Lovegrove,
B. G. & Mowoe, M. O. The evolution of micro-cursoriality in mammals. _J. Exp. Biol._ 217, 1316–1325 (2014). PubMed Google Scholar * Christiansen, P. Locomotion in terrestrial mammals:
the influence of body mass, limb length and bone proportions on speed. _Zool. J. Linn. Soc._ 136, 685–714 (2002). Article Google Scholar Download references ACKNOWLEDGEMENTS We thank
Antoine Falisse for graciously making codes accessible to us, David Labonte for insightful conversations about animal movement, and Alexis Brierty for her support with the human running
experiments. We also thank Uli Siebeck, Sean Coakley, Laura Fenlon, Rodrigo Suarez, and Wally Thomas who provided useful feedback on an earlier version of this manuscript, which is
gratefully acknowledged. This work was funded by Australian Research Council grant DP180100220 (C.J.C.) and an FWO Research Foundation—Flanders Junior Research Grant G0B4222N (F.D.G.).
AUTHOR INFORMATION AUTHORS AND AFFILIATIONS * School of Biomedical Sciences, University of Queensland, St Lucia, QLD, Australia Christofer J. Clemente & Taylor J. M. Dick * School of
Science Engineering and Technology, University of the Sunshine Coast, Sippy Downs, QLD, Australia Christofer J. Clemente * Department of Movement Sciences, KU Leuven, Leuven, Belgium Friedl
De Groote Authors * Christofer J. Clemente View author publications You can also search for this author inPubMed Google Scholar * Friedl De Groote View author publications You can also
search for this author inPubMed Google Scholar * Taylor J. M. Dick View author publications You can also search for this author inPubMed Google Scholar CONTRIBUTIONS Conceptualization:
C.J.C., T.J.M.D. Methodology: C.J.C., F.D.G., T.J.M.D. Investigation: C.J.C., F.D.G., T.J.M.D. Visualization: C.J.C., T.J.M.D. Funding acquisition: C.J.C., F.D.G., T.J.M.D. Writing—original
draft: C.J.C., F.D.G., T.J.M.D. Writing—review & editing: C.J.C., F.D.G., T.J.M.D. CORRESPONDING AUTHOR Correspondence to Christofer J. Clemente. ETHICS DECLARATIONS COMPETING INTERESTS
The authors declare no competing interests. PEER REVIEW PEER REVIEW INFORMATION _Nature Communications_ thanks Anne Koelewijn and the other, anonymous, reviewer(s) for their contribution to
the peer review of this work. A peer review file is available. ADDITIONAL INFORMATION PUBLISHER’S NOTE Springer Nature remains neutral with regard to jurisdictional claims in published maps
and institutional affiliations. SUPPLEMENTARY INFORMATION SUPPLEMENTARY INFORMATION PEER REVIEW FILE REPORTING SUMMARY DESCRIPTION OF ADDITIONAL SUPPLEMENTARY FILES SUPPLEMENTARY MOVIE 1
SUPPLEMENTARY MOVIE 2 SOURCE DATA SOURCE DATA RIGHTS AND PERMISSIONS OPEN ACCESS This article is licensed under a Creative Commons Attribution-NonCommercial-NoDerivatives 4.0 International
License, which permits any non-commercial use, sharing, distribution and reproduction in any medium or format, as long as you give appropriate credit to the original author(s) and the
source, provide a link to the Creative Commons licence, and indicate if you modified the licensed material. You do not have permission under this licence to share adapted material derived
from this article or parts of it. The images or other third party material in this article are included in the article’s Creative Commons licence, unless indicated otherwise in a credit line
to the material. If material is not included in the article’s Creative Commons licence and your intended use is not permitted by statutory regulation or exceeds the permitted use, you will
need to obtain permission directly from the copyright holder. To view a copy of this licence, visit http://creativecommons.org/licenses/by-nc-nd/4.0/. Reprints and permissions ABOUT THIS
ARTICLE CITE THIS ARTICLE Clemente, C.J., De Groote, F. & Dick, T.J.M. Predictive musculoskeletal simulations reveal the mechanistic link between speed, posture and energetics among
extant mammals. _Nat Commun_ 15, 8594 (2024). https://doi.org/10.1038/s41467-024-52924-z Download citation * Received: 12 February 2024 * Accepted: 18 September 2024 * Published: 04 October
2024 * DOI: https://doi.org/10.1038/s41467-024-52924-z SHARE THIS ARTICLE Anyone you share the following link with will be able to read this content: Get shareable link Sorry, a shareable
link is not currently available for this article. Copy to clipboard Provided by the Springer Nature SharedIt content-sharing initiative