Play all audios:
ABSTRACT H3K27M diffuse midline gliomas (DMG), including diffuse intrinsic pontine gliomas (DIPG), exhibit cellular heterogeneity comprising less-differentiated oligodendrocyte precursors
(OPC)-like stem cells and more differentiated astrocyte (AC)-like cells. Here, we establish in vitro models that recapitulate DMG-OPC-like and AC-like phenotypes and perform transcriptomics,
metabolomics, and bioenergetic profiling to identify metabolic programs in the different cellular states. We then define strategies to target metabolic vulnerabilities within specific tumor
populations. We show that AC-like cells exhibit a mesenchymal phenotype and are sensitized to ferroptotic cell death. In contrast, OPC-like cells upregulate cholesterol biosynthesis, have
diminished mitochondrial oxidative phosphorylation (OXPHOS), and are accordingly more sensitive to statins and OXPHOS inhibitors. Additionally, statins and OXPHOS inhibitors show efficacy
and extend survival in preclinical orthotopic models established with stem-like H3K27M DMG cells. Together, this study demonstrates that cellular subtypes within DMGs harbor distinct
metabolic vulnerabilities that can be uniquely and selectively targeted for therapeutic gain. SIMILAR CONTENT BEING VIEWED BY OTHERS MULTI-OMICS AND PHARMACOLOGICAL CHARACTERIZATION OF
PATIENT-DERIVED GLIOMA CELL LINES Article Open access 08 August 2024 OVEREXPRESSION OF CARNITINE PALMITOYLTRANSFERASE 1A PROMOTES MITOCHONDRIAL FUSION AND DIFFERENTIATION OF GLIOBLASTOMA
STEM CELLS Article 28 December 2021 _ZNF117_ REGULATES GLIOBLASTOMA STEM CELL DIFFERENTIATION TOWARDS OLIGODENDROGLIAL LINEAGE Article Open access 22 April 2022 INTRODUCTION Diffuse midline
gliomas (DMG), including diffuse intrinsic pontine gliomas (DIPG), are treatment-resistant and uniformly fatal pediatric brain tumors. The prognosis of this brainstem tumor is dismal with a
median overall survival of 9–12 months from diagnosis1,2. Radiotherapy is the only therapy that has proven benefit in this patient population. Historically, clinical trials with chemotherapy
have failed to demonstrate any additional survival benefit over radiation alone3,4. It is therefore imperative to identify strategies for targeting this aggressive and devastating disease.
Recent advances delineating the molecular underpinnings of DMGs and DIPGs revealed that approximately 80% of DIPGs and DMGs harbor a recurrent somatic lysine-to-methionine mutation at
position 27 of histone H3.1 (_HIST1H3B_) or H3.3 (_H3F3A_) collectively called H3K27M. H3K27M results in global H3K27 hypo-trimethylation, epigenetic dysregulation, and altered gene
transcription1,5,6,7,8. Other activating mutations and aberrant gene expression patterns identified in DMG include _ACVR1, TP53_, and _ATRX_ mutations, and overexpression of transcriptional
factors OLIG1 and OLIG29,10,11. Single-cell RNA sequencing studies from patient tumor samples demonstrate that H3K27M DMGs hijack developmental programs regulating lineage differentiation of
neuroglial stem cells12,13,14. Consequently, tumor cells undergo developmental arrest and are locked in a less-differentiated state dependent both on age and anatomic location of the tumor.
These studies also revealed that H3K27M DMGs contain a heterogeneous population of cells, where the majority of tumor cells harbor characteristic markers of ‘oligodendrocyte precursor
cells’ (OPC-like), with stem-like and higher renewal potential. The more differentiated-like H3K27M tumor cells exhibit an astrocytic-like (AC-like) phenotype12. Of note, in the context of
DMG cellular heterogeneity, the H3K27M OPC-like cells are hypothesized to be the putative drivers of tumor growth and aggressiveness and possess in vivo tumor-initiating potential, compared
to more differentiated cells12,13,14,15,16,17,18. Metabolic reprogramming is a hallmark of cancer that influences every aspect of cancer biology19,20. Indeed, in comparison to H3 wild-type
(H3WT) tumor cells, H3K27M DMG cells enhance metabolic programs including glycolysis, glutaminolysis, and the tricarboxylic acid (TCA) cycle, as well as increase the generation of
α-ketoglutarate (α-KG)21,22,23. Of note, enhanced α-KG production in H3K27M DMG was shown to be critical for the maintenance of the preferred global H3K27 hypomethylation status, indicating
the important interplay between metabolic reprogramming and epigenetic regulation24. More recently, the impiridone ONC201 was shown to be toxic to H3K27M DMG cells by suppressing
mitochondrial metabolism and oxidative phosphorylation (OXPHOS)25,26. Importantly, recently completed clinical studies with ONC201 show efficacy in H3K27M DMG patients with near doubling in
overall survival rates26,27,28,29. Despite these emerging studies of metabolism in H3K27M DMGs, the role of dysregulated metabolism, particularly in the context of how metabolism impacts
stemness and tumorigenicity in H3K27M DMGs, remains largely unknown. Indeed, differential metabolic reprogramming can potentially regulate cancer stemness, differentiation, and cell fate30.
As a result, many aspects of rewired metabolism can provide therapeutic liabilities within tumors that can be effectively leveraged for therapy. In this study we seek to elucidate the
metabolic dependencies operative in both the stem-like tumorigenic H3K27M gliomas and the more differentiated cell state. By applying a systems biology approach that incorporates
metabolomics, transcriptomics, and biochemical analyses, we uncover several nodes of dysregulated metabolic and signaling pathways in the tumorigenic OPC-like versus the more differentiated
AC-like DMG populations. This study collectively illustrates that H3K27M DMGs harbor perturbations in metabolic programs that can be exploited for therapeutic benefits. RESULTS IN VITRO
MODELING OF THE DIFFERENTIATION STATE OF H3K27M DMGS To study metabolic vulnerabilities associated with the distinctly heterogenous H3K27M DMGs, we generated gliomaspheres (GS) and
differentiated glioma cells (DGC) from three patient-derived H3K27M DMG cell lines: DIPG-007, DIPG-XIII and SF7761. It has been previously established that the DMG GS culture conditions
(serum-free) enrich for malignant cells that are less-differentiated and stem-like31,32. Moreover, DMG GS readily establish tumors following stereotactic injection into the pons of mice12.
In contrast, culturing the tumor cells in the presence of serum induces differentiation of H3K27M malignant glioma cells (i.e., DGC) and an associated loss or substantially diminished in
vivo tumorigenicity12. Furthermore, in comparison to the DGC, the GS model most closely recapitulates the phenotype of DMG tumor-xenografts and primary patient tumors12,31,32,33. We
maintained these cell lines either as tumorigenic GS cultures (i.e., unattached 3D spheres cultured in serum-free media containing B-27 supplements and the growth factors EGF, FGF and PDGF),
or we differentiated the GS cultures into adherent monolayers in the presence of serum (i.e., DGC; Fig. 1A; Supplementary Figs. 1A, 2A). During the differentiation procedure, we did not
observe cell death, arguing against the selection of a rare subclone34,35. Further, we performed STR profiling on the paired lines, which indicated that they are genetically identical at the
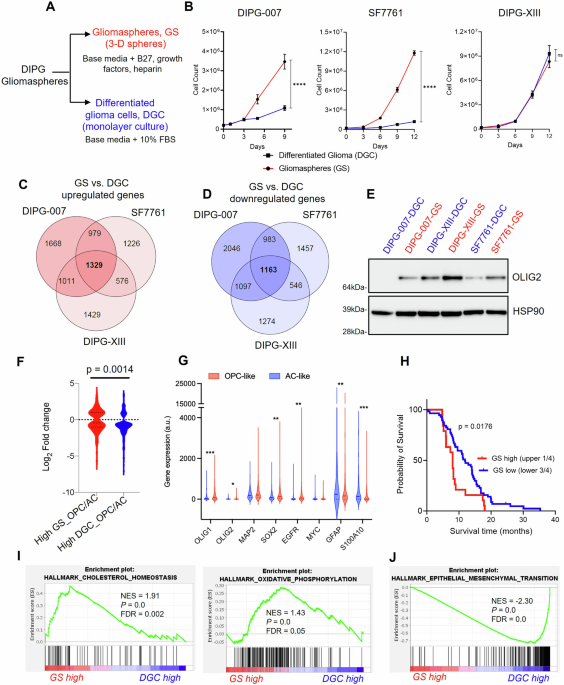
loci assessed (Supplementary Data 1). Evaluation of the growth kinetics of GS vs. DGC revealed that DIPG-007 and SF7661 GS proliferated at a markedly higher rate than their DGC
counterparts, indicating that the less differentiated and stem-like GS populations are far more proliferative. The differentiation state did not influence proliferation rates in the
DIPG-XIII cells (Fig. 1B). TRANSCRIPTOMIC ANALYZES REVEALED GS ARE OPC-LIKE AND DGC ARE AC-LIKE To characterize the molecular features of the DMG GS and DGC, we performed RNA-sequencing
(RNA-seq) to compare the gene expression patterns of GS vs. DGC in these three cell lines. Principal component (PC) analysis of the RNA-seq data revealed that the cell lines clustered based
on cell line differences and cellular differentiation status (namely, DGC or GS) (Supplementary Fig. 2B, C). PC1 vs. PC2 was shown to be driven by original cell line differences and
clustered based on cell line, irrespective of the differentiation state (Supplementary Fig. 2B). PC3 distinguished between GS and DGC, wherein the cell lines clustered separately, suggesting
that PC3 was influenced by the cellular differentiation status. PC3 revealed that GS vs DGC gene expression patterns were more strongly separated in DIPG-007 and SF7761 than in DIPG-XIII
(Supplementary Fig. 2C). These observations suggest a potentially marked difference in the resultant phenotype of GS vs. DGC in DIPG-007 and SF7761, which is less pronounced in DIPG-XIII
(Supplementary Fig. 1B). We analyzed genes that were differentially expressed in GS vs. DGC across the three cell lines (DIPG-007, 10276 total genes; SF7761, 9242 total genes; and DIPG-XIII,
8425 total genes) and found 1329 genes and 1163 genes to be commonly upregulated and downregulated, respectively (Fig. 1C, D). The top 50 consistently upregulated and downregulated genes
common to the three cell lines revealed distinct gene signatures associated with GS vs. DGC tumor populations. (Supplementary Fig. 2D, E). Next, we examined the gene expression of individual
H3K27M DMG stemness and differentiation markers. GS lines upregulated oligodendrocyte transcription factor 2 (_OLIG2_) (Supplementary Fig. 3A), the gene that encodes a transcription factor
typically overexpressed in H3K27M DMGs and critical for the establishment of tumors in vivo36. This difference was also observed at the protein level (Fig. 1E). In addition, other H3K27M DMG
markers like oligodendrocyte transcription factor 1 (_OLIG1)_ and microtubule associated protein 2 (_MAP2)_ were higher in GS compared to DGC (Supplementary Fig. 3B, C). SRY-box
transcription factor 2 (_SOX2)_, epidermal growth factor receptor (_EGFR)_, and Myc proto-oncogene (_MYC)_ are genes whose upregulation is associated with glioma stemness. These genes showed
consistently higher expression in DIPG-007 and SF7761 GS compared to their DGC counterparts, and this contrasted with the modestly lower expression in DIPG-XIII GS vs. DGC (Supplementary
Fig. 3D–F). Analysis of glial fibrillary acidic protein (_GFAP_), vimentin (_VIM_), and S100 calcium binding protein A10 (_S100A10_), which are typically associated with astrocytic-like
differentiated DMG37,38,39, revealed substantial upregulation in DGC compared to GS across the three lines (Supplementary Fig. 3G–I). Malignant H3K27M gliomas have been reported to include
tumor cell types that exhibit four main gene signatures: namely, (i) OPC-like cells, (ii) cell cycle (CC), (iii) oligodendrocytes (OL), and (iv) AC-like cells12. We cross referenced our bulk
RNA-seq gene expression data with that of the published single-cell RNA-seq dataset12 (GSE102130) that described the four gene signatures. We found that the gene expression pattern observed
in GS showed increased enrichment for the OPC-like gene signature, while the gene signature of DGC was consistent with an AC-like phenotype (Fig. 1F). Interestingly, individual gene
expression trends observed in our in vitro-generated GS vs. DGC cells (Supplementary Fig. 3A–I) were also recapitulated in the OPC-like vs. AC-like H3K27M cells defined in this published
single-cell RNA-seq dataset (Fig. 1G). Collectively, these data suggest that in vitro generated GS largely represent the OPC-like H3K27M DMG phenotype, which is known to be
less-differentiated, stem-like, and exhibit tumor-propagating potential in vivo, while DGC represent the more differentiated AC-like phenotype. Accordingly, the GS and DGC in vitro models
developed herein molecularly mimic two distinct and predominant populations in the heterogenous H3K27M DMG tumor. GS GENE SIGNATURE PREDICTS DECREASED SURVIVAL OF H3K27M DMG PATIENTS To
determine the clinical relevance of the GS gene signature in predicting disease outcome and survival of patients with H3K27M DMG, we mined a patient dataset from Mackay et al.40 containing
gene expression and survival data for 76 H3K27M DIPG and DMG patients. We segregated patients into “high GS” vs. “low GS” gene expression categories using unbiased K-means clustering and
applied Kaplan-Meier survival analysis to define upper quartile as “GS high” vs. “GS low” tumors. The results revealed that patients with “GS high” tumors showed a significantly decreased
survival in comparison to patients in the “GS low” category within H3K27M tumors (Fig. 1H; Supplementary Fig. 3J, K). This result supports our observation that the “GS” gene signature, which
recapitulates those of the less differentiated OPC-like cells, represents the more aggressive and tumorigenic cell-state of DMG. OPC-LIKE GS UPREGULATE CHOLESTEROL METABOLISM AND OXIDATIVE
PHOSPHORYLATION To interrogate the gene expression programs that distinguish the cell state among our cell line pairs, we performed gene set enrichment analysis (GSEA) on each of our RNA-seq
datasets from the three lines. Across the three lines, H3K27M DMG GS vs. DGC upregulated genes were associated with the MYC pathway, PI3K/MTORC1 signaling, G2M checkpoint, DNA repair, and
E2F signaling (Supplementary Fig. 4A). These pathways have been previously reported to be upregulated in primary patient H3K27M DMG tumors and xenografts40,41,42, thereby providing further
confidence in our DMG models and analyses. Furthermore, in at least two of the three cell lines, we observed considerable DMG GS enrichment of metabolic pathways, namely cholesterol
homeostasis and mitochondrial oxidative phosphorylation (OXPHOS) (Fig. 1I). In contrast, DMG DGC upregulated genes associated with epithelial-mesenchymal transition (EMT) (Fig. 1J),
xenobiotic metabolism, inflammatory response, and transforming growth factor beta (TGFβ) signaling (Supplementary Fig. 4B). These findings suggested that tumorigenic OPC-like GS may exhibit
enhanced reliance on cholesterol metabolism and mitochondrial OXPHOS programs, which could represent an actionable metabolic vulnerability. Given the metabolic signatures evident in the
transcriptomic profiling, we performed liquid chromatography-coupled mass spectrometry (LC/MS)-based metabolomics43 to gain a deeper understanding of metabolic differences between the DMG
cellular differentiation states. These data revealed that GS and DGC exhibit distinct metabolic landscapes (Supplementary Fig. 5). By taking the average of the three lines, we found that,
compared to DGC, GS showed a difference in nucleotide metabolism, lipid and sterol biosynthesis, and amino acid metabolism (Fig. 2A, B). Further, among the ~223 metabolites measured, we
found 70 that were consistently altered between GS and DGC. Of these, 45 metabolites were highly increased, and 25 metabolites were decreased in GS compared to DGC (Fig. 2C). Several
metabolites were altered in glycolysis, the TCA cycle, and the purine biosynthesis pathway (Supplementary Fig. 6A). Glycolytic metabolites were generally more abundant in GS compared to DGC
(Fig. 2D), with several differences being greater than 10-fold, particularly those in the preparatory phase of glycolysis. Pyruvate and lactate, products of aerobic and anaerobic glycolysis,
respectively, showed either no difference between the differentiation states or were modestly altered (Fig. 2D). Glycolysis connects to the TCA cycle via the generation of acetyl-CoA from
CoA and pyruvate. Metabolites in the TCA cycle were generally decreased in DIPG-007 and SF7761 GS compared to DGC, while few differences were observed in the DIPG-XIII cell line pair. An
exception was malate, which was increased in GS across the three cell lines (Fig. 2E). The metabolomics studies also revealed increased levels of CoA and carnitine, key metabolites and
rate-limiting substrates in lipid and sterol biosynthetic pathways (Supplementary Fig. 6B). Despite the marked differences in glycolytic and TCA cycle intermediates, consistent differences
were not observed for expression of glucose or glutamine transporters (Supplementary Fig. 7A–C). Additionally, we found that DIPG-007 GS cultures are more sensitive to glucose deprivation
than DGC, though this did not have an impact on cellular phenotype (Supplementary Fig. 7D, E). Glutamine deprivation was well-tolerated by both GS and DGC cultures, again without having an
impact on cellular phenotype (Supplementary Fig. 7D, F). PURINE NUCLEOTIDES ARE ENRICHED IN OPC-LIKE GS Of the phosphorylated purine species detected, markedly higher levels of purine
nucleotide pools (>50-fold in several cases) were observed in GS compared to DGC in DIPG-007 and SF7761, including adenosine monophosphate (AMP), guanosine monophosphate (GMP), inosine
monophosphate (IMP), inosine diphosphate (IDP) and adenosine diphosphate (ADP) (Fig. 2F). Apart from ADP, such differences were not observed in DIPG-XIII (Fig. 2F). Increased expression of
genes encoding purine pathway enzymes were similarly observed (Supplementary Fig. 6C), including phosphoribosyl pyrophosphate synthetase 2 (_PRPS2),_ which converts ribose-5-phosphate to
phosphoribosyl pyrophosphate; adenylosuccinate synthase 2 (_ADSS_), which converts IMP to adenylosuccinate; adenylosuccinate lyase (_ADSL_), which converts adenylosuccinate to AMP; inosine
monophosphate dehydrogenase 1 (_IMPDH1_), which converts IMP to xanthine monophosphate (XMP); and guanine monophosphate synthase (_GMPS_), which converts XMP to GMP (Supplementary Fig. 6A).
Indeed, increased purine nucleotides pools have been demonstrated to be an intrinsic characteristic of brain tumor-initiating glioma cells44. AC-LIKE DGC ACCUMULATE METABOLITES ASSOCIATED
WITH CELLULAR DIFFERENTIATION Comparison of metabolite abundance in DGC relative to GS revealed increases on the order of 10-fold for taurine, creatine, creatinine, uric acid, and
hydroxyproline (Fig. 2G). These data were provocative because taurine, creatine, and creatinine have been shown to be elevated in oligodendrocytes generated by inducing differentiation of
primary OPCs using triiodothyronine (T3)45. Moreover, exogenous taurine was shown to promote drug-induced differentiation of primary OPC cells to OLs and is presumed to be synthesized by
cells to promote lineage differentiation45. AC-LIKE DGC UPREGULATE EMT PATHWAY GENES AND ARE VULNERABLE TO FERROPTOSIS The results from our transcriptome and metabolome profiling efforts
identified several nodes of metabolism that differ between GS and DGC. We next sought to assess if these differences in metabolic programming provide therapeutic vulnerabilities. GSEA
illustrated that DGC upregulated genes associated with epithelial-mesenchymal transition (EMT) and TGFβ signaling (Fig. 1J; Supplementary Fig. 4B). This EMT signature was characterized by a
general increase in expression of EMT marker genes, including transforming growth factor beta 2 (_TGFB2)_, vascular cell adhesion molecule 1 (_VCAM1_), snail family transcriptional repressor
1 (_SNAI1_), matrix metallopeptidase 2 (_MMP2_), and matrix metallopeptidase 11 (_MMP11_) (Fig. 3A). Several recent studies have illustrated that the mesenchymal state of cancer cells
exposes a vulnerability to ferroptosis, a form of metabolic-stress cell death induced by inhibiting the GPX4 lipid peroxidase pathway46,47. Ferroptosis can be induced by genetic or
pharmacological manipulations that impair cystine uptake, block glutathione (GSH) synthesis, or directly inhibit activity of the central lipid peroxidase, GPX448 (Fig. 3B). Based on this
knowledge, we hypothesized that DGC, owing to its high mesenchymal gene signature, would be susceptible to GPX4 inhibition and ferroptosis. Treatment of DIPG-007, SF7761, and DIPG-XIII DGC
with the GPX4 inhibitor RSL3 led to profound cell death by 48 h (Fig. 3C). To determine whether the RSL3-induced cell death was indeed ferroptotic in nature, we demonstrated that
pre-treating cells with the lipophilic antioxidant ferrostatin-1 (Fer-1; a well-established inhibitor of ferroptosis49) rescued cell death. In contrast to DGC, GS cells exhibited
RSL3-induced cytotoxicity at much higher concentrations, and more importantly, this effect could not be rescued substantially by Fer-1. The lack of rescue illustrates a
ferroptosis-independent mechanism of cell death (Fig. 3D). Next, we assessed if RSL3 could induce lipid oxidation, a classic hallmark of ferroptosis, in DGC. Indeed, treatment of DIPG-007
with RSL3 resulted in increased accumulation of lipid reactive oxygen species (lipid ROS), as measured by C-11 BODIPY, which could be mitigated by pre-treating cells with Fer-1 (Fig. 3E). To
rule out other avenues of RSL3-induced cytotoxic cell death, DGC were pre-treated with antioxidants and ferroptosis inhibitors (trolox, Fer-1), z-vad-fmk (apoptosis inhibitor),
bafilomycin-A1 (autophagic cell death inhibitor), or necrosulfonamide (necroptosis inhibitor). Only the antioxidants rescued cell death induced by RSL3 in DIPG-007 DGC (Fig. 3F).
Collectively, these data indicate a ferroptotic-specific mechanism of cell death in DGC. As an important control, we also investigated whether the resistance of GS to ferroptosis was the
result of culture media composition. To test this, we cultured freshly dissociated GS in serum-containing DGC media or GS media with an antioxidant-free B-27 supplement and assessed
RSL3-induced ferroptosis. In both instances, GS displayed resistance to ferroptosis regardless of the media formulation (Fig. 3G; Supplementary Fig. 8A–C). These results illustrate that the
growth medium itself does not directly impact the susceptibility of DMG cells to ferroptosis. Rather, our data suggest that AC-like DGC have undergone the process of differentiation and,
thereby, harbor cell-intrinsic qualities that promote sensitivity to ferroptosis. This is consistent with our hypothesis that the mesenchymal state of DGC sensitizes them to GPX4
inhibition-induced ferroptosis. Of note, analysis of a panel of canonical ferroptosis regulators did not reveal differential expression between GS and DGC cells (Supplementary Fig. 8D), and
prolonged low-dose RSL3 treatment did not have an impact on GS cellular phenotype (Supplementary Fig. 8E). Additionally, SF7761 GS cells are highly dependent on antioxidants for survival.
CHOLESTEROL BIOSYNTHESIS AND MITOCHONDRIAL OXPHOS ARE METABOLIC VULNERABILITIES IN OPC-LIKE GS Cholesterol homeostasis and mitochondrial OXPHOS were the top upregulated metabolic pathways by
gene expression analysis in OPC-like GS (Fig. 1I). Accordingly, we investigated the sensitivity of GS vs. DGC to OXPHOS inhibitors (Phenformin, Metformin, IACS-010759) or cholesterol
biosynthesis inhibitors (statins). In vitro cultured DIPG-007 GS and DGC treated with increasing drug concentrations revealed that GS were strikingly and selectively more sensitive to
Metformin, Phenformin, and IACS-010759 (Fig. 4A–C), as well as to statins (Atorvastatin, Fluvastatin, and Pitavastatin) (Fig. 4D–F). Of the five clinically available lipophilic statins,
Pitavastatin, was most potent at reducing viability of DIPG-007 in vitro (Supplementary Fig. 9A). Similar observations were made in SF7761 (Supplementary Fig. 9B–F) and DIPG-XIII cells, with
the notable exception that metformin and phenformin did not exhibit a differential response in DIPG-XIII (Supplementary Fig. 9G-J). Prolonged low-dose Phenformin or Pitavastatin treatment
did not have an impact on GS cellular phenotype (Supplementary Fig. 8F). Lastly, we established the PPK murine DMG cell line (P53; PDGFRA; H3K27M), which has been demonstrated to replicate
the H3K27M DMG biology50, as either GS or DGC. GS cultures of PPK exhibited increased sensitivity to Phenformin and Pitavastatin, relative to DGC (Supplementary Fig. 9K, L). To determine the
mechanism of cytotoxicity induced by OXPHOS inhibition (Phenformin) and statins (Pitavastatin), we treated DIPG-007 DGC and GS with equal concentrations of these compounds and assessed PARP
cleavage via western blot as a readout for apoptotic cell death. The results showed modestly elevated levels of PARP cleavage in DIPG-007 GS but not in DGC, demonstrating that the cytotoxic
effects of statins and OXPHOS inhibition are at least partially the result of induction of apoptotic cell death (Fig. 4G, H). In an attempt to invoke an even more potent cytotoxic effect
using both pathway inhibitors, DIPG-007 GS and murine PPK GS were treated with increasing doses of single agent Pitavastatin, Phenformin, or the combination with the IC25 or IC50 of the
respective combinatorial compound. The results revealed sub-additive activity in DIPG-007 (Supplementary Fig. 9M, N). No additional cytotoxic benefit was found in murine PPK GS treated with
either Metformin or Phenformin in combination with Pitavastatin (Supplementary Fig. 9O–R). OPC-LIKE GS DEPEND ON THE STEROL BIOSYNTHESIS PATHWAY FOR CHOLESTEROL Based on the upregulation of
cholesterol metabolism gene expression (Fig. 1I, Supplementary Fig. 10A–C) and the robust sensitivity of GS to statins, we hypothesized that GS are metabolically dependent on an output of
the sterol biosynthetic pathway for survival. To test this hypothesis, we grew DIPG-007 GS and DGC cells in media supplemented with isotopically labeled glucose (uniformly carbon-13;
U13C-glucose), and collected samples at 15 min, 1 h, 4 h, and 24 h. These were analyzed by LC/MS-based metabolomics to measure the flux of glucose carbon entry into glycolysis, the TCA
cycle, TCA cycling, de novo lipid biosynthesis, and the sterol biosynthetic pathway. We found that glucose entry into glycolysis and the upper TCA cycle (i.e. citrate) was comparable between
DGC and GS (Fig. 5A, C; Supplementary Fig. 10D–G; Supplementary Fig. 11A, B). TCA cycling and anaplerosis were reduced in GS, compared to DGC (Fig. 5B, D; Supplementary Fig. 10H–K). Glucose
carbon entry into the lower TCA cycle was markedly slower in GS, potentially because citrate was being siphoned to support sterol biosynthesis. Indeed, we observed that sterol biosynthesis
was faster in GS, as measured by labeling of the sterol biosynthesis intermediate mevalonate (Fig. 5E). Further, GS had increased rates of de novo lipid biosynthesis (Fig. 5F; Supplementary
Fig. 11C–I). In sum, these observations reflect a higher demand for GS cells on endogenously produced cholesterol, whose inhibition presents a metabolic vulnerability. Statins inhibit
HMG-CoA reductase (HMGCR), the first step in the sterol biosynthesis pathway, whose outputs include cholesterol, protein post-translational modifications (e.g., farnesyl, geranyl), steroid
hormones, and coenzyme Q10 (CoQ10)51,52 (Fig. 5G). To determine the arm of the sterol biosynthesis pathway involved in mediating GS sensitivity to statins, we treated DIPG-007 GS in vitro
with Pitavastatin alone or in combination with key intermediates of the sterol biosynthesis pathway, including mevalonate, farnesyl pyrophosphate (FPP), or geranylgeranyl pyrophosphate
(GGPP) (Fig. 5G). The results revealed that mevalonate, a rate limiting metabolite in the sterol biosynthesis pathway, protected cells from effects of Pitavastatin (Fig. 5H). In addition,
FPP and GGPP partially rescued Pitavastatin-induced loss of cell viability (Fig. 5I, J). We next investigated whether addition of exogenous cholesterol, an end product of the pathway, could
similarly protect GS cells from Pitavastatin-induced cytotoxicity. To deliver cholesterol, we used cholesterol conjugated to methyl-β-cyclodextrin to promote cell permeability. This was
added to cells in combination with Pitavastatin. Here, we observed that cholesterol robustly rescued the loss of viability induced by Pitavastatin, indicating a dependency of GS on
cholesterol for survival (Fig. 5K). Similar observations were made using SF7761 and DIPG-XIII GS (Supplementary Fig. 12A–F). CoQ10 acts as an electron shuttle between complexes II and III of
the electron transport chain and is, thus, an important mediator of OXPHOS. However, CoQ10 media supplementation did not protect cells to the same extent as cholesterol or mevalonate. These
results suggest that the cytotoxic effect of Pitavastatin is not the result of indirect inhibition of mitochondrial respiration via limiting CoQ10 biosynthesis (Fig. 5L; Supplementary Fig.
12G, H). OPC-LIKE GS EXHIBIT DECREASED BIOENERGETIC CAPACITY AND ACTIVITY To gain insights on why mitochondrial OXPHOS is a metabolic dependency in DMG GS, we evaluated the bioenergetic
capacity of untreated GS compared to DGC using the Seahorse extracellular flux analyzer. We monitored the oxygen consumption rate (OCR), which is an indicator of mitochondrial respiration.
The results showed that the basal OCR was lower in GS compared to DGC in DIPG-007 and SF7761, with a trend toward lower OXPHOS in DIPG-XIII GS (Fig. 6A, B). Further, challenge with the ATP
synthase inhibitor, oligomycin, decreased respiration move severely in GS. And, most strikingly, treatment with the mitochondrial membrane potential uncoupler FCCP, which facilitates maximal
oxygen consumption in the mitochondria, revealed that GS displayed decreased OCR compared to DGCs (Fig. 6A). The modest decrease in basal OCR and the OCR response to Oligomycin or FCCP in
DIPG-XIII GS vs. DGC (Fig. 6A, B) is consistent with the lack of differential sensitivity to metformin and phenformin (Supplementary Fig. 9G, H). Next, we assessed spare respiratory capacity
(SRC), a measure of the difference between maximal oxygen consumption capacity and basal oxygen consumption in the mitochondria. SRC was similarly reduced in GS vs. DGC (Fig. 6C). In
alignment with our findings, cells with low SRC have been reported to be relatively proliferative, and low SRC is associated with stem-like cells, while SRC is elevated in differentiated
cells53,54 (Fig. 1B). The seeming discrepancy between the upregulated mitochondrial OXPHOS gene signature (Fig. 1I), decreased TCA cycling (Fig. 5B–D; Supplementary Fig. 10H–K), and the
decreased OCR and SRC parameters in GS populations (Fig. 6B, C) motivated us to take a more detailed look at the bioenergetic charge in our cultures. To this end, we interrogated our
in-house metabolomics profiling dataset and determined the NAD/NADH ratios, the adenylate energy charge, and the ATP/ADP ratio of the cells. First, differences were not observed in whole
cell NAD/NADH ratios across pairs of GS and DGC culture models (Supplementary Fig. 12I). The adenylate energy charge (AEC) of a cell is an index of the energetic status of the cell that
considers the differential intracellular levels of the adenylate pool, namely adenosine triphosphate (ATP), adenosine diphosphate (ADP), and adenosine monophosphate (AMP)55,56. The AEC is
calculated by applying the formula [(ATP) + 0.5(ADP)]/ [(ATP) + (ADP) + (AMP)], which yields values between 0 and 1 wherein normal cells remain in the 0.7 to 0.95 range55,56. Assessment of
the AEC in GS vs. DGC lines revealed that tumorigenic DIPG-007 and SF7761 GS displayed lower AEC values compared to their DGC counterparts (Fig. 6D). This result is indicative of a
consequent greater dependency of GS on ATP-generating pathway(s), chief among which is mitochondrial OXPHOS. Here again, modest differences in the AEC values were observed for DIPG-XIII.
This result is consistent with our observation that DIPG-XIII GS do not demonstrate the same degree of differential and selective sensitivity to OXPHOS inhibition (Supplementary Fig. 9G, H).
Despite the variability in AEC among the DMG pairs, the direct ratio of ATP to ADP revealed lower levels in GS across all lines (Fig. 6E). Thus, the low energy charge of GS indicates a DMG
metabolic state where catabolic processes to regenerate ATP are limiting, which we put forth provides the explanation for the therapeutic susceptibility to OXPHOS inhibition. Thus, we next
analyzed glycolytic flux by measuring extracellular acidification rate (ECAR) using the Seahorse bioanalyzer. While upstream glycolytic pools were greatly enriched in DIPG-007 and SF7761 GS
by metabolomics analysis (Fig. 2D), ECAR was more pronounced in their respective DGC counterparts (Fig. 6F). These results suggest that DIPG-007 and SF7761 DGC can compensate for the
inhibition of respiration through utilization of glycolysis, which GS appear unable to do, potentially because of glycolytic stalling as reflected in the large metabolite pool sizes. In
summary, these results reveal that OXPHOS inhibitor-sensitive GS have lower OCR, SRC, AEC, and ECAR. This suggests that DIPG-007 and SF7761 GS exist in a lower and more vulnerable
bioenergetic state than their DGC counterparts, providing important insight into why OPC-like GS are highly sensitive to mitochondrial targeting. OPC-LIKE GS ARE SENSITIZED TO RADIOTHERAPY
Mitochondrial SRC correlates with the capacity of cells to respond or adapt to stress conditions (e.g. oxidative stress)53. We therefore hypothesized that lower SRC in the GS would be
reflected in an increased susceptibility to ionizing radiation, the mainstay therapy for DMG and a well-established inducer of cytotoxic oxidative stress. To this end, we treated the DMG
cells with varying doses of radiation and evaluated cell viability after 7 days. With the exception of DIPG-XIII, the GS were markedly more sensitive to radiation treatment than DGC (Fig.
7A). Additionally, we examined the combination of radiation and statins or OXPHOS inhibitors. DIPG-007 GS cultures were treated with a dose response of atorvastatin or phenformin plus or
minus 2 Gy radiation. At some combinations, modest additive cell killing was observed. However, synergy was not observed, and the additivity window was narrow (Supplementary Fig. 11J, K).
CHOLESTEROL BIOSYNTHESIS AND OXPHOS INHIBITION DECREASE TUMOR BURDEN AND INCREASE OVERALL SURVIVAL OF DMG TUMOR BEARING MICE Statins are used to lower cholesterol and protect from
cardiovascular disease and represent one of the most widely used drugs in the clinic, illustrating their safety and tolerability57,58. Similarly, biguanides, which act through OXPHOS
inhibition59,60, are clinically deployed to reduce blood glucose in diabetes and have seen recent application in cancer trials, again illustrating the potential for rapid deployment in
clinical trials for DMG. Furthermore, studies have shown that biguanides can modestly transverse the blood brain barrier (BBB)61,62, and some classes of statins display brain penetrance,
depending on the pharmacophore, including Pitavastatin63,64. Thus, to evaluate the effects of OXPHOS inhibitors and statins on tumor growth and overall survival, we employed a preclinical
orthotopic mouse model of DIPG in which bioluminescent DIPG-007 cells, grown under GS conditions, were stereotactically injected into the pons of immunodeficient mice. Cognate DGC cells
similarly injected do not form discernible tumors (Supplementary Fig. 13A, B). Tumor engraftment was confirmed via bioluminescent imaging (BLI) 3-weeks post tumor implantation and mice were
randomized into four arms receiving vehicle, Pitavastatin (10 mg/kg), Phenformin (50 mg/kg) or a combination of both drugs, administered intraperitoneally (Fig. 7B). These treatment doses
were determined from an in-house dose-escalating tolerability study in which no signs of toxicity or weight loss were observed following administration of the drugs over a 2-week course
(Supplementary Fig. 13C). Notably, treatment with Pitavastatin or Phenformin resulted in either significant or a trend towards reduction in tumor volume, respectively, based on BLI, with the
combination of both drugs not showing improvement over the single agents alone (Fig. 7C). Neither treatment adversely impacted mouse body weight (Fig. 7D). In addition, treatment with
Pitavastatin or Phenformin significantly extended the survival of DIPG-007 tumor-bearing mice, and here again, the combination did not provide additional benefit (Fig. 7E), consistent with
our in vitro findings (Supplementary Fig. 9M, N). At endpoint, more than one month after treatment commenced, histology indicated that there were no detectable differences in differentiation
(i.e. Olig2, GFAP, S100), proliferation (Ki67), or apoptosis (cleaved caspase 3; CC3) among the four study arms (Supplementary Fig. 14). Collectively, single agent metabolic inhibitors
showed promising results in providing survival benefits in this preclinical model of DMG, demonstrating the potential utility of targeting cholesterol biogenesis and mitochondrial
respiration in DMG patients. DISCUSSION H3K27M DMGs are characterized by intratumoral heterogeneity comprising distinct tumor cell types, wherein the stem-like and tumor-initiating
characteristics are driven by a population of less-differentiated OPC-like glioma cells while the more differentiated AC-like glioma cells represent a minority12. We demonstrated that this
tumor heterogeneity can be modeled in vitro and is substantially recapitulated in DMG GS and DGC, which are enriched for OPC-like and AC-like gene signatures, respectively. By applying a
systems biology-driven approach that encompassed transcriptomics, metabolomics, and bioenergetic analysis, we showed that the OPC-like and AC-like tumor phenotypes harbor distinct metabolic
vulnerabilities. Compared to DGC, GS populations showed higher levels of purine nucleotides. This finding is consistent with features of stem-like brain tumor-initiating cells described in
adult glioblastoma, which upregulate purine synthetic intermediates to promote anabolic processes44. We also observed that GS exhibit increased intracellular levels of upstream glycolytic
intermediates by metabolomics, though the rate of glycolysis (ECAR) was higher in DGC. These results suggest that glycolysis in GS may be stalled at the level of Enolase, and, moreover, that
DGC are better positioned to circumvent the inhibition of mitochondrial respiration through enhanced glycolysis. Genotype-dependent analysis of metabolism in DMG previously revealed
elevated glycolysis in H3K27M gliomas compared to H3 wild-type tumors24. It will be important to test how the differentiation state interacts with the genotype to regulate glycolysis. Along
these lines, metabolites such as taurine, creatine, creatinine, uric acid, and hydroxyproline, which are reported to be associated with cellular differentiation of oligodendrocytes,
cardiomyocytes, mesenchymal cells and adipocytes45,65,66,67, were found to be upregulated in DGC. Indeed, taurine has been demonstrated to play a role in several biological processes,
including the prevention of mitochondria damage, stabilization of OXPHOS in cardiomyocytes, and protection against endoplasmic reticulum (ER) stress. Creatine is involved in ATP buffering
and enhancing mitochondria function65. These results suggest that these metabolites are pertinent to cellular differentiation processes, irrespective of the cell of origin. Our
transcriptomics analysis revealed AC-like DGC exhibited an enhanced mesenchymal phenotype. Based on this insight, we demonstrated that DGC were more sensitive to agents that promote
ferroptosis. Conversely, OPC-like GS cells, whose gene signature correlated with higher disease aggressiveness and decreased overall survival in patients, upregulated cholesterol metabolism
and mitochondrial OXHPHOS. The upregulated sterol biosynthetic pathway in OPC-like GS cells could lead to enhanced production of squalene and/or 7-dehydrocholesterol, metabolites that
promote resistance to ferroptosis, potentially explaining ferroptotic resistance of the GS state68. In either case, targeting these pathways with Phenformin and Metformin (mitochondria
complex I inhibitors) or statins (sterol biosynthesis inhibitor) resulted in selective killing of GS compared to DGC in vitro. As proof of principle, we also demonstrated considerable in
vivo activity of these metabolic inhibitors in an orthotopic mouse model of DMG. In DIPG-007, SF7761, and murine PPK cell line pairs, GS populations could be selectively targeted by
inhibiting OXPHOS. In contrast, DIPG-XIII cell line pairs showed a limited differential phenotype to OXPHOS inhibition. Therefore, future studies with these models could help to determine
predictive biomarkers of sensitivity to OXPHOS targeting. It is conceivable that the limited differential phenotype between DIPG-XIII GS and DGC in outcomes such as cell proliferation,
purine nucleotide pools, TCA cycle metabolites, OCR, SRC, energy charge, sensitivity to radiation, and sensitivity to OXPHOS inhibitors may result from oncogenic signaling related to _MYC_
and _EGFR_. Indeed, the greater than two-fold upregulation of _MYC_ and _EGFR_ seen in DIPG-007 and SF7761 GS, in comparison to their DGC counterparts, was not similarly observed in
DIPG-XIII GS vs. DGC. Along these lines, a question that merits future investigation is whether specific oncogenic signaling pathway(s) or transcription factor(s) operating in distinct tumor
subpopulations direct metabolic reprogramming. For instance, MYC and EGFR have been reported to be critical for maintenance of the brain tumor-initiating cells in adult glioblastoma69,70.
The concentration of cholesterol is highest in the brain, at approximately 20% of total body cholesterol71. In addition, the majority of brain cholesterol results from de novo synthesis,
rather than uptake from circulation or peripheral tissues72. These results may provide mechanistic insight into the dependence of stem-like GS on cholesterol, and not on other outputs of the
sterol biosynthesis pathway. Further, astrocytes are known to be the predominant producers and suppliers of cholesterol to other cells in the brain, including cancer cells73. Indeed, a
dependency on cholesterol and the liver X receptors (LXR) axis as well as lanosterol synthase has been reported in brain tumors74,75. Our study, therefore, adds to the growing evidence of a
metabolic dependency of brain tumors on cholesterol and specifically presents cholesterol targeting as a therapeutic inroad for stem-like and tumorigenic H3K27M midline gliomas. Targeting
DMG via OXPHOS and cholesterol inhibition is a promising strategy in that the inhibitors of these pathways are clinically approved drugs and have been evaluated as chemo-sensitization agents
in cancer clinical trials58,59. Moreover, a number of statins are known to penetrate the blood brain barrier63,64. In addition, Metformin, a biguanide and analog of phenformin, has been
used in the clinic for several decades, and it is currently being tested in several cancer clinical trials as a chemo-adjuvant. Importantly, it too displays some degree of brain
penetrantance62. A mechanistic caveat with biguanides is discerning the contribution from their dual therapeutic actions. As our in vitro studies demonstrate, biguanides are inhibitors of
mitochondrial respiration; however, in organisms, biguanides also lower circulating glucose and insulin76,77. We propose that the anti-tumor activity observed in our in vivo models reflect
direct cancer cell targeting, based on the concentrations of phenformin achieved in vivo relative to its efficacy in vitro. However, future studies will be required to determine the impact
of blood glucose and insulin lowering in this context. In either case, we put forth that targeting mitochondria OXPHOS and cholesterol biosynthesis could potentially have immediate clinical
utility for DMG patients. Lastly, given the limited combinatorial activity of OXPHOS inhibitors and statins, future studies will be required to test efficacy alongside ionizing radiation
therapy. Metabolic dependencies have been investigated in H3K27M gliomas in comparison to H3WT tumors or normal brain tissue, and these studies have revealed dependencies on glucose,
glutamine and mitochondrial metabolism24,25,26. Our study investigates the differentiation-state dependent metabolic vulnerabilities in H3K27M DMGs and therefore adds to the growing body of
work on DMG metabolism. Notably, our work presents actionable metabolic vulnerabilities that can be leveraged to develop treatment options for this devastating disease (Fig. 7F). With the
recent clinical promise of ONC201, it is possible that combination therapies can be devised to target heterogenous populations of H3K27M DMG tumor cells. Indeed, the findings from this study
are significant in that they provide a framework for future investigations that could, by extension, have broad implications in the rational design of precision treatment approaches for
H3K27M DMG patients based on tumor composition and abundance of specific tumor cell-types. METHODS ETHICS STATEMENT All animal procedures used in this study were approved by the University
of Michigan Animal Care and Use Committee. Tumur size/burden was monitored every 2–3 days. In accordance with protocol, if animals became moribund or exhibited neurological symptoms, they
were immediately euthanized. CELL LINES AND CULTURE CONDITIONS HSJD-DIPG-007 (referred to as DIPG-007, H3.3K27M) was obtained from Dr. Rintaro Hashizume, Northwestern University; RRID:
CVCL_VU70. SU-DIPG-XIII (referred to as DIPG-XIII, H3.3K27M) was obtained from Dr. Michelle Monje, Stanford University; RRID: CVCL_6948. SF7761 (H3.3K27M) was purchased from Millipore Sigma
(#SCC126). All cells were cultured in a humidified incubator at 37 °C and 5% CO2. DIPG-007 and DIPG-XIII GS were cultured in base media containing equal parts Neurobasal-A Medium (Gibco;
#10888022) and DMEM/F12 (Gibco; #11330032) with added HEPES (10 mM) (Gibco; #15630080), Sodium Pyruvate (1 mM) (Gibco; #11360070), MEM NonEssential Amino Acids Solution (1X) (Gibco;
#11140050), GlutaMAX-I Supplement (1X) (Gibco; #35050061), and supplemented with fresh B-27 Supplement minus vitamin A (1X) (Gibco; #12587010), Heparin Solution (2 μg/mL) (StemCell
Technologies; #07980), human-EGF (20 ng/mL) (Peprotech; #AF-100-15), human-bFGF (20 ng/mL) (Peprotech; AF-100-18B), PDGF-AA (10 ng/mL) (Peprotech; 100-13 A), and PDGF-BB (10 ng/mL)
(Peprotech; #100-14B). SF7761 GS were cultured in a base media containing Neurobasal-A Medium with added N-2 Supplement (1X) (Gibco; #17502048), B-27 Supplement (1X) (Gibco; #17504044),
L-glutamine (2 mM) (Gibco; #25030081) and supplemented with fresh Heparin Solution (2 μg/mL), human-EGF (20 ng/mL), human-bFGF (20 ng/mL), and BSA (45 ng/ml) (Sigma; #A8412). PPK cells were
generated as an In Utero Electroporation (IUE) murine model of H3K27M glioma. IUE was performed using sterile technique on isoflurane/oxygen-anesthetized pregnant C57BL/6 or CD1 females at
E13.5. Tumors were generated with lateral ventricle (forebrain) introduction of plasmids: (1) PB-CAG-DNp53-Ires-Luciferase (dominant negative TP53), (2) PB-CAG-PdgfraD824V-Ires-eGFP (PDGFRA
D842V), and (3) PB-CAG-H3.3 K27M-Ires-eGFP (H3K27M), and are therefore referred to as the “PPK” model50. PPK GS were cultured in base media containing Neurobasal-A Medium (1X), Sodium
Pyruvate (1 mM), MEM Non-Essential Amino Acids (1X), L-glutamine (2 mM), Antibiotic-Antimycotic (1X) (Gibco; #15240096) and supplemented with fresh B-27 Supplement (1X), N-2 Supplement (1X),
Heparin (2 μg/mL), EGF (20 ng/mL), and FGF (20 ng/mL). Differentiated human and murine H3K27M glioma cells were generated by dissociating the respective gliomaspheres into single cells with
Accutase (Innovative Cell Technologies; #AT104) and subsequently cultured and maintained in the respective base media supplemented with 10% FBS (Corning; #35-010-CV) for 14 days to generate
a monolayer adherent culture. All cell lines used were routinely tested for mycoplasma using MycoAlert PLUS (Lonza; #LT07-710) and were validated by STR profiling. For STR profiling, DGC
and GS of DIPG-007, DIPG-XIII and SF7761 (2 million cells each) were collected, washed once with PBS, and snap frozen for shipment to the Arizona Genetics Core for cell line authentication
(https://azgc.arizona.edu/faq/cell-line-authentication). Briefly, genomic DNA was isolated using the Qiagen DNA Easy Blood and Tissue Kit (#69506) per the manufacturer’s recommended protocol
and was genotyped for 15 Autosomal STR loci and Amelogenin (X/Y) using the Promega PowerPlex 16 HS PCR kit (#DC2101). PCR products were separated by capillary electrophoresis using an AB
3730 DNA Analyzer. Electropherograms were analyzed from the.fsa files and allelic values assigned using Soft Genetics, Gene Marker Software Version 3.0.1. Cell authentication was verified
using the reference databases ATCC, DSMZ, and JCRB, with a minimum 80% match threshold indicating a shared genetic history. PROLIFERATION ASSAY DGC or GS in culture were dissociated into
single cells with 0.25% Trypsin/EDTA (Gibco; #25200114) or Accutase, respectively. Following this, 200,000 cells were plated in 60 mm dishes, and cultured in their respective growth media
for up to 12 days with media replenished every 3 days. At the indicated times, cells were again dissociated and counted using the Countess II FL Automated Cell Counter (Invitrogen) to assess
cell proliferation. DRUG TREATMENT AND VIABILITY ASSAY The following compounds used in this study were purchased from Cayman Chemicals: (1S,3 R)- RSL3 (RSL3, #19288), Ferrostatin-1
(#17729), z-vad-FMK (#14463), Necrosulfonamide (#20844), Bafilomycin A-1 (#11038), Metformin (#13118), Phenformin (#14997), IACS-010759 (#25867), Atorvastatin (#10493), Fluvastatin
(#10010334), Pitavastatin (#15414), Mevalonate (#20348), Farnesyl Pyrophosphate (#63250), Geranylgeranyl Pyrophosphate (#63330), and Coenzyme Q10 (#11506). Cholesterol-Water Soluble
(Cholesterol–methyl-β-cyclodextrin, #C4951) and Trolox (#238813) were purchased from Millipore Sigma. Equal numbers of DIPG-007, SF7761 and DIPG-XIII GS and DGC were plated in white opaque
96-well plates at 2000–3000 cells per well and incubated overnight. Cells were treated with compounds at the indicated concentrations and lengths of time described in the figure legends. At
end point, an equal volume of Cell Titer-Glo 2.0 (Promega; #G9242) or Cell Titer-Glo 3D (Promega; #G9683) reagent was added to each well and viability assessed according to the
manufacturer’s protocol. Luminescence was detected and measured using a SpectraMax M3 (Molecular Devices, San Jose, CA) and data was analyzed with GraphPad Prism software. CELL CULTURE
IRRADIATION DGC cultures were seeded at 2000 cells per well in 96-well white-walled culture plates and allowed to adhere for 24hrs. GS cultures (2000 cells/well) were then added to these
culture plates, which were then treated with increasing doses of radiation (0, 2, 4, 6, 8 Gy). Fresh media was spiked in all wells on day 4 of the experiment. For combination studies,
DIPG-007 GS cultures (2000 cells per well) were seeded in 96-well white-walled culture plates and treated with increasing doses of Phenformin (0, 3, 10, 30, and 60 µM) at 24 h. Cells were
then irradiated with 2 Gy either 24hrs or 72hrs later. Fresh Phenformin-treated media was spiked on day 4 immediately following radiation treatment. Cell viability was determined using
Promega’s CellTiter-Glo 3D Cell Viabilty Assay reagent at day 7 post-treatment using a SpectraMax M3 (Molecular Devices, San Jose, CA). Irradiations (2 Gy per min) were performed by the
University of Michigan Experimental Irradiation Core using a Philips RT250 (Kimtron Medical), in accordance with literature precedent78. DETECTION OF LIPID ROS To assess levels of lipid ROS
in cells, 200,000 DGC were plated in a 6-well plate overnight and treated with the indicated compounds. At end point, cells were washed twice with PBS and stained for 20 min with 2 µM
C11-BODIPY (Invitrogen; #D3861) in a phenol red-free media. Following staining, cells were washed twice with PBS and dissociated to single cells with trypsin. The cells were then transferred
to round-bottom 96-well plates on ice, co-stained with Sytox-blue (Invitrogen; #S34857) to distinguish viable cells, and analyzed on a ZE5 Cell analyzer (Bio-Rad Laboratories, Hercules,
CA). C11-BODIPY signal was captured with the FITC channel. Analysis of data was performed using FlowJo v.10 software. SEAHORSE BIOENERGETICS ASSAY The cellular bioenergetic state was
analyzed using a Seahorse XF-96 Extracellular Flux Analyzer (Agilent Technologies, Santa Clara, CA). The sensor cartridges were incubated in deionized water overnight, and on the day of the
assay, the cartridges were hydrated in XF Calibrant Solution (Agilent; #103059-000) for 1 h in a non-CO2 incubator at 37 °C. The hydrated cartridges were loaded with oligomycin (1 μM), FCCP
(1 μM), rotenone (0.1 μM), and antimycin A (1 μM) to perform the Seahorse XF Cell Mito Stress Test (Agilent; #103015-100). Concurrently, 96-well Seahorse cell culture plates were coated
overnight with laminin, and on the day of the assay, dissociated DIPG GS were washed and resuspended in Seahorse XF DMEM medium (Agilent; #103575) supplemented with XF Glutamine Solution
(2.5 mM) (Agilent; #103579), XF Glucose Solution (17.5 mM) (Agilent; #103577), XF Sodium Pyruvate Solution (1 mM) (Agilent; #103578), MEM Non-Essential Amino Acids Solution (1X) (Gibco),
human-EGF (20 ng/mL) (Peprotech), human-bFGF (20 ng/mL) (Peprotech), and Heparin (2 μg/mL) (StemCell Technologies). Dissociated DGC were washed and resuspended in Seahorse XF DMEM medium
(Agilent) supplemented with similar concentrations of XF Glutamine Solution, XF Glucose Solution, SXF Sodium Pyruvate Solution, and MEM Non-Essential Amino Acids Solution. DGC and GS single
cells (150,000 to 200,000 cells) were seeded on laminin-coated plates and allowed to equilibrate for 30 min in a non-CO2 incubator at 37 °C. Data were then acquired on the Seahorse analyzer.
Following data acquisition, measurements were normalized based on cell number using the CyQuant NF Cell Proliferation Assay (Invitrogen; #C35006). For the Mito stress test, the basal oxygen
consumption rate (basal OCR) was determined based on basal OCR measurements taken prior to addition of inhibitors. The spare respiratory capacity (SRC) was determined by subtracting basal
OCR from maximal OCR measurements. Seahorse analysis was performed using the Wave 2.3 software. METABOLOMICS METABOLITE EXTRACTION To generate intracellular metabolite fractions, an equal
number of GS and DGC were cultured in 6-well plates for 36 h. Growth media was then removed, cells were lysed with ice-cold 80% methanol on dry ice for 20 min, and lysates were collected and
clarified by centrifugation. The metabolite load of intracellular fractions was normalized to protein content of parallel samples, and these volumes were then lyophilized in a Savant
SPD1030 SpeedVac (ThermoScientific). Dried metabolite pellets were resuspended in 50:50 mixture of HPLC-grade methanol:dH2O and subjected to metabolomics analysis. LC/MS-BASED SNAPSHOT
METABOLOMICS LC/MS-based Metabolomics was performed on an Agilent 1290 Infinity II LC-coupled to a 6470 Triple Quadrupole (QqQ) tandem mass spectrometer (MS/MS)79,80. Briefly, Agilent
Masshunter Workstation Software LC/MS Data Acquisition for 6400 Series Triple Quadrupole MS with Version B.08.02 was used for compound optimization, calibration, and data acquisition. The
QqQ data were pre-processed with Agilent MassHunter Workstation QqQ Quantitative Analysis Software (B0700). Two-tailed t-test with a significance threshold level of 0.05 was applied to
determine statistical significance between conditions. Graphs were generated using GraphPad Prism software. Heatmaps were generated and data clustered using Morpheus Matrix Visualization and
analysis tool (https://software.broadinstitute.org/morpheus). Pathway analyses were conducted using MetaboAnalyst (https://www.metaboanalyst.ca). Unprocessed Snapshot metabolomics data are
provided in Source Data File 2. U13C-GLUCOSE ISOTOPE TRACING As a glucose-free version of DMEM/F12 was not commercially available, glucose-free DMEM (Gibco; #A10443001) and glucose-free
Neurobasal-A Medium (Gibco; #A2477501) replenished with equivalent concentrations of glutamine and sodium pyruvate were used to prepare the 1:1 glucose-free isotope tracing base media used
in this assay. DIPG-007 GS and DGC were seeded at 300,000 cells per 6-well for 24hrs in their respective growth media. DIPG-007 GS-containing media was then collected and GS cells were spun
down and resuspended in 2 mL supplemented isotope tracing media containing 21.25 mM of either uniformly labeled 13C-glucose (Cambridge Isotope Laboratories; #CLM-1396-5) or 12C-glucose
(Sigma; #G7528). The same amount of isotope tracing base media supplemented with 10% dialyzed FBS (Cytiva; #SH30079.03) containing either 21.25 mM uniformly labeled 13C-glucose (Cambridge
Isotope Laboratories) or 12C-glucose (Sigma) was added to DIPG-007 DGC cells following aspiration of the plating media. Metabolite extraction was performed at 0.25, 1, 4, and 24 hour time
points using 80% cold MeOH. Samples were normalized to the protein content of a parallel sample and were then lyophilized via Speed Vac. The isotope tracing experiments utilized the same
chromatography as described in the Snapshot Metabolomics section, which was coupled to an Agilent Q-TOF 6545 mass spectrometer. LC/MS was performed as previously described80. Data processing
was performed in Agilent MassHunter Workstation Profinder 10.0 Build 10.0.10062.0. Isotopologue distributions were derived from a compound standard library built in Agilent MassHunter PCDL
(Personal Compound and Database Library) v7.0. LIPIDOMICS DIPG-007 DGC and GS cultures with U13C-glucose tracing were prepared as described above. Lipid extraction was performed as described
by Bielawski81 with slight modifications. Samples were thawed on ice and then samples were extracted with 1.0 mL of IPA:Water:EtOAc (30:10:60, v:v:v) and internal standard mixture of
EquiSPLASH™ LIPIDOMIX® Quantitative Mass Spec Internal Standard (Avanti Polar Lipids, Birmingham, AL). The extract was vortexed and sonicated for 2 min, followed by centrifugation for 10 min
at 8000× _g_ at 4 °C. The organic upper phase was transferred to a new tube. The pellet was re-extracted with an additional 0.5 mL of IPA:Water:EtOAc (30:10:60, v:v:v). The supernatants
were combined and placed at −20 °C for 24 h. The supernatants were dried down using a speed vac. The dried sample was reconstituted in 150 µL Solvent A. The suspension was vortexed for 5
minutes and then centrifuged for 10 min at 17,000 × _g_ at 4 °C. The supernatant was transferred to an auto-sampler vial for UHPLC-MS analysis. Lipid profiling was conducted using a Vanquish
UHPLC system with an Orbitrap Fusion Lumos Tribrid™ mass spectrometer using a H-ESI™ ion source (all Thermo Fisher Scientific, Waltham, MA) with a Waters ACQUITY UPLC CSH C18 column (150 ×
1 mm, 1.7 µm particle size, Milford, MA). Solvent A was HPLC grade water:acetonitrile (40:60, v:v) with 0.1% formic acid and 10 mM ammonium formate. Solvent B was HPLC grade
isopropanol:acetonitrile (95:5, v:v) with 0.1% formic acid and 10 mM ammonium formate. The column was maintained at 65 °C and a flow rate was set at of 110 µL /min. The gradient of the
solvent B is 15% (B) at 0 min, 30% (B) at 2 minutes, 2–2.5 min 48% (B), 2.5–11 min 82% (B), 11–11.01 min 99% (B), 11.01–12.95 min 99% (B), 12.95–13 min 15% (B), and 13–15 min 15% (B). Data
acquisition was carried out in positive charge mode, with the ion source spray voltage configured to 4000 V. The mass spectrometry analysis spanned a scan range of 200–1000 m/z for the full
scan, and the MS1 resolution was established at 500 K at m/z 200. The AcquireX mode was employed for the MS2 acquisition, which was performed with a stepped collision energy of 30%, along
with a 5% spread for the fragment ion MS/MS scan. Raw data was converted into mzML format using Proteowizard mscovert software82. MS-DIAL software (verion 4.9.221218)83 was used for general
lipidomics data analysis including compound identification with LipidBlast, which is default library in MS-DIAL. ENERGY CHARGE CALCULATION For each sample, the ion current from the LC/MS
analysis for adenosine triphosphate (ATP), adenosine diphosphate (ADP), and adenosine monophosphate (AMP) levels were enumerated, and the adenylate energy charge (AEC) was calculated by
applying the formula [(ATP) + 0.5(ADP)]/ [(ATP) + (ADP) + (AMP)]. The ratio of ATP/ADP was evaluated by directly determining the ratio of ATP to ADP metabolite levels in each cell line. RNA
SEQUENCING Total RNA was extracted from DIPG-007, SF7761, and DIPG-XIII GS and DGC using the RNeasy Mini Kit (Qiagen) according to the manufacturer’s instructions. Strand-specific, poly-A+
libraries were prepared using NEBNext Ultra II Directional RNA Library Prep Kit (New England Biolab; #E7760L), the Poly(A) mRNA Magnetic Isolation Module (New England Biolab; #E7490L), and
NEBNext Multiplex Oligos for Illumina Unique Dual (New England Biolab; #E6440L). Sequencing was performed on the NovaSeq-6000 (Illumina), yielding 150-base, paired-end reads. Library
preparation and sequencing were performed by the University of Michigan Advanced Genomics Core (Ann Arbor, MI). The reads were trimmed using Trimmomatic v0.3684 and the library qualities
were assessed using FastqQC v0.11 for trimmed reads (https://www.bioinformatics.babraham.ac.uk/projects/fastqc/). RSEM v1.3.1 and STAR v2.5.2a were used to generate paired-end alignments and
counts85,86. Differential gene expression analysis was performed using DESeq2 v1.26.0 and the _apeglm_ shrinkage estimator was used to adjust log2 fold-changes87. Normalized counts were
obtained DESeq2 (default method; median of ratios). Differentially expressed genes were defined as having adjusted _p_-value < 0.05 and fold change > 1.5 (up or down). Variance
stabilized transform (VST) gene counts were used in principal component analysis to identify the major sources of variance and evaluate the similarity of replicates. The reference sequence
hg38 (GRCh38) and annotations, including gene IDs, were obtained from GENCODE v29. Differentially expressed genes were analyzed using GSEA using the HALLMARK gene sets. DIPG AND DMGS DATASET
ANALYSIS The human DIPG and DMG dataset was mined from Mackay et al.40. The downloaded patient samples contained _n_ = 78; Female=41, Male=28, unknown=9. Age range was 1.2–17.9 years
(average 9.8 ± 12 years). Expression levels of GS-related genes in 76 H3K27M diffuse midline gliomas were segregated into high vs. low gene expression categories using unbiased K-means
clustering (_K_ = 2 to assign two groups). Kaplan-Meier analysis was then performed between high (defined as upper quartile) vs. low (all remaining samples) tumors to determine differences
in overall survival. Data were analyzed by the Log rank test. WESTERN BLOT To assess protein levels, DIPG-007, SF7761, DIPG-XIII GS and DGC were lysed in RIPA buffer (Sigma; #R0278)
containing protease (Roche; #04693132001) and phosphatase (Sigma; #P5726) inhibitors. Protein concentrations from whole cell lysates were determined using the Pierce BCA Protein Assay Kit
(#23227), according to the manufacturer’s protocol. Equal amounts of protein were subjected to separation on SDS-PAGE and transferred to a methanol-activated PVDF membrane. Membranes were
blocked with 5% milk in TBST (Tris-buffered saline containing 0.1% Tween 20) followed by incubation with primary antibodies diluted in 5% milk or BSA TBST at 4 °C overnight. The following
primary antibodies and dilutions were used: OLIG2 (Cell Signaling Technology (CST); #65915; 1:1000), PARP (CST; #9542; 1:1000), HSP90 (CST; #4874; 1:10,000) and alpha-TUBULIN (clone 11H10,
CST; #2125; 1:10,000). Following primary antibody incubation, the membranes were washed 3 times with TBST and incubated with species-appropriate secondary antibodies conjugated to
horseradish peroxidase (HRP) at 1:10,000 dilution for 1 h at room temperature. Membranes were then washed 3× with TBST and chemiluminescence was detected using Clarity (Bio-Rad; #1705060) or
Clarity Max (Bio-Rad; #1705062) ECL substrate. The signal was captured with a Bio-Rad ChemiDoc imager and analyzed using Image Lab software. MOUSE STUDIES Animal experiments were performed
after approval from the University of Michigan Committee on Use and Care of Animals and were conducted as per NIH guidelines for animal welfare. All animal procedures were approved by
Institutional Animal Care & Use Committee (IACUC) at the University of Michigan (IACUC approval # PRO00008865). Animals were housed and cared for according to standard guidelines with
free access to standard diet (irradiated 5Lod (LabDiet)) and water ad libitum at constant ambient temperature and a 12-hour light cycle. All experiments were performed on NOD-SCID-IL2R gamma
chain-deficient (NSG) mice that were 8–10 weeks old, with males and females used equally. Mice, including littermates of the same sex, were randomly assigned to control or treatment
conditions. All animal experiments were performed in a blinded manner. IN VIVO XENOGRAFT TUMOR STUDIES Luciferase-expressing DIPG-007 GS (400,000 cells) suspended in 2 μl PBS were injected
into the pons to establish orthotopic xenografts under anesthesia, as follows. NSG mice were anesthetized with 75 mg/kg dexmedetomidine and 0.25 mg/kg ketamine by intraperitoneal injection.
Carprofen (5 mg/kg) was used for analgesia. Mice were mounted on a stereotaxic device. A small sagittal incision was made using a scalpel and a small hole was created using a micro drill at
1.0 mm posterior and 0.8 mm lateral left from lambda. A sterile Hamilton syringe was used to inject cells. Half of the cells were injected at 5 mm depth from the inner base of the skull and
the remaining cells were injected after 0.5 mm retraction in order to implant cells into the pontine tegmentum. After surgery, 1 mg/kg atipamezole solution was intraperitoneally injected for
anesthesia reversal. Tumor engraftment was confirmed by bioluminescence imaging. Treatment and controls groups were delineated in a random fashion after mice developed tumors. Tumor
monitoring with bioluminescence was performed in a blinded manner. Treatment commenced 3 weeks post-tumor implantation. The mice were randomized into 4 groups receiving either vehicle (PBS),
Pitavastatin (10 mg/kg), Phenformin (50 mg/kg), or combination Pitavastatin (10 mg/kg) and Phenformin (50 mg/kg). The drugs were administered intraperitoneally using a 5-day on/2-day off
course for 9 weeks. Tumor size was measured using bioluminescent imaging (IVIS) up to 10 weeks post-implantation, at which mice were then monitored for end-point survival. At end point, mice
were euthanized via carbon dioxide and brain tissues harvested for immunohistochemistry analysis. BIOLUMINESCENT IMAGING 4 × 10⁵ DGC or GS DIPG-007 cells were suspended in 2 µL of media and
injected into the cerebella of NSG mice, as described above. Tumor engraftment was confirmed by bioluminescence imaging. Luciferin (100 uL of a 15 mg/mL dilution in PBS) was injected
intraperitoneally into each mouse. Mice were anesthetized and placed into the IVIS Spectrum In Vivo Imaging System (PerkinElmer) and imaged, as described previously24. The maximum tumor
volume permitted was 8 mm × 3 within the mouse pons. IMMUNOHISTOCHEMISTRY Tissue sections on slides were deparaffinized with Histo‐Clear (National Diagnostics; #HS200) and re-hydrated with
graded ethanol and water. Sections were quenched with 1.5% hydrogen peroxide in 100% methanol for 15 min at room temperature. Antigen retrieval was performed in sodium citrate buffer (2.94 g
sodium citrate, 500 μl Tween 20, pH 6.0) and slides were maintained at a rolling boil for 20 min. After cooling, tissue sections were blocked in 2.5% bovine serum albumin (Sigma; #A2153),
0.2% Triton X‐100, in PBS for 1 h at room temperature. Sections were incubated overnight at 4 °C with primary antibodies diluted in blocking buffer: anti-OLIG2 (CST; #65915; 1:100),
anti-KI67 (Abcam; #ab15580; 1:1000), anti-CC3 (CST; #9664; 1:100), anti-GFAP (Dako; #Z0334; 1:1000), anti-S100 (Dako; #GA50461-2; 1:200). After rinsing with PBS, slides were incubated for 1
h at room temperature with secondary antibodies diluted in blocking buffer. Endogenous biotin, biotin receptors, and avidin binding site blocking was performed using the Avidin/Biotin
Blocking Kit (Vector Laboratories; #SP-2001) per manufacturer’s protocol. Substrate reaction and detection was performed using DAB Peroxidase (HRP) Substrate Kit (With Nickel),
3,3′-Diaminobenzidine (Vector Laboratories; #SK-4100) as detailed per the manufacturer’s protocol. Slides were counterstained with Mayer’s hematoxylin solution, mounted in Permount Mounting
Medium (Fisher Chemical; #SP15-100), coverslipped, and allowed to dry overnight before imaging. Stained slides were imaged with CellSens Standard software using an Olympus BX53F microscope,
fitted with an Olympus DP80 digital camera (Olympus Life Science). 3–5 images were taken per slide at 20x magnification and positive DAB signal was quantified using QuPath software. Graphs
were generated and statistics were calculated using GraphPad Prism. Data in graphs are presented as the mean with standard deviation, including individual datapoints that represent an
average for each mouse. Data were analyzed with a one-way ANOVA, Tukey’s multiple comparisons test. STATISTICAL ANALYSIS Statistical analyzes were performed using GraphPad Prism (Graph Pad
Software Inc). For assessment of statistical significance between treatments and stimuli in growth curves, area under the curve (AUC) was employed. Two-group comparisons were analyzed using
the unpaired two-tailed Student’s t-test. Error bars represent mean ± standard deviation, unless noted otherwise, and the significance annotations are indicated in figure legends and Source
data file. For all figures, _p_-value < 0.05 was considered statistically significant. The number and type of experimental replicates as well as the explanation of significant values are
indicated in the figure legends. REPORTING SUMMARY Further information on research design is available in the Nature Portfolio Reporting Summary linked to this article. DATA AVAILABILITY
RNAseq data are deposited at the GEO public repository using the following identifier, GSE197145. Raw metabolomics data are provided as Supplementary Data 2. The raw tracing data are
provided in Supplementary Data 3. Patient data were reanalyzed from Mackay et al.40. This study pooled data from EGA, Gene Expression Omnibus, and ArrayExpress; links below. Source data file
is provided with this manuscript. European Genome-Phenome Archive (EGA): EGAS00001000226, Mackay, et al.40 https://ega-archive.org/datasets/EGAD00001000134. EGAS0000100192, Parker, et al.88
https://ega-archive.org/studies/EGAS00001000192. EGAS00001000575, Buczkowicz, et al.89 https://ega-archive.org/studies/EGAS00001000575. EGAS00001000720, Fontebasso, et al.90,
https://ega-archive.org/datasets/EGAD00001000792. EGAS00001001139, Mackay, et al.40 https://ega-archive.org/datasets/EGAD00001002006. Gene Expression Omnibus (GEO): GSE19578, Paugh, et al.91
https://www.ncbi.nlm.nih.gov/geo/query/acc.cgi?acc=GSE19578. GSE26576, Paugh, et al.92, https://www.ncbi.nlm.nih.gov/geo/query/acc.cgi?acc=GSE26576. GSE21420, Barrow, et al.93,
https://www.ncbi.nlm.nih.gov/geo/query/acc.cgi?acc=GSE21420. GSE34824, Schwartentruber, et al.6, https://www.ncbi.nlm.nih.gov/geo/query/acc.cgi?acc=GSE34824. GSE36245, Sturm, et al.94,
https://www.ncbi.nlm.nih.gov/geo/query/acc.cgi?acc=GSE36245. GSE36278, Sturm, et al.94, https://www.ncbi.nlm.nih.gov/geo/query/acc.cgi?acc=GSE36278. GSE50022, Buczkowicz, et al.89,
https://www.ncbi.nlm.nih.gov/geo/query/acc.cgi?acc=GSE50022. GSE50021, Buczkowicz, et al.89, https://www.ncbi.nlm.nih.gov/geo/query/acc.cgi?acc=GSE50021. GSE50024, Buczkowicz, et al.89,
https://www.ncbi.nlm.nih.gov/geo/query/acc.cgi?acc=GSE50024. GSE55712, Fontebasso, et al.90, https://www.ncbi.nlm.nih.gov/geo/query/acc.cgi?acc=GSE55712. ArrayExpress: E-TABM-857, Payne, et
al.95, https://www.ebi.ac.uk/biostudies/arrayexpress/studies/E-TABM-167. E-TABM-1107, Puget, et al.96, https://www.ebi.ac.uk/biostudies/arrayexpress/studies/E-TABM-1107 Source data are
provided with this paper. REFERENCES * Aziz-Bose, R. & Monje, M. Diffuse intrinsic pontine glioma: molecular landscape and emerging therapeutic targets. _Curr Opin Oncol_ 31, 522–530
(2019). Article PubMed PubMed Central CAS Google Scholar * Cohen, K. J., Jabado, N. & Grill, J. Diffuse intrinsic pontine gliomas-current management and new biologic insights. Is
there a glimmer of hope? _Neuro Oncol_ 19, 1025–1034 (2017). Article PubMed PubMed Central CAS Google Scholar * Vitanza, N. A. & Monje, M. Diffuse intrinsic pontine glioma: from
diagnosis to next-generation clinical trials. _Curr Treat Options Neurol_ 21, 37 (2019). Article PubMed PubMed Central Google Scholar * Gallitto, M. et al. Role of radiation therapy in
the management of diffuse intrinsic pontine glioma: a systematic review. _Adv Radiat Oncol_ 4, 520–531 (2019). Article PubMed PubMed Central Google Scholar * Wu, G. et al. Somatic
histone H3 alterations in pediatric diffuse intrinsic pontine gliomas and non-brainstem glioblastomas. _Nat Genet_ 44, 251–253 (2012). Article PubMed PubMed Central CAS Google Scholar *
Schwartzentruber, J. et al. Driver mutations in histone H3.3 and chromatin remodelling genes in paediatric glioblastoma. _Nature_ 482, 226–231 (2012). Article ADS PubMed CAS Google
Scholar * Khuong-Quang, D.-A. et al. K27M mutation in histone H3.3 defines clinically and biologically distinct subgroups of pediatric diffuse intrinsic pontine gliomas. _Acta Neuropathol_
124, 439–447 (2012). Article PubMed PubMed Central CAS Google Scholar * Cooney, T. M., Lubanszky, E., Prasad, R., Hawkins, C. & Mueller, S. Diffuse midline glioma: review of
epigenetics. _J Neurooncol_ 150, 27–34 (2020). Article PubMed CAS Google Scholar * Lulla, R. R., Saratsis, A. M. & Hashizume, R. Mutations in chromatin machinery and pediatric
high-grade glioma. _Science Advances_ 2, e1501354. * Wu, G. et al. The genomic landscape of diffuse intrinsic pontine glioma and pediatric non-brainstem high-grade glioma. _Nat Genet_ 46,
444–450 (2014). Article PubMed Central CAS Google Scholar * Mendez, F. M. et al. Epigenetic reprogramming and chromatin accessibility in pediatric diffuse intrinsic pontine gliomas: a
neural developmental disease. _Neuro Oncol_ 22, 195–206 (2020). Article PubMed CAS Google Scholar * Filbin, M. G. et al. Developmental and oncogenic programs in H3K27M gliomas dissected
by single-cell RNA-seq. _Science_ 360, 331–335 (2018). Article ADS PubMed PubMed Central CAS Google Scholar * Liu, I. et al. The landscape of tumor cell states and spatial organization
in H3-K27M mutant diffuse midline glioma across age and location. _Nat Genet_ 54, 1881–1894 (2022). Article PubMed PubMed Central CAS Google Scholar * Jessa, S. et al. K27M in
canonical and noncanonical H3 variants occurs in distinct oligodendroglial cell lineages in brain midline gliomas. _Nat Genet_ 54, 1865–1880 (2022). Article PubMed PubMed Central CAS
Google Scholar * Suvà, M. L. & Tirosh, I. Single-cell RNA sequencing in cancer: lessons learned and emerging challenges. _Molecular Cell_ 75, 7–12 (2019). Article PubMed Google
Scholar * Larson, J. D. et al. Histone H3.3 K27M Accelerates spontaneous brainstem glioma and drives restricted changes in bivalent gene expression. _Cancer Cell_ 35, 140–155.e7 (2019).
Article PubMed CAS Google Scholar * Nagaraja, S. et al. Histone variant and cell context determine H3K27M reprogramming of the enhancer landscape and oncogenic state. _Mol Cell_ 76,
965–980.e12 (2019). Article PubMed PubMed Central CAS Google Scholar * Haag, D. et al. H3.3-K27M drives neural stem cell-specific gliomagenesis in a human iPSC-derived model. _Cancer
Cell_ 39, 407–422.e13 (2021). Article PubMed CAS Google Scholar * Hanahan, D. Hallmarks of cancer: new dimensions. _Cancer Discov_ 12, 31–46 (2022). Article PubMed CAS Google Scholar
* Heiden, M. G. V. & DeBerardinis, R. J. Understanding the intersections between metabolism and cancer biology. _Cell_ 168, 657–669 (2017). Article PubMed Central Google Scholar *
Pal, S. et al. A druggable addiction to de novo pyrimidine biosynthesis in diffuse midline glioma. _Cancer Cell_ 40, 957–972.e10 (2022). Article PubMed PubMed Central CAS Google Scholar
* Casillo, S. M. et al. An ERK5-PFKFB3 axis regulates glycolysis and represents a therapeutic vulnerability in pediatric diffuse midline glioma. _Cell Rep_ 43, 113557 (2024). Article
PubMed CAS Google Scholar * Golbourn, B. J. et al. Loss of MAT2A compromises methionine metabolism and represents a vulnerability in H3K27M mutant glioma by modulating the epigenome. _Nat
Cancer_ 3, 629–648 (2022). Article PubMed PubMed Central CAS Google Scholar * Chung, C. et al. Integrated metabolic and epigenomic reprograming by H3K27M Mutations in Diffuse Intrinsic
Pontine Gliomas. _Cancer Cell_ 38, 334–349.e9 (2020). Article PubMed PubMed Central CAS Google Scholar * Przystal, J. M. et al. Imipridones affect tumor bioenergetics and promote cell
lineage differentiation in diffuse midline gliomas. _Neuro Oncol_ 24, 1438–1451 (2022). Article PubMed PubMed Central CAS Google Scholar * Venneti, S. et al. Clinical efficacy of ONC201
in H3K27M-mutant diffuse midline gliomas is driven by disruption of integrated metabolic and epigenetic pathways. _Cancer Discov_ 13, 2370–2393 (2023). Article PubMed PubMed Central CAS
Google Scholar * Tanrıkulu, B. et al. Preliminary findings of German-sourced ONC201 treatment in H3K27 altered pediatric pontine diffuse midline gliomas. _J Neurooncol_ 163, 565–575
(2023). Article PubMed Google Scholar * Jackson, E. R. et al. ONC201 in Combination with Paxalisib for the Treatment of H3K27-Altered Diffuse Midline Glioma. _Cancer Res_ OF1–OF17
https://doi.org/10.1158/0008-5472.CAN-23-0186 (2023). * Chi, A. S. et al. Pediatric and adult H3 K27M-mutant diffuse midline glioma treated with the selective DRD2 antagonist ONC201. _J
Neurooncol_ 145, 97–105 (2019). Article PubMed PubMed Central CAS Google Scholar * Baksh, S. C. & Finley, L. W. S. Metabolic coordination of cell fate by α-Ketoglutarate-dependent
dioxygenases. _Trends in Cell Biology_ 31, 24–36 (2021). Article PubMed CAS Google Scholar * Tsoli, M. et al. International experience in the development of patient-derived xenograft
models of diffuse intrinsic pontine glioma. _J Neurooncol_ 141, 253–263 (2019). Article PubMed CAS Google Scholar * Xu, C. et al. Patient-derived DIPG cells preserve stem-like
characteristics and generate orthotopic tumors. _Oncotarget_ 8, 76644–76655 (2017). Article PubMed PubMed Central Google Scholar * Azzarelli, R., Simons, B. D. & Philpott, A. The
developmental origin of brain tumours: a cellular and molecular framework. _Development_ 145, dev162693 (2018). * Vinci, M. et al. Functional diversity and cooperativity between subclonal
populations of pediatric glioblastoma and diffuse intrinsic pontine glioma cells. _Nat Med_ 24, 1204–1215 (2018). Article PubMed PubMed Central CAS Google Scholar * Hoffman, L. M. et
al. Spatial genomic heterogeneity in diffuse intrinsic pontine and midline high-grade glioma: implications for diagnostic biopsy and targeted therapeutics. _Acta Neuropathol Commun_ 4, 1
(2016). Article PubMed PubMed Central Google Scholar * Anderson, J. L. et al. The transcription factor Olig2 is important for the biology of diffuse intrinsic pontine gliomas. _Neuro
Oncol_ 19, 1068–1078 (2017). Article PubMed PubMed Central CAS Google Scholar * Furnari, F. B. et al. Malignant astrocytic glioma: genetics, biology, and paths to treatment. _Genes Dev_
21, 2683–2710 (2007). Article PubMed CAS Google Scholar * Sosunov, A. A., McKhann, G. M. & Goldman, J. E. The origin of Rosenthal fibers and their contributions to astrocyte
pathology in Alexander disease. _Acta Neuropathologica Communications_ 5, 27 (2017). Article PubMed PubMed Central Google Scholar * Yadav, V. N. et al. Therapeutic reversal of prenatal
pontine ID1 signaling in DIPG. 2021.05.10.443452 at https://doi.org/10.1101/2021.05.10.443452 (2021). * Mackay, A. et al. Integrated molecular meta-analysis of 1000 pediatric high-grade and
diffuse intrinsic pontine glioma. _Cancer Cell_ 32, 520–537.e5 (2017). Article PubMed PubMed Central CAS Google Scholar * Lapin, D. H., Tsoli, M. & Ziegler, D. S. Genomic insights
into diffuse intrinsic pontine glioma. _Front Oncol_ 7, 57 (2017). Article PubMed PubMed Central Google Scholar * Saratsis, A. M. et al. Comparative multidimensional molecular analyses
of pediatric diffuse intrinsic pontine glioma reveals distinct molecular subtypes. _Acta Neuropathol_ 127, 881–895 (2014). Article PubMed CAS Google Scholar * Sousa, C. M. et al.
Pancreatic stellate cells support tumour metabolism through autophagic alanine secretion. _Nature_ 536, 479–483 (2016). Article ADS PubMed PubMed Central CAS Google Scholar * Wang, X.
et al. Purine synthesis promotes maintenance of brain tumor initiating cells in glioma. _Nat Neurosci_ 20, 661–673 (2017). Article PubMed PubMed Central Google Scholar * Beyer, B. A. et
al. Metabolomics-based discovery of a metabolite that enhances oligodendrocyte maturation. _Nat Chem Biol_ 14, 22–28 (2018). Article ADS PubMed CAS Google Scholar * Viswanathan, V. S.
et al. Dependency of a therapy-resistant state of cancer cells on a lipid peroxidase pathway. _Nature_ 547, 453–457 (2017). Article PubMed PubMed Central CAS Google Scholar * Lee, J.,
You, J. H., Kim, M.-S. & Roh, J.-L. Epigenetic reprogramming of epithelial-mesenchymal transition promotes ferroptosis of head and neck cancer. _Redox Biol_ 37, 101697 (2020). Article
PubMed PubMed Central CAS Google Scholar * Mbah, N. E. & Lyssiotis, C. A. Metabolic regulation of ferroptosis in the tumor microenvironment. _J Biol Chem_ 101617 (2022)
https://doi.org/10.1016/j.jbc.2022.101617. * Skouta, R. et al. Ferrostatins inhibit oxidative lipid damage and cell death in diverse disease models. _J Am Chem Soc_ 136, 4551–4556 (2014).
Article PubMed PubMed Central CAS Google Scholar * Miklja, Z. et al. Everolimus improves the efficacy of dasatinib in PDGFRα-driven glioma. _J Clin Invest_ 130, 5313–5325 (2020).
Article PubMed PubMed Central CAS Google Scholar * Edwards, P. A. & Ericsson, J. Sterols and isoprenoids: signaling molecules derived from the cholesterol biosynthetic pathway.
_Annual Review of Biochemistry_ 68, 157–185 (1999). Article PubMed CAS Google Scholar * Brown, A. J. Cholesterol, statins and cancer. _Clinical and Experimental Pharmacology and
Physiology_ 34, 135–141 (2007). Article PubMed CAS Google Scholar * Marchetti, P., Fovez, Q., Germain, N., Khamari, R. & Kluza, J. Mitochondrial spare respiratory capacity:
mechanisms, regulation, and significance in non-transformed and cancer cells. _The FASEB Journal_ 34, 13106–13124 (2020). Article PubMed CAS Google Scholar * Divakaruni, A. S., Paradyse,
A., Ferrick, D. A., Murphy, A. N. & Jastroch, M. Analysis and interpretation of microplate-based oxygen consumption and pH data. _Methods Enzymol_ 547, 309–354 (2014). Article PubMed
CAS Google Scholar * Chapman, A. G., Fall, L. & Atkinson, D. E. Adenylate energy charge in Escherichia coli during growth and starvation. _J Bacteriol_ 108, 1072–1086 (1971). Article
PubMed PubMed Central CAS Google Scholar * De la Fuente, I. M. et al. On the dynamics of the adenylate energy system: homeorhesis vs homeostasis. _PLoS One_ 9, e108676 (2014). Article
ADS PubMed PubMed Central Google Scholar * Davies, J. T. et al. Current and emerging uses of statins in clinical therapeutics: a review. _Lipid Insights_ 9, 13–29 (2016). Article PubMed
PubMed Central Google Scholar * Chae, Y. K. et al. Statins as anti-cancer therapy; Can we translate preclinical and epidemiologic data into clinical benefit? _Discov Med_ 20, 413–427
(2015). PubMed Google Scholar * Kourelis, T. V. & Siegel, R. D. Metformin and cancer: new applications for an old drug. _Med Oncol_ 29, 1314–1327 (2012). Article PubMed CAS Google
Scholar * Zi, F. et al. Metformin and cancer: an existing drug for cancer prevention and therapy. _Oncol Lett_ 15, 683–690 (2018). PubMed Google Scholar * Jiang, W. et al. Repurposing
phenformin for the targeting of glioma stem cells and the treatment of glioblastoma. _Oncotarget_ 7, 56456–56470 (2016). Article PubMed PubMed Central Google Scholar * Yarchoan, M. &
Arnold, S. E. Repurposing diabetes drugs for brain insulin resistance in Alzheimer disease. _Diabetes_ 63, 2253–2261 (2014). Article PubMed PubMed Central Google Scholar * Sierra, S. et
al. Statins as neuroprotectants: a comparative in vitro study of lipophilicity, blood-brain-barrier penetration, lowering of brain cholesterol, and decrease of neuron cell death. _J
Alzheimers Dis_ 23, 307–318 (2011). Article PubMed CAS Google Scholar * Shepardson, N. E., Shankar, G. M. & Selkoe, D. J. Cholesterol level and statin use in Alzheimer disease: II.
review of human trials and recommendations. _Arch Neurol_ 68, 1385–1392 (2011). Article PubMed PubMed Central Google Scholar * Rosko, L., Smith, V. N., Yamazaki, R. & Huang, J. K.
Oligodendrocyte bioenergetics in health and disease. _Neuroscientist_ 25, 334–343 (2019). Article PubMed CAS Google Scholar * Yang, N., Xu, L., Lin, P. & Cui, J. Uric acid promotes
neuronal differentiation of human placenta-derived mesenchymal stem cells in a time- and concentration-dependent manner. _Neural Regen Res_ 7, 756–760 (2012). PubMed PubMed Central CAS
Google Scholar * Vidhya, S., Ramya, R., Coral, K., Sulochana, K. N. & Bharathidevi, S. R. Free amino acids hydroxyproline, lysine, and glycine promote differentiation of retinal
pericytes to adipocytes: A protective role against proliferative diabetic retinopathy. _Experimental Eye Research_ 173, 179–187 (2018). Article PubMed CAS Google Scholar * Freitas, F. P.
et al. 7-Dehydrocholesterol is an endogenous suppressor of ferroptosis. _Nature_ 626, 401–410 (2024). Article ADS PubMed CAS Google Scholar * Wang, J. et al. c-Myc Is required for
maintenance of glioma cancer stem cells. _PLoS One_ 3, e3769 (2008). Article ADS PubMed PubMed Central Google Scholar * Mazzoleni, S. et al. Epidermal growth factor receptor expression
identifies functionally and molecularly distinct tumor-initiating cells in human glioblastoma multiforme and is required for gliomagenesis. _Cancer Res_ 70, 7500–7513 (2010). Article PubMed
CAS Google Scholar * Dietschy, J. M. Central nervous system: cholesterol turnover, brain development and neurodegeneration. _Biol Chem_ 390, 287–293 (2009). Article PubMed PubMed
Central CAS Google Scholar * Björkhem, I. & Meaney, S. Brain cholesterol: long secret life behind a barrier. _Arterioscler Thromb Vasc Biol_ 24, 806–815 (2004). Article PubMed
Google Scholar * Karten, B., Campenot, R. B., Vance, D. E. & Vance, J. E. Expression of ABCG1, but not ABCA1, correlates with cholesterol release by cerebellar astroglia. _J Biol Chem_
281, 4049–4057 (2006). Article PubMed CAS Google Scholar * Villa, G. R. et al. An LXR-cholesterol axis creates a metabolic Co-dependency for brain cancers. _Cancer Cell_ 30, 683–693
(2016). Article PubMed PubMed Central CAS Google Scholar * Phillips, R. E. et al. Target identification reveals lanosterol synthase as a vulnerability in glioma. _Proc Natl Acad Sci
USA_ 116, 7957–7962 (2019). Article ADS PubMed PubMed Central CAS Google Scholar * Foretz, M., Guigas, B., Bertrand, L., Pollak, M. & Viollet, B. Metformin: from mechanisms of
action to therapies. _Cell Metab_ 20, 953–966 (2014). Article PubMed CAS Google Scholar * Pollak, M. Potential applications for biguanides in oncology. _J Clin Invest_ 123, 3693–3700
(2013). Article PubMed PubMed Central CAS Google Scholar * Karnak, D. et al. Combined inhibition of Wee1 and PARP1/2 for radiosensitization in pancreatic cancer. _Clin Cancer Res_ 20,
5085–5096 (2014). Article PubMed PubMed Central CAS Google Scholar * Lee, H.-J., Kremer, D. M., Sajjakulnukit, P., Zhang, L. & Lyssiotis, C. A. A large-scale analysis of targeted
metabolomics data from heterogeneous biological samples provides insights into metabolite dynamics. _Metabolomics_ 15, 103 (2019). Article PubMed PubMed Central Google Scholar * Kerk, S.
A. et al. Metabolic requirement for GOT2 in pancreatic cancer depends on environmental context. _Elife_ 11, e73245 (2022). Article PubMed PubMed Central CAS Google Scholar * Bielawski,
J. et al. Comprehensive Quantitative Analysis of Bioactive Sphingolipids by High-Performance Liquid Chromatography–Tandem Mass Spectrometry. in _Lipidomics: Volume 1: Methods and Protocols_
(ed. Armstrong, D.) 443–467 (Humana Press, Totowa, NJ, 2009). https://doi.org/10.1007/978-1-60761-322-0_22. * Chambers, M. C. et al. A cross-platform toolkit for mass spectrometry and
proteomics. _Nat Biotechnol_ 30, 918–920 (2012). Article PubMed PubMed Central CAS Google Scholar * Tsugawa, H. et al. MS-DIAL: data-independent MS/MS deconvolution for comprehensive
metabolome analysis. _Nat Methods_ 12, 523–526 (2015). Article PubMed PubMed Central CAS Google Scholar * Bolger, A. M., Lohse, M. & Usadel, B. Trimmomatic: a flexible trimmer for
Illumina sequence data. _Bioinformatics_ 30, 2114–2120 (2014). Article PubMed Central CAS Google Scholar * Li, B. & Dewey, C. N. RSEM: accurate transcript quantification from RNA-Seq
data with or without a reference genome. _BMC Bioinformatics_ 12, 323 (2011). Article PubMed PubMed Central CAS Google Scholar * Dobin, A. et al. STAR: ultrafast universal RNA-seq
aligner. _Bioinformatics_ 29, 15–21 (2013). Article CAS Google Scholar * Zhu, A., Ibrahim, J. G. & Love, M. I. Heavy-tailed prior distributions for sequence count data: removing the
noise and preserving large differences. _Bioinformatics_ 35, 2084–2092 (2019). Article PubMed CAS Google Scholar * Parker, M. et al. Assessing telomeric DNA content in pediatric cancers
using whole-genome sequencing data. _Genome Biol_ 13, R113 (2012). Article PubMed PubMed Central Google Scholar * Buczkowicz, P. et al. Genomic analysis of diffuse intrinsic pontine
gliomas identifies three molecular subgroups and recurrent activating ACVR1 mutations. _Nat Genet_ 46, 451–456 (2014). Article PubMed PubMed Central CAS Google Scholar * Fontebasso, A.
M. et al. Recurrent somatic mutations in ACVR1 in pediatric midline high-grade astrocytoma. _Nat Genet_ 46, 462–466 (2014). Article PubMed PubMed Central CAS Google Scholar * Paugh, B.
S. et al. Integrated molecular genetic profiling of pediatric high-grade gliomas reveals key differences with the adult disease. _J Clin Oncol_ 28, 3061–3068 (2010). Article PubMed PubMed
Central Google Scholar * Paugh, B. S. et al. Genome-wide analyses identify recurrent amplifications of receptor tyrosine kinases and cell-cycle regulatory genes in diffuse intrinsic
pontine glioma. _J Clin Oncol_ 29, 3999–4006 (2011). Article PubMed PubMed Central CAS Google Scholar * Barrow, J. et al. Homozygous loss of ADAM3A revealed by genome-wide analysis of
pediatric high-grade glioma and diffuse intrinsic pontine gliomas. _Neuro Oncol_ 2, 212–222 (2011). Article Google Scholar * Sturm, D. et al. Hotspot mutations in H3F3A and IDH1 define
distinct epigenetic and biological subgroups of glioblastoma. _Cancer Cell_ 22, 425–437 (2012). Article PubMed CAS Google Scholar * Payne, C. A. et al. Loss of prostaglandin D2 synthase:
a key molecular event in the transition of a low-grade astrocytoma to an anaplastic astrocytoma. _Mol Cancer Ther_ 7, 3420–3428 (2008). Article PubMed CAS Google Scholar * Puget, S. et
al. Mesenchymal transition and PDGFRA amplification/mutation are key distinct oncogenic events in pediatric diffuse intrinsic pontine gliomas. _PLoS One_ 7, e30313 (2012). Article ADS
PubMed PubMed Central CAS Google Scholar Download references ACKNOWLEDGEMENTS This work was funded by a joint Defeat DIPG and ChadTough Foundation fellowship award (NEM); Alex’s Lemonade
Stand Foundation POST Grant (DM); Alex’s Lemonade Stand Foundation (SV and CAL); University of Michigan Pediatric Brain Tumor Initiative (CK, SV, and CAL); R01NS110572, R01CA261926,
1R01NS127799 (SV); R01NS124607, R01NS110572 and DOD grant (CA201129P1) (CK). Metabolomics studies performed at the University of Michigan were supported by the Charles Woodson Research Fund
and the UM Pediatric Brain Tumor Initiative. Research reported in this publication was also supported by the National Cancer Institutes of Health under Award Number P30CA046592 using the
following Cancer Center Shared Resource(s): Flow Cytometry Core, Tissue and Molecular Pathology Core. Schematics and models were created using Biorender.com. AUTHOR INFORMATION AUTHORS AND
AFFILIATIONS * Chad Carr Pediatric Brain Tumor Center, University of Michigan, Ann Arbor, USA Nneka E. Mbah, Amy L. Myers, Peter Sajjakulnukit, Chan Chung, Derek Dang, Stefan R. Sweha,
Daniel R. Wahl, Carl J. Koschmann, Sriram Venneti & Costas A. Lyssiotis * Department of Molecular & Integrative Physiology, University of Michigan, Ann Arbor, USA Nneka E. Mbah, Amy
L. Myers, Zeribe C. Nwosu, Mengrou Shan, Daniella D. Maydan, Brandon Chen, Li Zhang, Megan Radyk, Brooke Lavoie & Costas A. Lyssiotis * Graduate Program in Cancer Biology, University of
Michigan, Ann Arbor, USA Peter Sajjakulnukit & Heather Giza * Laboratory of Brain Tumor Metabolism and Epigenetics, Department of Pathology, University of Michigan Medical School, Ann
Arbor, USA Chan Chung, Derek Dang, Stefan R. Sweha & Sriram Venneti * Department of New Biology, Daegu Gyeongbuk Institute of Science and Technology (DGIST), Daegu, South Korea Chan
Chung * Department of Surgery, University of Michigan, Ann Arbor, USA Joyce K. Thompson * Graduate Program in Immunology, University of Michigan, Ann Arbor, USA Hanna S. Hong * Graduate
Program in Molecular & Cellular Pathology, University of Michigan, Ann Arbor, USA Derek Dang * Neuroscience Graduate Program, University of Michigan, Ann Arbor, USA Stefan R. Sweha *
Graduate Program in Cellular and Molecular Biology, University of Michigan, Ann Arbor, USA Brandon Chen * Department of Biostatistics, School of Public Health, University of Michigan, Ann
Arbor, USA Brian Magnuson * Graduate Program in Chemical Biology, University of Michigan, Ann Arbor, USA Zirui Zhu * The Department of Pediatrics, Children’s Mercy Research Institute (CMRI),
Kansas, USA Viveka Nand Yadav * Huck Institutes of the Life Sciences, Pennsylvania State University, University Park, USA Imhoi Koo * Department of Biochemistry and Molecular Biology and
Department of Veterinary and Biomedical Sciences, the Pennsylvania State University, University Park, USA Andrew D. Patterson * Department of Radiation Oncology, University of Michigan
Medical School, Ann Arbor, USA Daniel R. Wahl * Department of Pediatrics, University of Michigan Medical School, Ann Arbor, USA Luigi Franchi, Carl J. Koschmann & Sriram Venneti *
University of Pittsburgh Hillman Cancer Center, Pittsburgh, USA Sameer Agnihotri * Department of Pathology, University of Michigan Medical School, Ann Arbor, USA Sriram Venneti * Department
of Internal Medicine, Division of Gastroenterology and Hepatology, University of Michigan, Ann Arbor, USA Costas A. Lyssiotis * Rogel Cancer Center, University of Michigan, Ann Arbor, USA
Costas A. Lyssiotis Authors * Nneka E. Mbah View author publications You can also search for this author inPubMed Google Scholar * Amy L. Myers View author publications You can also search
for this author inPubMed Google Scholar * Peter Sajjakulnukit View author publications You can also search for this author inPubMed Google Scholar * Chan Chung View author publications You
can also search for this author inPubMed Google Scholar * Joyce K. Thompson View author publications You can also search for this author inPubMed Google Scholar * Hanna S. Hong View author
publications You can also search for this author inPubMed Google Scholar * Heather Giza View author publications You can also search for this author inPubMed Google Scholar * Derek Dang View
author publications You can also search for this author inPubMed Google Scholar * Zeribe C. Nwosu View author publications You can also search for this author inPubMed Google Scholar *
Mengrou Shan View author publications You can also search for this author inPubMed Google Scholar * Stefan R. Sweha View author publications You can also search for this author inPubMed
Google Scholar * Daniella D. Maydan View author publications You can also search for this author inPubMed Google Scholar * Brandon Chen View author publications You can also search for this
author inPubMed Google Scholar * Li Zhang View author publications You can also search for this author inPubMed Google Scholar * Brian Magnuson View author publications You can also search
for this author inPubMed Google Scholar * Zirui Zhu View author publications You can also search for this author inPubMed Google Scholar * Megan Radyk View author publications You can also
search for this author inPubMed Google Scholar * Brooke Lavoie View author publications You can also search for this author inPubMed Google Scholar * Viveka Nand Yadav View author
publications You can also search for this author inPubMed Google Scholar * Imhoi Koo View author publications You can also search for this author inPubMed Google Scholar * Andrew D.
Patterson View author publications You can also search for this author inPubMed Google Scholar * Daniel R. Wahl View author publications You can also search for this author inPubMed Google
Scholar * Luigi Franchi View author publications You can also search for this author inPubMed Google Scholar * Sameer Agnihotri View author publications You can also search for this author
inPubMed Google Scholar * Carl J. Koschmann View author publications You can also search for this author inPubMed Google Scholar * Sriram Venneti View author publications You can also search
for this author inPubMed Google Scholar * Costas A. Lyssiotis View author publications You can also search for this author inPubMed Google Scholar CONTRIBUTIONS NEM and CAL conceived of and
designed this study. NEM, CJK, SV and CAL planned and guided the research. NEM, ALM, PS, CC, JKT, HSH, HG, DD, ZCN, MS, SRS, DDM, BC, LZ, BM, ZZ, MR, BL, VNY, IK performed experiments,
analyzed, and interpreted data. NEM, ALM, ADP, DRW, LF, SA, CJK, SV, and CAL were involved in the conceptual design of experiments and proofreading of manuscripts. NEM and CAL wrote the
manuscript. SV and CAL supervised the work carried out in this study. CORRESPONDING AUTHORS Correspondence to Sriram Venneti or Costas A. Lyssiotis. ETHICS DECLARATIONS COMPETING INTERESTS
In the past three years, C.A.L. has consulted for Astellas Pharmaceuticals, Odyssey Therapeutics, Third Rock Ventures, and T-Knife Therapeutics, and is an inventor on patents pertaining to
K-Ras regulated metabolic pathways, redox control pathways in pancreatic cancer, and targeting the GOT1-ME1 pathway as a therapeutic approach (US Patent No: 2015126580-A1, 05/07/2015; US
Patent No: 20190136238, 05/09/2019; International Patent No: WO2013177426-A2, 04/23/2015). All other authors declare no competing interests. PEER REVIEW PEER REVIEW INFORMATION _Nature
Communications_ thanks José Pedro Friedmann Angeli, Matthew Dun, and the other, anonymous, reviewer(s) for their contribution to the peer review of this work. A peer review file is
available. ADDITIONAL INFORMATION PUBLISHER’S NOTE Springer Nature remains neutral with regard to jurisdictional claims in published maps and institutional affiliations. SUPPLEMENTARY
INFORMATION SUPPLEMENTARY INFORMATION PEER REVIEW FILE DESCRIPTION OF ADDITIONAL SUPPLEMENTARY INFORMATION SUPPLEMENTARY DATA 1 SUPPLEMENTARY DATA 2 SUPPLEMENTARY DATA 3 REPORTING SUMMARY
SOURCE DATA SOURCE DATA RIGHTS AND PERMISSIONS OPEN ACCESS This article is licensed under a Creative Commons Attribution 4.0 International License, which permits use, sharing, adaptation,
distribution and reproduction in any medium or format, as long as you give appropriate credit to the original author(s) and the source, provide a link to the Creative Commons licence, and
indicate if changes were made. The images or other third party material in this article are included in the article’s Creative Commons licence, unless indicated otherwise in a credit line to
the material. If material is not included in the article’s Creative Commons licence and your intended use is not permitted by statutory regulation or exceeds the permitted use, you will
need to obtain permission directly from the copyright holder. To view a copy of this licence, visit http://creativecommons.org/licenses/by/4.0/. Reprints and permissions ABOUT THIS ARTICLE
CITE THIS ARTICLE Mbah, N.E., Myers, A.L., Sajjakulnukit, P. _et al._ Therapeutic targeting of differentiation-state dependent metabolic vulnerabilities in diffuse midline glioma. _Nat
Commun_ 15, 8983 (2024). https://doi.org/10.1038/s41467-024-52973-4 Download citation * Received: 01 March 2022 * Accepted: 27 September 2024 * Published: 17 October 2024 * DOI:
https://doi.org/10.1038/s41467-024-52973-4 SHARE THIS ARTICLE Anyone you share the following link with will be able to read this content: Get shareable link Sorry, a shareable link is not
currently available for this article. Copy to clipboard Provided by the Springer Nature SharedIt content-sharing initiative