Play all audios:
ABSTRACT Anthropogenic emissions alter atmospheric composition and therefore the climate, with implications for air pollution- and climate-related human health. Mortality attributable to air
pollution and non-optimal temperature is a major concern, expected to shift under future climate change and socioeconomic scenarios. In this work, results from numerical simulations are
used to assess future changes in mortality attributable to long-term exposure to both non-optimal temperature and air pollution simultaneously. Here we show that under a realistic scenario,
end-of-century mortality could quadruple from present-day values to around 30 (95% confidence level:12-53) million people/year. While pollution-related mortality is projected to increase
five-fold, temperature-related mortality will experience a seven-fold rise, making it a more important health risk factor than air pollution for at least 20% of the world’s population. These
findings highlight the urgent need to implement stronger climate policies to prevent future loss of life, outweighing the benefits of air quality improvements alone. SIMILAR CONTENT BEING
VIEWED BY OTHERS STRONG REGIONAL TRENDS IN EXTREME WEATHER OVER THE NEXT TWO DECADES UNDER HIGH- AND LOW-EMISSIONS PATHWAYS Article 09 September 2024 INTENSIFIED EXPOSURE TO COMPOUND EXTREME
HEAT AND OZONE POLLUTION IN SUMMER ACROSS CHINESE CITIES Article Open access 27 February 2025 COMPARISON OF WEATHER STATION AND CLIMATE REANALYSIS DATA FOR MODELLING TEMPERATURE-RELATED
MORTALITY Article Open access 25 March 2022 INTRODUCTION Atmospheric conditions have a significant impact on human health: exposure to temperature extremes and to air pollution poses
important risk for health. Increased air pollution has been associated directly with increased mortality1. Similarly, non-optimal temperature, defined as exposure to both high and low
temperatures, has also been implicated with increased mortality2. The Global Burden of Diseases (GBD) estimate3 finds that both these risk factors are responsible, in total, for the deaths
of roughly 6.5 (95% confidence level: 5.3-7.5) million people per year, ∼69% of which were caused by ambient air pollution. The most important atmospheric pollutant is PM2.5 (i.e.
particulate matter with aerodynamic diameter less than 2.5 _μ__m_), which accounts for roughly 90% of the mortality attributable to air pollution4. PM2.5 consists of fine particulate which,
thanks to its size, can pass through the respiratory barrier and enter the circulatory system, causing cardiovascular disease and other complications5. Simultaneous investigation of
projected air pollution and non-optimal temperature related mortality has been already partially investigated6, although only at urban and regional levels [e.g., refs. 7,8]. Human activities
exert a substantial influence on both risk factors. In fact, anthropogenic emissions into the atmosphere alter atmospheric composition and consequently the climate. It is therefore of
primary importance to project the evolution of air quality and surface temperature into the near and far future. In the Coupled Model Intercomparison Project (CMIP6) simulations9,10, a
series of Earth System Models (ESMs, i.e. global models with the added capability to explicitly represent biogeochemical processes11) have performed numerical simulations of temperature and
air quality for the present and up to the end of the century12. In this study, we estimate the current and future atmospheric health burden by calculating the global mortality attributable
to long-term exposure to non-optimal temperature and fine particulate matter at global scale. For this goal, we use model results from three ESMs participating in CMIP6. The model results
are combined with state-of-the-art exposure-response functions for non-optimal temperature and air pollution to estimate the total long-term atmospheric-related attributable mortality. The
estimates are presented as means of twenty-year periods, from 1990 to the end of the century (with ten-year intervals), so as to better represent the long-term effects. Three future climate
scenarios based on the Shared Socio-economic Pathways [13, SSP] are used, namely the most probable SSP2-4.5 ("middle of the road”) scenario, the sustainable scenario SSP1-2.6
("Taking the Green Road”), and the very pessimistic and unlikely SSP5-8.5 ("taking the highway”) scenario14. Only exposure to PM2.5, the most harmful pollutant, is considered here.
As different models have differing accuracy in representing present day estimates15, the models are downscaled and bias corrected (see section Methods) to ensure their consistency. Here we
present the ensemble means of mortality estimates based on the three ESMs, with the uncertainties representing the 95% confidence interval. RESULTS GLOBAL AND REGIONAL RESULTS The mortality
attributable to long-term exposure to non-optimal temperature and PM2.5 for 2000 (i.e., 1990–2009 mean) and the end of the century (i.e. 2080-2099 mean) is presented in Table 1, for each of
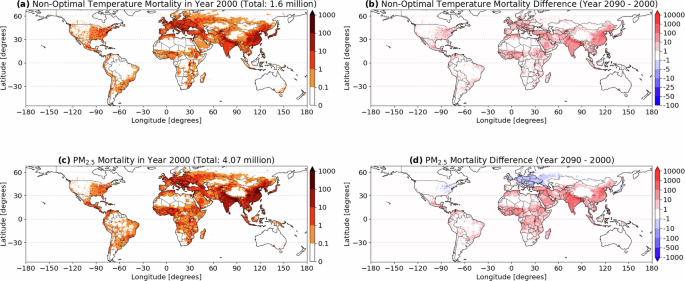
the 7 super regions defined by the GBD3 (results for individual countries can be found in the Supplementary Tables 1–4)). For the SSP2-4.5 scenario, the results are summarized spatially in
Fig. 1, while in the supplement the same are presented for scenarios SSP1-2.6 and SSP5-8.5 (Supplementary Figs. 2–5). For the year 2000, the long-term health burden of the atmosphere is 5.7
(3.1–9.0) million yr−1, with 28% of it attributable to non-optimal temperature exposure (1.6 (0.6–2.8) million yr−1) and the remaining 72% (i.e., 4.1 (2.5–6.2) million yr−1) to air pollution
exposure. Significant attributable mortality from both the risk factors is estimated in South and East Asia, which represent 44% of the world population, but bearing 59% of the global
health burden with attributable mortality of 1.2 (0.63–1.86) and 2.31 (1.36–3.45) million yr−1, respectively. The high mortality values in these regions are attributable to the large
population as well as to the high pollution levels. In fact, in both regions, the premature mortality attributable to air pollution is roughly a factor of 5 (for South Asia) and 3 (for East
Asia) larger than that attributable to non-optimal temperature. On the other hand, in the GBD defined High-Income region3 (i.e. Australasia, Western Europe, High-Income North America and
High-Income Asia Pacific) the mortality attributable to non-optimal temperature is larger than that attributable to PM2.5, as listed in Table 1, highlighting (i) the success of the air
pollution control policies in the High-Income region and (ii) the importance of non-optimal temperature to the overall health burden in these regions. The estimates for the end of the
century suggest a remarkable increase in global mortality. Figure 2a depicts the mortality attributable to both risk factors for the entire time period (2000-2090). In 2090 (i.e., 2080–2099
mean), the overall attributable mortality increases to 30.3 (13.6-53.1) million yr−1 in the SSP2-4.5 scenario, with 36.9 (15.9–66.1) in a climate mitigation scenario SPP1-2.6, and reaching
up to 44.3 (17.6–79.9) million yr−1 under the more pessimistic SSP5-8.5 scenario. This corresponds to a global population-weighted increase of the attributable mortality (Supplementary Fig.
6) from 96 (52–153) deaths for every 100k individuals for the year 2000 to 337 (151–590), 509 (220–913) and 581 (231–1049) deaths for every 100k individuals for SPP2-4.5, SSP1-2.6 and
SSP5-8.5, respectively. Clearly, the projected changes in attributable mortality due to non-optimal temperature and fine particulate are regionally different, with large differences
especially over North America and Central-East Europe (see Fig. 1). While in these regions the mortality attributable to PM2.5 is predicted to decrease, the one due to non-optimal
temperature increases in all regions and more prominently in the subtropics and the northern extratropics. Globally, over time, we find a larger relative (albeit smaller in absolute values)
increase in attributable deaths from exposure to non-optimal temperature as compared to PM2.5. Under all scenarios, South and East Asia still exhibit the largest total attributable
mortality. Nevertheless, by the end of the century, a larger impact on mortality from non-optimal temperature differences is expected. Specifically, for the South and East Asia, mortality
attributable to fine particulate matter is predicted to be only a factor of 3.4 and 1.5 times larger than that attributable to non-optimal temperature, respectively. In Central and Eastern
Europe, as well as southern Latin America, the mortality linked to non-optimal temperature is anticipated to surpass that attributed to ambient PM2.5 by the end of the century (see Table 1)
in all scenarios. Importantly, in High-Income region, while present-day mortality rates from air pollution and non-optimal temperatures are comparable, future scenarios suggest that
temperature-related mortality will increase to 3 to 7 times that of air pollution, depending on the scenario. These results underscore the importance of climate change for human well-being
and society as a whole. FACTORS IN MORTALITY GROWTH Figure 2a depicts the total global health burden from the two risk factors across the century. The larger projected increase for the
SSP5-8.5 scenario in attributable mortality compared to SSP1-2.6 and SSP2-4.5 is clearly marked, as well as the proportionally larger increase in the mortality attributable to non-optimal
temperature exposure, compared to mortality due to air pollution. The factors influencing the attributable mortality are also presented in Fig. 2b–d. We find a consistent increase in
population-weighted average exposure (Fig. 2b) to temperature globally, across the century, increasing from 19 °C in 2000 to roughly 22.0, 23.4 and 24.3 °C at the end of the century, for
scenario SSP1-2.6, SSP2-4.5 and SSP5-8.5, respectively, in agreement with the climate change projections9. On the other side, global population-weighted exposure to fine particulate matter
is predicted to peak in the decades 2010, 2020 and 2040 (for the SSP1-2.6, SSP2-4.5 and SSP5-8.5 scenarios, respectively). This peak is followed by a steep decrease, bringing the exposure to
PM2.5 at the end of the century to ∼ 31 _μ__g__m_−3 (SSP2-4.5 and SSP5-8.5) and ∼ 25 _μ__g__m_−3 (SSP1-2.6), i.e. lower than that at the beginning of the century ( ∼34 _μ__g__m_−3). The
reason behind the increase in the global mortality attributable to air pollution, in spite of the decreasing pollution exposure across the latter half of the century, is to be identified in
the development of the population itself throughout the century. The population is projected to grow in both scenarios (see Fig. 2c), reaching a maximum of ∼ 9.3 billion in 2070 for SSP2-4.5
and ∼8.4 billion in 2050 for SSP5-8.5 and SSP1-2.6 where it reduces significantly afterwards. Notably, the average age of the population is projected to increase steadily from the year 2010
onward (see Fig. 2d, and also Supplementary Fig. 7), beginning at 32 years old in 2010 and reaching up to 46, 56 and 55 years by the end of the century in the SSP2-4.5, SSP1-2.6 and
SSP5-8.5 scenarios, respectively. The baseline mortality rates (see Section Methods) increases with the increase of age (i.e. larger for older age classes than younger one), representing the
higher mortality risk at older ages. This strong aging of the population is therefore the primary driver of the mortality associated with both non-optimal temperature and pollution
attributable mortality on a global scale. In a few regions where the population age is already higher than the global average at the beginning of the century (such as Central-Eastern Europe
and high-income countries, see Table 1), the population aging is not as pronounced as for the global average. For such regions, the decrease in exposure to air pollution therefore translates
directly to a decrease in the mortality attributable to air pollution, while the changes to the temperature exposure cause a constant increase in mortality. This is particularly important
for the scenario SSP1-2.6 in which, despite the decrease in PM2.5 exposure and the moderate increase in the non-optimal temperature exposure, the mortality attributable to both risk factors
increases drastically through the century. Most importantly, the non-optimal temperature attributable mortality is associated with a large increase in the warm temperature exposure,
consistent with the climate change prediction in the examined models. The mortality due to warm temperature exposure increases by factors of 22, 23, and 52, for SSP2-4.5, SPP1-2.6 and
SSP5-8.5, respectively, across the century. Mortality due to cold temperature, on the other hand, only increases by factors of 5, 7.5 and 6 for SSP2-4.5, SSP1-2.6 and SSP5-8.5, respectively,
for the same time span (Supplementary Fig. 8). While mortality due to cold temperature exposure is reduced by the increasing global temperatures across the century, this reduction is
countered and indeed reversed by population growth and the increase in average age across the century, as described before. It must be stressed that, depending on the location, climate
change could increase the temperature variability16, possibly even enhancing the frequency of cold days. The graphical distribution of non-optimal temperature attributable mortality from
warm and cold temperatures exposure is depicted graphically in the Supplementary Fig. 9. The largest increase in warm temperature attributable mortality is especially pronounced in tropical
regions, such as the Sub-Saharan Africa, South Asia, Indonesia and Central America, although increases are also present in extratopics, such as the Mediterranean area. This increase could
have significant impacts, especially in the vulnerable Middle East and North Africa region, further exacerbating the societal implications of climate change, such as enhanced migration and
deterioration of farmers’ life quality17. DISCUSSION In this work, the approach used follows that of the GBD as closely as possible, and our results are similar3 for the period 2000–2019.
For the temperature-related attributable mortality, the exposure-response functions developed by GBD2 have been implemented. Daily cause-specific mortality data from 9 countries for a total
of 64.9 million deaths, spanning 29% of the global population as well as approximately 95% of the inhabited global temperature range and 79% of sociodemographic conditions, were used to
define the cause-specific attributable burden. Furthermore, only the same-day effect is included (i.e., no lag period is assumed), which could result in an underestimation of the
attributable mortality, especially for the cold temperature2. In another similar study18, a non-optimal temperature attributable burden for all-cause mortality of ∼5.0 (4.0–5.9) million
deaths is estimated in the period 2000–2019, which is a factor of ∼3 higher than the value presented here. The cause-specific association and the lack of lag period could explain the
differences to our results. Furthermore, different exposure-response function is used than here, which is specific to the location and includes socio-economical information19. Finally, we
did not considered that the impact of changes in non-optimal temperature is strongly affected by various modifiers such as income and working status, making population sub-groups
particularly vulnerable20. Different exposure-response functions are also available for pollution-related attributable mortality4, producing different estimates. For example, an all-cause
air pollution-attributable death total of 8.1 (5.9–9.9) million for the year 2019, a factor of 2 higher than the estimate obtained here, has been also calculated21. It must be stressed as
well that we neglect the premature mortality attributable to long-term exposure to ozone, known to be an important risk for pulmonary diseases. To estimate the mortality attributable to
ozone exposure, a specific ozone metric is necessary22. However, this metric can only be derived from hourly ozone values, which were not present in the CMIP6 database for the numerical
simulations of the SSP2-4.5 scenario employed in this study. Nevertheless, ozone-attributable mortality is estimated to be roughly a factor of 10 lower than the one due to fine particulate4.
On one side, based on these considerations and the comparison with other studies for the present day, there are therefore indications that the values estimated in this work are lower-end
estimates. On the other side, we also assume a constant baseline mortality ratio, reflecting an unchanging situation in health care, nutrition, and other living conditions in the future. It
has been shown that the use of projected baseline mortality ratios could decrease the mortality between ∼20 and 50% in developed and developing regions, respectively, with a global average
of ∼40%23. This decrease could potentially offset the attributable mortality increase due to the population aging alone and indicates that our results could overestimate future attributable
mortality. As the projections of baseline mortality rates are also affected by large uncertainties and no official predictions are present which have been produced simultaneously with the
population projections, we decided to keep the present-day values constant also for the future, similarly to other works [e.g., refs. 24,25]. Nevertheless, our results are consistent with a
previous study23, which estimated the attributable mortality to PM2.5 with one model and for the scenario SSP3-7.0 to be 6.83 (5.68–7.92) million yr−1 for the period 2005−2014, with an
increase to 25.7 (21.4–29.8) million yr−1 by the end of the century. The projected scenarios are investigating plausible futures. In this work we use model results from the SSP2-4.5,
considered to be the most probable future, SSP1-2.6, a strong mitigation scenario, and the SSP5-8.5, a highly unlikely pessimistic scenario14. The latter presents stringent air pollution
controls but no climate change policies, and therefore should be considered highly skewed towards non-optimal temperature mortality increase. On the other hand, scenario SSP1-2.6 contains
very strong climate as well as air quality mitigation measures. In this scenario, the climate mitigation measures result also in additional co-benefits in terms of lower pollutant
emissions26, obtaining the lowest values of PM2.5 at the end of the century. Finally, we neglect any synergistic effects on cardiovascular disease due to simultaneous exposure to higher
temperatures and higher concentrations of air pollutants, which can cause even higher health burdens than exposure to high temperature or high pollution alone27. Although a stronger
relationship between PM2.5 and health at higher temperatures is a possibility, there is currently insufficient evidence to include such effects. The projected mortality attributable to
long-term exposure to these atmospheric risk factors is expected to increase significantly in the future. Specifically, it is anticipated to rise from 5.7 (3.1–9.0) million yr−1 in the year
2000 to 30.3 (13.6–53.1) million yr−1 by the year 2090 under a realistic-medium scenario (SSP2-4.5), with non-optimal temperature exposure accounting for 36% of this total. Under a
pessimistic scenario (SSP5-8.5), the predicted mortality attributable to these risk factors increases further to 44.3 (17.6–79.9) million yr−1, with non-optimal temperature exposure
accounting for 39% of this total. Finally, for a strong air pollution and climate mitigation scenario (SSP1-2.6), the total predicted mortality attributable reaches 36.9 (15.9-66.1) million
yr−1, with non-optimal temperature exposure accounting for 40% of this total. Independently on the scenario, the relative growth of non-optimal temperature is remarkable, as for the 2000
decade it accounts only for 28% of the total mortality attributable to these atmospheric risk factors. The analysis of the factors contributing to this increase reveals that population
growth and aging are the primary drivers of this phenomenon. On a global scale, while mortality attributable to fine particulate matter is projected to increase by a factor of 5.5, 4.8 and
6.6 (for scenarios SSP2-4.5, SSP1-2.6 and SSP5-8.5, respectively), the mortality associated with non-optimal temperature exposure is expected to rise by a factor of 6.7, 9.1 and 10.9 (for
scenarios SSP2-4.5, SSP1-2.6 and SSP5-8.5, respectively). Furthermore, it is noteworthy that the death toll from non-optimal temperature exposure already exceeds for present day that from
air pollution in high-income countries. Projections indicate that this trend will extend to large regions such as Central and Eastern Europe, including dozens of populous countries worldwide
(e.g., United States, Canada, Argentina, Chile, Algeria, Somalia, Germany, France, Australia, New Zealand, Ukraine, Russia, Japan, and South Korea). It is anticipated that climate factors,
and specifically non-optimal temperature exposure, will become a more significant contributor to the overall health burden than air quality at the end of the century for roughly 21%
(SSP2-4.5), 30% (SSP1-2.6), 32% (SSP5-8.5) of the world’s population, in contrast to 14% for the year 2000. This underscores that climate change poses a direct threat to human life
expectancy and could emerge as a major determinant of global health burdens, potentially offsetting the mortality reductions achieved through air pollution control policies. METHODS The
attributable mortality to non-optimal temperature and fine particulate is estimated in each location (i.e., in each model grid-box) using the equation (1). $${{{{\rm{Mort}}}}}_{d,X,\Delta
a}={{{{\rm{BMR}}}}}_{d,\Delta a}\cdot {{{{\rm{Pop}}}}}_{\Delta a}\cdot {{{{\rm{AF}}}}}_{d,X,\Delta a}$$ (1) where Δ_a_ represents the age group, _d_ the disease, _X_ the risk factor (i.e.,
temperature or PM2.5), AF the attributable fraction (i.e., the fraction of deaths due to _d_ and attributable to _X_), Pop the population, and BMR the cause-specific baseline mortality rate
(i.e., the fraction of deaths due to _d_). TEMPERATURE AND PM2.5 We employ output data from global numerical simulations conducted within the CMIP69. We select models that provide both daily
near-surface temperature and monthly surface PM2.5 mixing ratio (then converted into annual average mass concentration) for the historical period (1980–2014) and three climate warming
scenarios, SSP1-2.6, SSP2-4.5 and SSP5-8.5 (2015–2099). Moreover, to ensure accuracy and consistency, these models must have a nominal horizontal resolution of 100 km. Our analysis is
therefore limited to three global models: CESM2-WACCM28,29, GFDL-ESM430,31, and MRI-ESM2-032,33, which are the only ones with all the described requirements. We assume that each model
contributes equally to our analysis. Both fields, near-surface temperature and PM2.5 concentration, were downscaled and bias-corrected in this work. To develop the bias-adjusted (daily mean)
field of near-surface temperature, we initially apply the Climate Imprint algorithm. This involves calibrating and downscaling each model over the baseline (historical) period of 1980–2014
against the proxy observational WFDE5 (WATCH Forcing Data ERA5) reanalysis34 data set with a spatial resolution of 0.5 × 0.5 degrees. Next, we implement the climate-signal preserving,
Quantile Delta Mapping algorithm using the calibrated/downscaled data sets (1980–2014) and the SSP-based future projections (2015–2100) to obtain the final bias-adjusted and statistically
disaggregated field for each selected model and climate warming scenario35. Both bias-adjustment algorithms mentioned above are sourced from the Pacific Climate Impacts Consortium’s Climate
Downscaling (ClimDown) package available in the R statistical programming language36,37. For the PM2.5 concentration data, the bilinear interpolation and the delta method are applied for the
downscaling and bias correction, respectively. The reference PM2.5 concentration field is the observational data set of38, which is based on a combination of satellite observations and
model results, calibrated using ground-based observations incorporated with a Geographically Weighted Regression (GWR). In this study, the annual mean global GWR-adjusted PM2.5 estimates at
the resolution of 0.1 × 0.1 degrees are used [v5.GL.02,38]. In order to consider PM2.5 concentration climatologies, the bias correction is applied on temporal means of 20 years39, considered
long enough to show future changes according to the CMIP640. Thus, the following computations are performed as equation (2) and (3).
$${{{{\rm{PM}}}}}_{2.5,m,{t}_{i}}(x,y)={\overline{{{{\rm{PM}}}}}}_{2.5,{{{\rm{obs}}}},1998-2017}(x,y)\cdot {\Delta }_{m,{t}_{i}}(x,y)$$ (2) $${{{\rm{where}}}}\,{\Delta
}_{m,{t}_{i}}(x,y)=\left(\frac{{\overline{{{{\rm{PM}}}}}}_{2.5,m,{t}_{i}}}{{\overline{{{{\rm{PM}}}}}}_{2.5,m,{{{\rm{baseline}}}}}}\right)$$ (3) where the bar denotes a temporal mean, (_x_,
_y_) is the location (longitude, latitude) of the data, _m_ refers to the selected model, baseline indicates the past 20-year period (i.e., 1990–2009), _t__i_ are the time slices of 20 years
with step of 10 years, i.e., 1990–2009 to be representative for the year 2000, 2000–2019 for the year 2010, … 2080–2099 for the year 2090. For consistency, we consider 20 years also for the
observational data set (1998–2017), although the available period is longer (1998–2020). To be noted that \({\Delta }_{m,{t}_{i}}(x,y)\), computed with model data, is downscaled to the
resolution of the observations. Thus, the final bias-corrected PM2.5 concentration has the resolution of 0.1 × 0.1 degrees. In order to perform a consistent comparison between the results
obtained for the two risk factors, daily bias-adjusted temperature estimates are also averaged over 20-year periods, every 10 years. Since mortality attributable to temperature is determined
daily, multi-annual daily means are computed this time for the same time slices. Finally, both temperature and PM2.5 concentration are regridded to the target grid of our analysis: the grid
of the population data set at the resolution of 7.5 arc-min, i.e. 0.125 × 0.125 degrees. POPULATION AND BASE MORTALITY RATE We use gridded population for the base year 2000 and gridded
population projections at ten-year intervals for 2010–2090 at the resolution of one-eighth degree (7.5 arc-minutes) available from SEDAC (Socio-Economic Data and Application Center,
https://sedac.ciesin.columbia.edu/data/collection/ssp). The projections are consistent with the SSPs41. In order to distribute population data by age, we use the information on the number of
individuals per age group provided by IIASA (International Institute for Applied Systems Analysis, https://tntcat.iiasa.ac.at/SspDb/dsd?Action=htmlpage&page=about.). This information is
available from 2010 until 2100 every five years at the country level. We use data every ten years (from 2010 to 2090) and assume that distribution in 2010 is the same as in 2000.
Age-distributed population is obtained by multiplying the ratio of the population belonging to that age group at the country level (derived from IIASA data) by the population data (from
SEDAC). Caused-specific baseline mortality rate (BMR) is downloaded from the Institute for Health Metrics and Evaluation (IHME, https://vizhub.healthdata.org/gbd-results/) for the years
1990–2009, for the diseases and age groups considered in this study. Attributable mortality (equation (1)) is estimated by applying the 20-year mean of BMRs, which is kept constant also in
the future estimation. EXPOSURE-RESPONSE FUNCTIONS AND ATTRIBUTABLE FRACTION Attributable fractions are derived from the so-called exposure-response functions (ERFs), which are based on the
relative risks (RRs) established by different studies. The non-optimal temperature ERF are established on vital registration data (i.e. death certificates) while the fine particulate ERF are
based on individual cohort studies metaregressed. The risk model coefficients defining the ERFs are adjusted and updated as soon as more data are available so that the _R__R__s_ estimated
from the ERFs are close to the _R__R__s_ defined by the cohort epidemiological studies. More precisely, _A__F_ = (_R__R_ − 1)/_R__R_, where RR is estimated from the considered ERFs; there
are in fact several functions for PM2.54 and just a few for temperature3,19. In this study, we use the ERFs from the GBD (GBD2019) both for non-optimal temperature2 and for fine particulate3
exposure. The ERFs for non-optimal temperature are derived with the meta-regression–Bayesian, regularised, trimmed (MR-BRT) tool. They are defined for the entire population, without
distinction by age, for 17 causes of deaths: external causes (i.e. injuries), non-external causes (i.e. diseases), and metabolic diseases (i.e. diabetes and chronic kidney disease). Among
these, we estimate the attributable mortality associated with non-external causes and metabolic diseases: cardiomyopathy and myocarditis (CMP), hypertensive heart disease (HTN), ischemic
heart disease (IHD), stroke, lower respiratory infections (LRI), chronic obstructive pulmonary disease (COPD), chronic kidney disease (CKD) and diabetes. Each cause-specific ERF is
differentiated by climate zone, identified from the temporal mean (between 1980 and 2016) of daily mean temperatures in that location; 23 climate zones are found for populated areas, from 6
°C to 28 °C. Like in ref. 2, we consider here 23 climate zones (6 °C−28 °C) based on the temporal mean of (multi-annual) daily mean temperatures for each 20-year period. We compute daily
_A__F__s_ in each grid-box by using the multi-annual daily mean temperature and the cause-specific ERF of the climate zone to which that grid-box belongs to. The ERFs for PM2.5 are splines
generated with the MR-BRT tool and input data from epidemiologic studies of exposure to ambient air pollution, household air pollution from the use of solid fuels, and secondhand tobacco
smoke from the GBD 20193. These ERFs are cause-specific for IHD, stroke, COPD, lung cancer (LC), and diabetes mellitus type 2 (T2 DM) for people of age 25+ and for LRI for children of 0–5
years; the ERFs for cardiovascular causes (i.e., IHD and stroke) are differentiated into age groups of 5 years. In the case of PM2.5 exposure, the ERFs have a global validity (they do not
depend on climate zones) and are based on annual mean concentrations, therefore, we compute annual AFs in each grid-box using the cause-specific ERFs and the (20-year) mean PM2.5
concentration of that grid-box. Following the GBD2019 approach, the theoretical minimum-risk exposure level is obtained from an uniform distribution between 2.4 and 5.9 _μ_g m−3. MORTALITY
ESTIMATES In order to perform the computation of equation (1) in each model grid-box, the data sets previously described were post processed, so to be on the same grid. The target grid is
the one of the population (7.5 arc-min, i.e., 0.125 × 0.125 degrees). We use the national identifier grid at the resolution of 2.5 arc-min from SEDAC, to convert the data at the country
level (age groups and _B__M__R__s_) to gridded data. While equation (1) can directly be used to compute annual mortality attributable to long-term exposure to PM2.5, annual mortality
attributable to non-optimal temperature is computed with equation (4). $${{{{\rm{Mort}}}}}_{d,X=temp,\Delta a}=\frac{1}{365}\cdot {{{{\rm{BMR}}}}}_{d,\Delta a}\cdot {{{{\rm{Pop}}}}}_{\Delta
a}{\sum}_{day=1}^{365}{{{{\rm{AF}}}}}_{d,X={{{\rm{temp}}}},\Delta a}^{{{{\rm{(day)}}}}}$$ (4) where \({{{{\rm{AF}}}}}_{d,X={{{\rm{temp}}}},\Delta a}^{{{{\rm{(day)}}}}}\) are daily AFs.
Therefore, with equations (1) and (4) we compute mortality estimates for different diseases and age groups. It must be noted that mortality estimate is computed for all _Δ__a_ even when
_A__F_ is not dependent on age (in this case, the same _A__F_ is used for all age groups). The sum of _M__o__r__t__d_,_X_,_Δ__a_ for all considered diseases and age groups gives the total
number of deaths attributable to non-optimal temperature or fine particulate matter. The final results have the resolution of 0.125 × 0.125 degrees and extend between −54.95 S and 67.95 N
(which is the largest latitudinal extension common to all data sets; this corresponds to the observational data set of PM2.5). The confidence level of mortality estimates is computed by
using the confidence level intervals of _R__R__s_ provided by GBD20192,3 in equations (1) and (4). We also compute the relative contributions to mortality attributable to non-optimal
temperature for cold temperature exposure and warm temperature exposure, specifically. This is done by computing the minimum of each ERF, described earlier, for each disease and each climate
zone. The temperature associated with these minima is the so-called theoretical minimum-risk exposure level (TMREL) or minimum-mortality temperature (MMT)2. TMRELs are location and
year-specific, although in this work were kept fixed and based on the climate zone. As we evaluate each ERF during the mortality calculation for a given grid cell of temperature T, we track
whether T≥ MMT or T < MMT, and associate the calculated mortality with warm temperature exposure or cold temperature exposure, respectively. REPORTING SUMMARY Further information on
research design is available in the Nature Portfolio Reporting Summary linked to this article. DATA AVAILABILITY All data used in this work are publicly available. The results are presented
in tabulated format in the supplementary information of this manuscript. The processed data with total mortality, generated in this study and used to produce the figures and the tables, is
available at https://doi.org/10.17617/3.ITPOI5. REFERENCES * Lelieveld, J., Evans, J., Fnais, M., Giannadaki, D. & Pozzer, A. The contribution of outdoor air pollution sources to
premature mortality on a global scale. _Nature_ 525, 367–371 (2015). Article ADS CAS PubMed Google Scholar * Burkart, K. G. et al. Estimating the cause-specific relative risks of
non-optimal temperature on daily mortality: a two-part modelling approach applied to the Global Burden of Disease Study. _Lancet_ 398, 685–697 (2021). Article PubMed PubMed Central Google
Scholar * Murray, C. J. L. et al. Global burden of 87 risk factors in 204 countries and territories, 1990–2019: a systematic analysis for the Global Burden of Disease Study 2019. _Lancet_
396, 1223–1249 (2020). Article Google Scholar * Pozzer, A. et al. Mortality attributable to ambient air pollution: A review of global estimates. _GeoHealth_ 7, e2022GH000711 (2023).
Article CAS PubMed PubMed Central Google Scholar * Fang, Y., Mauzerall, D. L., Liu, J., Fiore, A. M. & Horowitz, L. W. Impacts of 21st century climate change on global air
pollution-related premature mortality. _Climatic Change_ 121, 239–253 (2013). Article ADS CAS Google Scholar * Chen, K., Vicedo-Cabrera, A. M. & Dubrow, R. Projections of ambient
temperature- and air pollution-related mortality burden under combined climate change and population aging scenarios: a review. _Curr. Environ. Health Rep._ 7, 243–255 (2020). Article
PubMed Google Scholar * Singh, N., Singh, S. & Mall, R. in _Chapter 17 - urban ecology and human health: implications of urban heat island, air pollution and climate change nexus_ (eds
Verma, P. et al.) _Urban Ecology_ 317–334 (Elsevier, 2020). * Ayejoto, D. A., Agbasi, J. C., Nwazelibe, V. E., Egbueri, J. C. & Alao, J. O. Understanding the connections between climate
change, air pollution, and human health in africa: Insights from a literature review. _J. Environ. Sci. Health, Part C._ 41, 77–120 (2023). Article CAS Google Scholar * Masson-Delmotte,
V. et al. Climate change 2021: the physical science basis. _Contribution of working group I to the sixth assessment report of the intergovernmental panel on climate change_ 2 (2021). *
Weber, E., Downward, G. S., Ebi, K. L., Lucas, P. L. & van Vuuren, D. The use of environmental scenarios to project future health effects: a scoping review. _Lancet Planet. Health_ 7,
e611–e621 (2023). Article PubMed Google Scholar * Flato, G. M. Earth system models: an overview. _Wiley Interdiscip. Rev.: Clim. Change_ 2, 783–800 (2011). Google Scholar * Collins, W.
J. et al. AerChemMIP: quantifying the effects of chemistry and aerosols in CMIP6. _Geoscientific Model Dev._ 10, 585–607 (2017). Article ADS CAS Google Scholar * Riahi, K. et al. The
shared socioeconomic pathways and their energy, land use, and greenhouse gas emissions implications: An overview. _Glob. Environ. change_ 42, 153–168 (2017). Article Google Scholar *
Hausfather, Z. & Peters, G. Emissions – the ’businessas usual’ story is misleading. _Nature_ 577, 618–620 (2020). Article ADS CAS PubMed Google Scholar * Turnock, S. T. et al.
Historical and future changes in air pollutants from CMIP6 models. _Atmos. Chem. Phys._ 20, 14547–14579 (2020). Article ADS CAS Google Scholar * Rummukainen, M. Changes in climate and
weather extremes in the 21st century. _Wiley Interdiscip. Rev.: Clim. Change_ 3, 115–129 (2012). Google Scholar * Waha, K. et al. Climate change impacts in the middle east and northern
Africa (MENA) region and their implications for vulnerable population groups. _Regional Environ. Change_ 17, 1623–1638 (2017). Article Google Scholar * Zhao, Q. et al. Global, regional,
and national burden of mortality associated with non-optimal ambient temperatures from 2000 to 2019: a three-stage modelling study. _Lancet Planet. Health_ 5, e415–e425 (2021). Article
PubMed Google Scholar * Gasparrini, A. et al. Mortality risk attributable to high and low ambient temperature: a multicountry observational study. _Lancet_ 386, 369–375 (2015). Article
PubMed PubMed Central Google Scholar * Son, J.-Y., Liu, J. C. & Bell, M. L. Temperature-related mortality: a systematic review and investigation of effect modifiers. _Environ. Res.
Lett._ 14, 073004 (2019). Article ADS Google Scholar * Burnett, R. T., Spadaro, J. V., Garcia, G. R. & Pope, C. A. Designing health impact functions to assess marginal changes in
outdoor fine particulate matter. _Environ. Res._ 204, 112245 (2022). Article CAS PubMed Google Scholar * DeLang, M. N. et al. Mapping yearly fine resolution global surface ozone through
the Bayesian maximum entropy data fusion of observations and model output for 1990-2017. _Environ. Sci. Technol._ 55, 4389–4398 (2021). Article ADS CAS PubMed Google Scholar * Turnock,
S. T., Reddington, C. L., West, J. J. & O’Connor, F. M. The air pollution human health burden in different future scenarios that involve the mitigation of near-term climate forcers,
climate and land-use. _Geohealth_ 7, e2023GH000812 (2023). Article PubMed PubMed Central Google Scholar * Chen, H. et al. Projections of heatwave-attributable mortality under climate
change and future population scenarios in China. _The Lancet Reg. Health–Western Pacific_ 28, 100582 (2022). * Akritidis, D. et al. Strong increase in mortality attributable to ozone
pollution under a climate change and demographic scenario. _Environ. Res. Lett._ 19, 024041 (2024). Article ADS CAS Google Scholar * Rao, S. et al. Future air pollution in the shared
socio-economic pathways. _Glob. Environ. Change_ 42, 346–358 (2017). Article Google Scholar * Silva, R. A. et al. Future global mortality from changes in air pollution attributable to
climate change. nature climate change. _Nat. Clim. Change_ 7, 647–651 (2017). Article ADS Google Scholar * Danabasoglu, G. et al. The community earth system model version 2 (CESM2). _J.
Adv. Modeling Earth Syst._ 12, e2019MS001916 (2020). Article ADS Google Scholar * Gettelman, A. et al. The whole atmosphere community climate model version 6 (WACCM6). _J. Geophys. Res.:
Atmospheres_ 124, 12380–12403 (2019). Article ADS Google Scholar * Dunne, J. P. et al. The GFDL earth system model version 4.1 (GFDL-ESM 4.1): Overall coupled model description and
simulation characteristics. _J. Adv. Modeling Earth Syst._ 12, e2019MS002015 (2020). Article ADS Google Scholar * Horowitz, L. W. et al. The GFDL global atmospheric chemistry-climate
model AM4.1: Model description and simulation characteristics. _J. Adv. Modeling Earth Syst._ 12, e2019MS002032 (2020). Article ADS Google Scholar * Yukimoto, S. et al. The Meteorological
Research Institute earth system model version 2.0, MRI-ESM2. 0: Description and basic evaluation of the physical component. _J. Meteorological Soc. Jpn. Ser. II_ 97, 931–965 (2019). Article
ADS Google Scholar * Oshima, N. et al. Global and arctic effective radiative forcing of anthropogenic gases and aerosols in mri-esm2. 0. _Prog. Earth Planet. Sci._ 7, 1–21 (2020).
Article Google Scholar * Cucchi, M. et al. WFDE5: bias-adjusted ERA5 reanalysis data for impact studies. _Earth Syst. Sci. Data_ 12, 2097–2120 (2020). Article ADS Google Scholar *
Hajat, S., Proestos, Y., Araya-Lopez, J.-L., Economou, T. & Lelieveld, J. Current and future trends in heat-related mortality in the MENA region: a health impact assessment with
bias-adjusted statistically downscaled CMIP6 (SSP-based) data and Bayesian inference. _Lancet Planet. Health_ 7, e282–e290 (2023). Article PubMed Google Scholar * Cannon, A. J. Selecting
GCM scenarios that span the range of changes in a multimodel ensemble: Application to CMIP5 climate extremes indices. _J. Clim._ 28, 1260–1267 (2015). Article ADS Google Scholar *
Hiebert, J., Cannon, A. J., Murdock, T., Sobie, S. & Werner, A. Climdown: Climate downscaling in r. _J. Open Source Softw._ 3, 360 (2018). Article ADS Google Scholar * van Donkelaar,
A. et al. Monthly global estimates of fine particulate matter and their uncertainty. _Environ. Sci. Technol._ 55, 15287–15300 (2021). Article ADS PubMed Google Scholar * Tarín-Carrasco,
P., Im, U., Geels, C., Palacios-Peña, L. & Jiménez-Guerrero, P. Reducing future air-pollution-related premature mortality over Europe by mitigating emissions from the energy sector:
assessing an 80 % renewable energies scenario. _Atmos. Chem. Phys._ 22, 3945–3965 (2022). Article ADS Google Scholar * Chen, D. et al. _Framing, Context, and Methods_, 147-286 (Cambridge
University Press, Cambridge, United Kingdom and New York, NY, USA, 2021). * Jones, B. & O’Neill, B. C. Spatially explicit global population scenarios consistent with the shared
socioeconomic pathways. _Environ. Res. Lett._ 11, 084003 (2016). Article ADS Google Scholar Download references ACKNOWLEDGEMENTS We acknowledge the contribution of Jeffrey Stanaway and
Michael Brauer to the Global Burden of Disease Study (GBD), whose data and exposure-response functions have been extensively used in this work. B.S. was supported by the European Union’s
Horizon Europe research and innovation program under Grant Agreement No 101057131, Climate Action To Advance HeaLthY Societies in Europe (CATALYSE). S.B. was supported by the postdoctoral
fellowship of the Alexander von Humboldt Foundation. FUNDING Open Access funding enabled and organized by Projekt DEAL. AUTHOR INFORMATION AUTHORS AND AFFILIATIONS * Atmospheric Chemistry
Department, Max Planck Institute for Chemistry, Hahn-Meitner weg, Mainz, 55128, Germany Andrea Pozzer, Brendan Steffens, Dimitris Akritidis & Sara Bacer * Climate and Atmosphere Research
Center, The Cyprus Institute, 20 Konstantinou Kavafi Street, Nicosia, 2121, Cyprus Andrea Pozzer, Yiannis Proestos & Jean Sciare * Department of Meteorology and Climatology, School of
Geology, Aristotle University of Thessaloniki, Thessaloniki, 54124, Greece Dimitris Akritidis * CICERO Center for International Climate Research, Oslo, 0349, Norway Sourangsu Chowdhury *
Department of Health Metrics Sciences, University of Washington, 15th Ave NE, 3980, Seattle, 98195, WA, USA Katrin Burkart Authors * Andrea Pozzer View author publications You can also
search for this author inPubMed Google Scholar * Brendan Steffens View author publications You can also search for this author inPubMed Google Scholar * Yiannis Proestos View author
publications You can also search for this author inPubMed Google Scholar * Jean Sciare View author publications You can also search for this author inPubMed Google Scholar * Dimitris
Akritidis View author publications You can also search for this author inPubMed Google Scholar * Sourangsu Chowdhury View author publications You can also search for this author inPubMed
Google Scholar * Katrin Burkart View author publications You can also search for this author inPubMed Google Scholar * Sara Bacer View author publications You can also search for this author
inPubMed Google Scholar CONTRIBUTIONS A.P. and S.B. designed the study. S.B. and A.P. and B.S. performed the calculations with the help of D.A. B.S. prepared the tables and the figures.
A.P. wrote the manuscript with the help of S.B., S.C., and B.S. Data was provided by Y.P., J.S., and K.B. CORRESPONDING AUTHOR Correspondence to Andrea Pozzer. ETHICS DECLARATIONS COMPETING
INTERESTS The authors declare no competing interests. PEER REVIEW PEER REVIEW INFORMATION _Nature Communications_ thanks Daniel Ayejoto, and the other, anonymous, reviewer for their
contribution to the peer review of this work. A peer review file is available. ADDITIONAL INFORMATION PUBLISHER’S NOTE Springer Nature remains neutral with regard to jurisdictional claims in
published maps and institutional affiliations. SUPPLEMENTARY INFORMATION SUPPLEMENTARY INFORMATION PEER REVIEW FILE REPORTING SUMMARY RIGHTS AND PERMISSIONS OPEN ACCESS This article is
licensed under a Creative Commons Attribution 4.0 International License, which permits use, sharing, adaptation, distribution and reproduction in any medium or format, as long as you give
appropriate credit to the original author(s) and the source, provide a link to the Creative Commons licence, and indicate if changes were made. The images or other third party material in
this article are included in the article’s Creative Commons licence, unless indicated otherwise in a credit line to the material. If material is not included in the article’s Creative
Commons licence and your intended use is not permitted by statutory regulation or exceeds the permitted use, you will need to obtain permission directly from the copyright holder. To view a
copy of this licence, visit http://creativecommons.org/licenses/by/4.0/. Reprints and permissions ABOUT THIS ARTICLE CITE THIS ARTICLE Pozzer, A., Steffens, B., Proestos, Y. _et al._
Atmospheric health burden across the century and the accelerating impact of temperature compared to pollution. _Nat Commun_ 15, 9379 (2024). https://doi.org/10.1038/s41467-024-53649-9
Download citation * Received: 30 January 2024 * Accepted: 16 October 2024 * Published: 30 October 2024 * DOI: https://doi.org/10.1038/s41467-024-53649-9 SHARE THIS ARTICLE Anyone you share
the following link with will be able to read this content: Get shareable link Sorry, a shareable link is not currently available for this article. Copy to clipboard Provided by the Springer
Nature SharedIt content-sharing initiative