Play all audios:
ABSTRACT Although metastasis remains the cause of most cancer-related mortality, mechanisms governing seeding in distal tissues are poorly understood. Here, we establish a robust method for
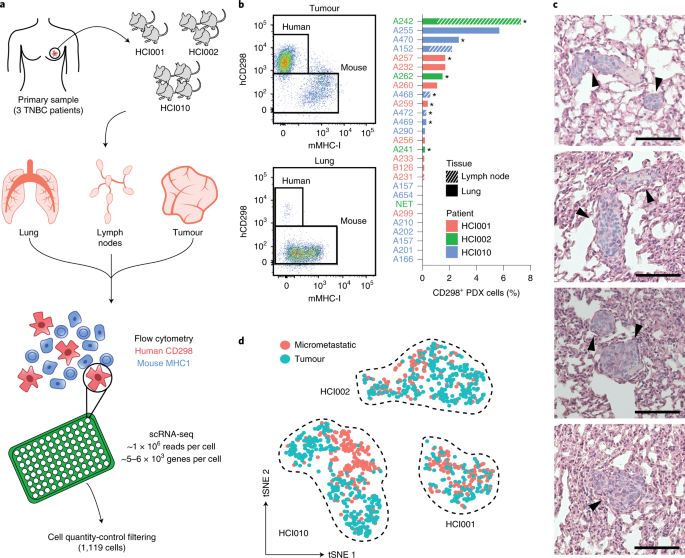
the identification of global transcriptomic changes in rare metastatic cells during seeding using single-cell RNA sequencing and patient-derived-xenograft models of breast cancer. We find
that both primary tumours and micrometastases display transcriptional heterogeneity but micrometastases harbour a distinct transcriptome program conserved across patient-derived-xenograft
models that is highly predictive of poor survival of patients. Pathway analysis revealed mitochondrial oxidative phosphorylation as the top pathway upregulated in micrometastases, in
contrast to higher levels of glycolytic enzymes in primary tumour cells, which we corroborated by flow cytometric and metabolomic analyses. Pharmacological inhibition of oxidative
phosphorylation dramatically attenuated metastatic seeding in the lungs, which demonstrates the functional importance of oxidative phosphorylation in metastasis and highlights its potential
as a therapeutic target to prevent metastatic spread in patients with breast cancer. Access through your institution Buy or subscribe This is a preview of subscription content, access via
your institution ACCESS OPTIONS Access through your institution Access Nature and 54 other Nature Portfolio journals Get Nature+, our best-value online-access subscription $29.99 / 30 days
cancel any time Learn more Subscribe to this journal Receive 12 print issues and online access $209.00 per year only $17.42 per issue Learn more Buy this article * Purchase on SpringerLink *
Instant access to full article PDF Buy now Prices may be subject to local taxes which are calculated during checkout ADDITIONAL ACCESS OPTIONS: * Log in * Learn about institutional
subscriptions * Read our FAQs * Contact customer support SIMILAR CONTENT BEING VIEWED BY OTHERS SINGLE-CELL RNA TRANSCRIPTOME REVEALS THE INTRA-TUMORAL HETEROGENEITY AND REGULATORS
UNDERLYING TUMOR PROGRESSION IN METASTATIC PANCREATIC DUCTAL ADENOCARCINOMA Article Open access 03 November 2021 SINGLE-CELL RNA SEQUENCING REVEALS CELL HETEROGENEITY AND TRANSCRIPTOME
PROFILE OF BREAST CANCER LYMPH NODE METASTASIS Article Open access 05 October 2021 INTEGRATED SINGLE-CELL RNA SEQUENCING ANALYSIS REVEALS DISTINCT CELLULAR AND TRANSCRIPTIONAL MODULES
ASSOCIATED WITH SURVIVAL IN LUNG CANCER Article Open access 14 January 2022 DATA AVAILABILITY The authors declare that all data supporting the findings of this study are available within the
article and its supplementary information files or from the corresponding author on reasonable request. All RNA-seq data files along with their associated metadata have been deposited in
the GEO database under the accession code GSE123837. Previously published microarray data that were reanalysed here with KM Plotter26,67 are available under the following accession codes:
E-MTAB-365, E-TABM-43, GSE11121, GSE12093, GSE12276, GSE1456, GSE16391, GSE16446, GSE16716, GSE17705, GSE17907, GSE18728, GSE19615, GSE20194, GSE20271, GSE2034, GSE20685, GSE20711, GSE21653,
GSE2603, GSE26971, GSE2990, GSE31448, GSE31519, GSE32646, GSE3494, GSE37946, GSE41998, GSE42568, GSE45255, GSE4611, GSE5327, GSE6532, GSE7390 and GSE9195. CODE AVAILABILITY Custom scripts
are available at https://github.com/lawsonlab/Single_Cell_Metastasis. REFERENCES * Bianchini, G., Balko, J. M., Mayer, I. A., Sanders, M. E. & Gianni, L. Triple-negative breast cancer:
challenges and opportunities of a heterogeneous disease. _Nat. Rev. Clin. Oncol._ 13, 674–690 (2016). CAS PubMed PubMed Central Google Scholar * Weigelt, B., Peterse, J. L. & van’t
Veer, L. J. Breast cancer metastasis: markers and models. _Nat. Rev. Cancer_ 5, 591–602 (2005). CAS PubMed Google Scholar * Oskarsson, T., Batlle, E. & Massagué, J. Metastatic stem
cells: sources, niches, and vital pathways. _Cell Stem Cell_ 14, 306–321 (2014). CAS PubMed PubMed Central Google Scholar * Lawson, D. A., Kessenbrock, K., Davis, R. T., Pervolarakis, N.
& Werb, Z. Tumour heterogeneity and metastasis at single-cell resolution. _Nat. Cell Biol._ 20, 1349–1360 (2018). CAS PubMed PubMed Central Google Scholar * Hermann, P. C. et al.
Distinct populations of cancer stem cells determine tumor growth and metastatic activity in human pancreatic cancer. _Cell Stem Cell_ 1, 313–323 (2007). CAS PubMed Google Scholar *
Lodhia, K. A., Hadley, A. M., Haluska, P. & Scott, C. L. Prioritizing therapeutic targets using patient-derived xenograft models. _Biochim. Biophys. Acta_ 1855, 223–234 (2015). CAS
PubMed PubMed Central Google Scholar * Hochhauser, D. & Caldas, C. Of mice and men: patient-derived xenografts in cancer medicine. _Ann. Oncol._ 28, 2330–2331 (2017). CAS PubMed
Google Scholar * Izumchenko, E. et al. Patient-derived xenografts effectively capture responses to oncology therapy in a heterogeneous cohort of patients with solid tumors. _Ann. Oncol._
28, 2595–2605 (2017). CAS PubMed PubMed Central Google Scholar * DeRose, Y. S. et al. Tumor grafts derived from women with breast cancer authentically reflect tumor pathology, growth,
metastasis and disease outcomes. _Nat. Med._ 17, 1514–1520 (2011). CAS PubMed PubMed Central Google Scholar * Lawson, D. A. et al. Single-cell analysis reveals a stem-cell program in
human metastatic breast cancer cells. _Nature_ 526, 131–135 (2015). CAS PubMed PubMed Central Google Scholar * Picelli, S. et al. Full-length RNA-seq from single cells using Smart-seq2.
_Nat. Protoc._ 9, 171–181 (2014). CAS PubMed Google Scholar * Ziegenhain, C. et al. Comparative analysis of single-cell RNA sequencing methods. _Mol. Cell_ 65, 631–643.e4 (2017). CAS
PubMed Google Scholar * Satija, R., Farrell, J. A., Gennert, D., Schier, A. F. & Regev, A. Spatial reconstruction of single-cell gene expression data. _Nat. Biotechnol._ 33, 495–502
(2015). CAS PubMed PubMed Central Google Scholar * Butler, A., Hoffman, P., Smibert, P., Papalexi, E. & Satija, R. Integrating single-cell transcriptomic data across different
conditions, technologies, and species. _Nat. Biotechnol._ 36, 411–420 (2018). CAS PubMed PubMed Central Google Scholar * Patel, A. P. et al. Single-cell RNA-seq highlights intratumoral
heterogeneity in primary glioblastoma. _Science_ 344, 1396–1401 (2014). CAS PubMed PubMed Central Google Scholar * Tirosh, I. et al. Dissecting the multicellular ecosystem of metastatic
melanoma by single-cell RNA-seq. _Science_ 352, 189–196 (2016). CAS PubMed PubMed Central Google Scholar * Puram, S. V. et al. Single-cell transcriptomic analysis of primary and
metastatic tumor ecosystems in head and neck cancer. _Cell_ 171, 1611–1624 (2017). CAS PubMed PubMed Central Google Scholar * Venteicher, A. S. et al. Decoupling genetics, lineages, and
microenvironment in IDH-mutant gliomas by single-cell RNA-seq. _Science_ 355, eaai8478 (2017). PubMed PubMed Central Google Scholar * Bruna, A. et al. A biobank of breast cancer explants
with preserved intra-tumor heterogeneity to screen anticancer compounds. _Cell_ 167, 260–274 (2016). CAS PubMed PubMed Central Google Scholar * Ashburner, M. et al. Gene Ontology: tool
for the unification of biology. _Nat. Genet._ 25, 25–29 (2000). CAS PubMed PubMed Central Google Scholar * The Gene Ontology Consortium. Expansion of the Gene Ontology knowledgebase and
resources. _Nucleic Acids Res_. 45, D331–D338 (2017). * Kuleshov, M. V. et al. Enrichr: a comprehensive gene set enrichment analysis web server 2016 update. _Nucleic Acids Res._ 44, W90–W97
(2016). CAS PubMed PubMed Central Google Scholar * Trapnell, C. et al. The dynamics and regulators of cell fate decisions are revealed by pseudotemporal ordering of single cells. _Nat.
Biotechnol._ 32, 381–386 (2014). CAS PubMed PubMed Central Google Scholar * Ikwegbue, P. C., Masamba, P., Oyinloye, B. E. & Kappo, A. P. Roles of heat shock proteins in apoptosis,
oxidative stress, human inflammatory diseases, and cancer. _Pharmaceuticals_ 11, 1–18 (2018). Google Scholar * Creagh, E. M., Sheehan, D. & Cotter, T. G. Heat shock proteins-modulators
of apoptosis in tumour cells. _Leukemia_ 14, 1161–1173 (2000). CAS PubMed Google Scholar * Györffy, B. et al. An online survival analysis tool to rapidly assess the effect of 22,277 genes
on breast cancer prognosis using microarray data of 1,809 patients. _Breast Cancer Res. Treat._ 123, 725–731 (2010). PubMed Google Scholar * Tunster, S. J., Creeth, H. D. J. & John,
R. M. The imprinted _Phlda2_ gene modulates a major endocrine compartment of the placenta to regulate placental demands for maternal resources. _Dev. Biol._ 409, 251–260 (2016). CAS PubMed
PubMed Central Google Scholar * Moon, H.-G. et al. Prognostic and functional importance of the engraftment-associated genes in the patient-derived xenograft models of triple-negative
breast cancers. _Breast Cancer Res. Treat._ 154, 13–22 (2015). PubMed Google Scholar * Scaduto, R. C. & Grotyohann, L. W. Measurement of mitochondrial membrane potential using
fluorescent rhodamine derivatives. _Biophys. J._ 76, 469–477 (1999). CAS PubMed PubMed Central Google Scholar * Liu, X. et al. High-resolution metabolomics with Acyl-CoA profiling
reveals widespread remodeling in response to diet. _Mol. Cell. Proteomics_ 14, 1489–1500 (2015). CAS PubMed PubMed Central Google Scholar * Mayers, J. R. et al. Elevation of circulating
branched-chain amino acids is an early event in human pancreatic adenocarcinoma development. _Nat. Med._ 20, 1193–1198 (2014). CAS PubMed PubMed Central Google Scholar * Fernyhough, P.
& McGavock, J. in _Handbook of Clinical Neurology_ Vol. 126 (eds Zochodne, D.W. and Malik, R.A.) 353–377 (Elsevier, 2014). * Hao, W., Chang, C. P., Tsao, C. C. & Xu, J.
Oligomycin-induced bioenergetic adaptation in cancer cells with heterogeneous bioenergetic organization. _J. Biol. Chem._ 285, 12647–12654 (2010). CAS PubMed PubMed Central Google Scholar
* Choi, S. W., Gerencser, A. A. & Nicholls, D. G. Bioenergetic analysis of isolated cerebrocortical nerve terminals on a microgram scale: spare respiratory capacity and stochastic
mitochondrial failure. _J. Neurochem._ 109, 1179–1191 (2009). CAS PubMed PubMed Central Google Scholar * Dayan, F. et al. Activation of HIF-1α in exponentially growing cells via hypoxic
stimulation is independent of the Akt/mTOR pathway. _J. Cell. Physiol._ 218, 167–174 (2009). CAS PubMed Google Scholar * Ward, M. W., Rego, A. C., Frenguelli, B. G. & Nicholls, D. G.
Mitochondrial membrane potential and glutamate excitotoxicity in cultured cerebellar granule cells. _J. Neurosci._ 20, 7208–7219 (2000). CAS PubMed PubMed Central Google Scholar *
Digman, M. A., Caiolfa, V. R., Zamai, M. & Gratton, E. The phasor approach to fluorescence lifetime imaging analysis. _Biophys. J_. 94, L14–L16 (2008). * Sameni, S., Syed, A., Marsh, J.
L. & Digman, M. A. The phasor-FLIM fingerprints reveal shifts from OXPHOS to enhanced glycolysis in Huntington Disease. _Sci. Rep._ 6, 34755 (2016). CAS PubMed PubMed Central Google
Scholar * Warburg, O. Origin of cancer cells. _Oncol._ 9, 75–83 (1956). CAS Google Scholar * Koppenol, W. H., Bounds, P. L. & Dang, C. V. Otto Warburg’s contributions to current
concepts of cancer metabolism. _Nat. Rev. Cancer_ 11, 325–337 (2011). CAS PubMed Google Scholar * Yang, L. et al. Metabolic shifts toward glutamine regulate tumor growth, invasion and
bioenergetics in ovarian cancer. _Mol. Syst. Biol._ 10, 728 (2014). PubMed PubMed Central Google Scholar * Dornier, E. et al. Glutaminolysis drives membrane trafficking to promote
invasiveness of breast cancer cells. _Nat. Commun._ 8, 2255 (2017). PubMed PubMed Central Google Scholar * Rodrigues, M. F. et al. Enhanced OXPHOS, glutaminolysis and β-oxidation
constitute the metastatic phenotype of melanoma cells. _Biochem. J._ 473, 703–715 (2016). CAS PubMed Google Scholar * Camarda, R. et al. Inhibition of fatty acid oxidation as a therapy
for MYC-overexpressing triple-negative breast cancer. _Nat. Med._ 22, 427–432 (2016). CAS PubMed PubMed Central Google Scholar * Antalis, C. J., Uchida, A., Buhman, K. K. & Siddiqui,
R. A. Migration of MDA-MB-231 breast cancer cells depends on the availability of exogenous lipids and cholesterol esterification. _Clin. Exp. Metastasis_ 28, 733–741 (2011). CAS PubMed
Google Scholar * Elia, I. et al. Proline metabolism supports metastasis formation and could be inhibited to selectively target metastasizing cancer cells. _Nat. Commun._ 8, 15267 (2017).
PubMed PubMed Central Google Scholar * Christen, S. et al. Breast cancer-derived lung metastases show increased pyruvate carboxylase-dependent anaplerosis. _Cell Rep._ 17, 837–848 (2016).
CAS PubMed Google Scholar * Elia, I., Doglioni, G. & Fendt, S. M. Metabolic hallmarks of metastasis formation. _Trends Cell Biol._ 28, 673–684 (2018). CAS PubMed Google Scholar *
Teoh, S. T. & Lunt, S. Y. Metabolism in cancer metastasis: bioenergetics, biosynthesis, and beyond. _Wiley Interdiscip. Rev. Syst. Biol. Med._ 10, e1406 (2018). Google Scholar * LeBleu,
V. S. et al. PGC-1α mediates mitochondrial biogenesis and oxidative phosphorylation in cancer cells to promote metastasis. _Nat. Cell Biol._ 16, 992–1003 (2014). CAS PubMed PubMed Central
Google Scholar * Basnet, H. et al. Flura-seq identifies organ-specific metabolic adaptations during early metastatic colonization. _eLife_ 8, e43627 (2019). PubMed PubMed Central Google
Scholar * Schafer, Z. T. et al. Antioxidant and oncogene rescue of metabolic defects caused by loss of matrix attachment. _Nature_ 461, 109–113 (2009). CAS PubMed PubMed Central Google
Scholar * Porporato, P. E. et al. A mitochondrial switch promotes tumor metastasis. _Cell Rep._ 8, 754–766 (2014). CAS PubMed Google Scholar * Ogura, M., Yamaki, J., Homma, M. K. &
Homma, Y. Mitochondrial c-Src regulates cell survival through phosphorylation of respiratory chain components. _Biochem. J._ 447, 281–289 (2012). CAS PubMed Google Scholar * Zielonka, J.
& Kalyanaraman, B. ‘ROS-generating mitochondrial DNA mutations can regulate tumor cell metastasis’-a critical commentary. _Free Radic. Biol. Med._ 45, 1217–1219 (2008). CAS PubMed
PubMed Central Google Scholar * Dai, X. et al. Breast cancer intrinsic subtype classification, clinical use and future trends. _Am. J. Cancer Res._ 5, 2929–2943 (2015). CAS PubMed PubMed
Central Google Scholar * Giannoni, E. et al. Redox regulation of anoikis: reactive oxygen species as essential mediators of cell survival. _Cell Death Differ._ 15, 867–878 (2008). CAS
PubMed Google Scholar * Kumar, S. et al. Metformin intake is associated with better survival in ovarian cancer: a case-control study. _Cancer_ 119, 555–562 (2013). CAS PubMed Google
Scholar * Bodmer, M., Becker, C., Meier, C., Jick, S. S. & Meier, C. R. Use of metformin and the risk of ovarian cancer: a case-control analysis. _Gynecol. Oncol._ 123, 200–204 (2011).
CAS PubMed Google Scholar * Romero, I. L. et al. Relationship of type II diabetes and metformin use to ovarian cancer progression, survival, and chemosensitivity. _Obstet. Gynecol._ 119,
61–67 (2012). PubMed PubMed Central Google Scholar * Col, N. F., Ochs, L., Springmann, V., Aragaki, A. K. & Chlebowski, R. T. Metformin and breast cancer risk: a meta-analysis and
critical literature review. _Breast Cancer Res. Treat._ 135, 639–646 (2012). CAS PubMed Google Scholar * Yap, T. A. et al. Phase I trial of IACS-010759 (IACS), a potent, selective
inhibitor of complex I of the mitochondrial electron transport chain, in patients (pts) with advanced solid tumors. _J. Clin. Oncol._ 37, 3014–3014 (2019). Google Scholar * Hafeez, B. Bin
et al. Plumbagin inhibits prostate cancer development in TRAMP mice via targeting PKCε, Stat3 and neuroendocrine markers. _Carcinogenesis_ 33, 2586–2592 (2012). PubMed PubMed Central
Google Scholar * Hafeez, B. Bin et al. Plumbagin inhibits prostate carcinogenesis in intact and castrated PTEN knockout mice via targeting PKCε, Stat3, and epithelial-to-mesenchymal
transition markers. _Cancer Prev. Res._ 8, 375–386 (2015). Google Scholar * Fiorillo, M. et al. Repurposing atovaquone: targeting mitochondrial complex III and OXPHOS to eradicate cancer
stem cells. _Oncotarget_ 7, 34084–34099 (2016). PubMed PubMed Central Google Scholar * Lv, Z., Yan, X., Lu, L., Su, C. & He, Y. Atovaquone enhances doxorubicin’s efficacy via
inhibiting mitochondrial respiration and STAT3 in aggressive thyroid cancer. _J. Bioenerg. Biomembr._ 50, 263–270 (2018). CAS PubMed Google Scholar * Nagy, Á., Lánczky, A., Menyhárt, O.
& Győrffy, B. Validation of miRNA prognostic power in hepatocellular carcinoma using expression data of independent datasets. _Sci. Rep._ 8, 9227 (2018). PubMed PubMed Central Google
Scholar * Mah, E. J., Lefebvre, A. E. Y. T., McGahey, G. E., Yee, A. F. & Digman, M. A. Collagen density modulates triple-negative breast cancer cell metabolism through
adhesion-mediated contractility. _Sci. Rep._ 8, 17094 (2018). PubMed PubMed Central Google Scholar * Rohart, F., Gautier, B., Singh, A. & Lê Cao, K. A. mixOmics: an R package for
‘omics feature selection and multiple data integration. _PLoS Comput. Biol._ 13, e1005752 (2017). PubMed PubMed Central Google Scholar Download references ACKNOWLEDGEMENTS We thank G.
Gutierrez and M. Masoud for technical assistance and animal handling. We thank N. Pervolarakis for helpful advice on data analysis. We thank K. Kessenbrock for thoughtful feedback on
experimental design and careful review of the manuscript. We thank A. L. Welm for providing the PDX samples. Image acquisition was made possible in part through access to the Optical Biology
Core Facility of the Developmental Biology Center, a shared resource supported by the Cancer Center Support Grant (grant no. CA-62203), with assistance from A. Syed and a Center for Complex
Biological Systems Support Grant (grant no. GM-076516) at the University of California, Irvine. This study was supported by funds from the National Cancer Institute (grant nos R01 CA057621
and U01 CA199315 to Z.W., and grant no. K22 CA190511 to D.A.L.), National Institutes of Health (grant no. R01HD073179 to E.M., P41-GM103540 to M.A.D. and A.E.Y.T.L,, and T32CA009054 to
M.B.G. and R.T.D., through matched university funds through matched university funds), National Science Foundation (grant no. 1847005 to M.A.D. and NSF GRFP DGE-1839285 to A.E.Y.T.L.), Team
Michelle and Friends non-profit organization, Suzette Kirby Breast Cancer Research Fund, V Foundation (grant no. V2019-019) as well as an Opportunity Award funded by the UCI Center for
Complex Biological Systems (CCBS; NIGMS, grant no. P50-GM076516 to R.T.D., K.B., D.Maurer, E.M. and D.A.L.). H.A. was supported by the University of Hail, Hail, Saudi Arabia for the PhD
Fellowship. D.Ma was supported by a Canadian Institutes of Health Research Postdoctoral Fellowship. AUTHOR INFORMATION AUTHORS AND AFFILIATIONS * Department of Physiology and Biophysics,
University of California, Irvine, Irvine, CA, USA Ryan T. Davis, Grace A. Hernandez, Anh T. Phung & Devon A. Lawson * Center for Complex Biological Systems, University of California,
Irvine, Irvine, CA, USA Kerrigan Blake, Dustin Maurer & Michelle A. Digman * Department of Biological Chemistry, University of California, Irvine, Irvine, CA, USA Dennis Ma & Hamad
Alshetaiwi * Department of Molecular Biology and Biochemistry, University of California, Irvine, Irvine, CA, USA Mari B. Ishak Gabra, Ying Yang & Mei Kong * Biomedical Engineering
Department, University of California, Irvine, Irvine, CA, USA Austin E. Y. T. Lefebvre & Michelle A. Digman * Laboratory for Fluorescence Dynamics, University of California, Irvine,
Irvine, CA, USA Austin E. Y. T. Lefebvre & Michelle A. Digman * Department of Pathology, University of Hail, Hail, Saudi Arabia Hamad Alshetaiwi * Department of Pharmacology and Cancer
Biology, Duke University, Durham, NC, USA Zhengtao Xiao, Juan Liu & Jason W. Locasale * Department of Computer Science, University of California, Irvine, Irvine, CA, USA Eric Mjolsness *
Department of Anatomy, University of California, San Francisco, CA, USA Zena Werb Authors * Ryan T. Davis View author publications You can also search for this author inPubMed Google
Scholar * Kerrigan Blake View author publications You can also search for this author inPubMed Google Scholar * Dennis Ma View author publications You can also search for this author
inPubMed Google Scholar * Mari B. Ishak Gabra View author publications You can also search for this author inPubMed Google Scholar * Grace A. Hernandez View author publications You can also
search for this author inPubMed Google Scholar * Anh T. Phung View author publications You can also search for this author inPubMed Google Scholar * Ying Yang View author publications You
can also search for this author inPubMed Google Scholar * Dustin Maurer View author publications You can also search for this author inPubMed Google Scholar * Austin E. Y. T. Lefebvre View
author publications You can also search for this author inPubMed Google Scholar * Hamad Alshetaiwi View author publications You can also search for this author inPubMed Google Scholar *
Zhengtao Xiao View author publications You can also search for this author inPubMed Google Scholar * Juan Liu View author publications You can also search for this author inPubMed Google
Scholar * Jason W. Locasale View author publications You can also search for this author inPubMed Google Scholar * Michelle A. Digman View author publications You can also search for this
author inPubMed Google Scholar * Eric Mjolsness View author publications You can also search for this author inPubMed Google Scholar * Mei Kong View author publications You can also search
for this author inPubMed Google Scholar * Zena Werb View author publications You can also search for this author inPubMed Google Scholar * Devon A. Lawson View author publications You can
also search for this author inPubMed Google Scholar CONTRIBUTIONS D.A.L., E.M., M.K., M.A.D., J.W.L. and Z.W. designed and supervised the research. R.T.D., Y.Y., K.B., M.B.G., D.Ma,
A.E.Y.T.L., A.T.P., H.A., G.A.H., J.L. and D.A.L. performed the research. R.T.D., K.B., Z.X. and D.Maurer performed the bioinformatic analyses. R.T.D. and D.A.L. wrote the manuscript, and
all authors discussed the results and provided comments and feedback. CORRESPONDING AUTHOR Correspondence to Devon A. Lawson. ETHICS DECLARATIONS COMPETING INTERESTS The authors declare no
competing interests. ADDITIONAL INFORMATION PUBLISHER’S NOTE Springer Nature remains neutral with regard to jurisdictional claims in published maps and institutional affiliations. EXTENDED
DATA EXTENDED DATA FIG. 1 QUALITY CONTROL AND EXCLUSION CRITERIA FOR SINGLE-CELL RNA SEQUENCING. A, Identification and removal of poor-quality cell libraries. Plots show the number of genes
detected in each cell from each PDX model. Cells (x axis) are ordered from fewest to most genes detected. Cells with fewer than 2500 genes detected (horizontal line) were excluded. B,
Identification and removal of noisy/background genes. Plots show the distribution of genes detected per cell. Vertical line indicates that genes detected in fewer than 8 cells were excluded.
C, Violin plots indicate the expression of mitochondrial genes as a percentage of total gene expression in each cell separated by HCI001 (_n_ = 375 cells), HCI002 (_n_ = 576 cells), and
HCI010 (_n_ = 756 cells). Cells were excluded if > 50% of genes detected were mitochondrial (horizontal line). Black line with dot indicates median. (D, E) Cells from HCI001 (D) and
HCI010 (E) are plotted based on the relative expression of gene sets associated with G1/S (x-axis) and G2/M (y- axis) stages of the cell cycle. Left plots: Relative expression of the
proliferation-associated gene _MKI67_ is shown in HCI001 and HCI010. Middle plots: Cell clustering before cell cycle regression. Cluster identities are shown in grey. Right plots: Cell
clustering after cell cycle regression. Colours indicate new cluster identity of each cell and correspond with clusters shown in Fig. 2a. Bar graphs show quantification of cell clusters by
cycling status before and after regression. Source data EXTENDED DATA FIG. 2 MARKER AND GO TERM ANALYSIS OF CELL CLUSTERS FROM EACH PDX MODEL. A, tSNE plots display clustering of cells
coloured by mouse of origin from PDX models HCI001 (n = 247 cells), HCI002 (n = 401 cells) and HCI010 (n = 471 cells). B, tSNE plots display clustering of cells coloured by tissue of origin
from PDX models HCI001 (n = 247 cells), HCI002 (n = 401 cells) and HCI010 (n = 471 cells). C, Bar plots show selected top GO terms determined by the marker genes identified for each cell
cluster. _P_ values are determined by the Fisher exact test. Full marker gene lists utilized are listed in Supplementary Table 1. Specifically, for HCI001, _n_ = 162 A1 genes, _n_ = 107 A2
genes, and _n_ = 199 A3 genes. For HCI002, _n_ = 490 B1 genes, _n_ = 173 B2 genes, _n_ = 34 B3 genes, _n_ = 181 B4 genes, and _n_ = 194 B5 genes. For HCI010, _n_ = 96 C1 genes, _n_ = 247 C2
genes, _n_ = 198 C3 genes, _n_ = 357 C4 genes, _n_ = 54 C5 genes, _n_ = 110 C6 genes. D, Bar graphs show the log fold change (logFC) for selected genes from GO term pathways. Values indicate
the logFC of the average gene expression for the indicated cell cluster relative to all other clusters within that PDX model. Source data EXTENDED DATA FIG. 3 PROGNOSTIC VALUE OF
MICROMETASTASIS- ASSOCIATED GENES IN BASAL-LIKE BREAST CANCER PATIENTS. A, Kaplan-Meier curves show relapse free survival (RFS) in basal-like breast cancer patients from the KM plotter
database (879 patients), based on their primary tumour expression of specified micrometastasis-associated genes. _P_ values were determined via a log-rank test. B, Schematic for the
construction of a stepwise logistic regression model to identify top biomarker candidates descriptive of primary tumour or micrometastatic cells. The data was subsampled to analyse equal
numbers of micrometastatic and tumour cells from each mouse. The model was run on 10 subsamplings of the data, with the number of genes in each model determined by AIC. C, Plot demonstrating
the AIC versus the number of genes included in the model. AIC is used to balance parameter additions (that is gene additions) with the descriptive power of a model. Data is presented as the
10% and 90% quantiles of the 10 data subsamplings. D, Bar plot showing the number of model appearances for each gene out of 10 data subsamplings. EXTENDED DATA FIG. 4 GENE SCORING
IDENTIFIES OXPHOS AND GLYCOLYSIS AS TOP METABOLIC PATHWAYS DIFFERENTIALLY EXPRESSED BETWEEN MICROMETASTASES AND PRIMARY TUMOUR CELLS. Gene scores for each metabolic pathway in
micrometastatic (red, _n_ = 435 cells) or primary tumour cells (blue, _n_ = 684 cells). Each cell in the dataset was scored by calculating the difference between the average gene expression
for all the genes in each metabolic pathway versus the average gene expression of a randomly selected background gene set. Dotted line represents a zero score, which indicates the metabolic
pathway is not differentially expressed relative to the background gene set. The boxed value (top right of each plot) indicates the percent of genes in the pathway that was detected in the
dataset. The lower and upper hinges correspond to the first and third quartiles, and the midline represents the median. The upper and lower whiskers extend from the hinge up to 1.5 * IQR
(inter-quartile range). Outlier points are indicated if they extend beyond this range. EXTENDED DATA FIG. 5 OLIGOMYCIN TREATMENT INHIBITS OXPHOS IN MDA-MB-231 AND 4T1-GFP CELLS. A,B,
Schematic of the experimental setup to determine the effects of oligomycin treatment on MDA-MB-231 (A) or 4T1-GFP (B) cells. Oligo. = oligomycin. (C-D) Bar graph (left) of the viability of
MDA-MB-231 (C) or 4T1- GFP (D) cells 72-hours post-treatment determined via flow cytometry. Data is presented as the mean ± s.d. for n = 3 replicates. _P_ values determined by unpaired, two-
sided Student’s t-test. Brightfield images (right) of in vitro MDA-MB-231 (C) or 4T1-GFP (D) cells 72 hours after cessation of oligomycin treatment. Scale bar = 100 µm. E, Growth rate of
MDA-MB-231 cells for the indicated time period after cessation of oligomycin treatment. Data is presented as mean ± s.d. of n = 3 replicates. _P_ values determined by unpaired, two-sided
Students t-test. F, Extracellular acidification rate (ECAR) of MDA-MB-231 treated with oligomycin compared to control cells. ECAR was measured at the conclusion of treatment with oligomycin
as described in (A). Arrows indicate when drugs were added. O=oligomycin, F=FCCP, ROT/AA=Rotenone/ Antimycin A. Data is presented as mean ± s.d. of n = 4 replicates. G, Same as (E) for
4T1-GFP cells. H, Same as (F) for 4T1-GFP cells. Data is presented as mean ± s.d. of n = 3 replicates. _P_ values determined by unpaired, two-sided Students t-test. (I, J) Additional FLIM
images of the fluorescence lifetime of NADH in cultured MDA-MB-231 (I) or 4T1-GFP cells (J) as shown in Fig. 5e, f. Fields do not represent consecutive images of the same cell. O=oligomycin,
C=control. Scale bar=10 µm. (K-L) Brightfield images of tumours from orthotopically injected control or oligomycin treated MDA-MB-231 (K) or 4T1-GFP (L) cells. Bar graphs indicate tumour
weights (right). Data presented as mean ± s.d. of MDA-MB-231 (n = 6 oligomycin-treated, n = 6 control) and 4T1-GFP (n = 6 oligomycin-treated, n = 6 control) tumours. _P-_values were
determined by unpaired, two-sided Student’s t-test. Scale bar = 0.5 cm. Source data EXTENDED DATA FIG. 6 MODEL FOR METABOLIC SHIFT ASSOCIATED WITH METASTATIC SEEDING IN TNBC. Metastatic
cells in the lung and lymph nodes display increased OXPHOS, in contrast to primary tumour cells that express higher levels of genes associated with aerobic glycolysis. Pharmacological
inhibition of OXPHOS with the complex V inhibitor oligomycin substantially attenuates lung metastasis in experimental models of TNBC, showing that OXPHOS is functionally important for
metastasis. SUPPLEMENTARY INFORMATION REPORTING SUMMARY SUPPLEMENTARY TABLE 1 Marker genes characteristic of each cancer cell subpopulation (A1–A3; B1–B5; C1–C6) identified by clustering
analysis using the Seurat pipeline. Values indicate the log[FC] of the average gene expression for the indicated cell cluster relative to all other clusters within that PDX model.
Specifically, for HCI001, _n_ = 87 A1 cells, _n_ = 83 A2 cells and _n_ = 77 A3 cells. For HCI002, _n_ = 54 B1 cells, _n_ = 102 B2 cells, _n_ = 81 B3 cells, _n_ = 76 B4 cells and _n_ = 88 B5
cells. For HCI010, _n_ = 102 C1 cells, _n_ = 73 C2 cells, _n_ = 64 C3 cells, _n_ = 88 C4 cells, _n_ = 84 C5 cells and _n_ = 60 C6 cells. _P_ values were determined with the bimod test in
Seurat, which utilizes a likelihood-ratio test. Adjusted _P_ values were determined using the default Bonferonni adjustment in the Seurat FindAllMarkers() function. SUPPLEMENTARY TABLE 2 GO
terms associated with each cancer cell subpopulation (A1–A3; B1–B5; C1–C6). Full marker gene lists utilized for GO analysis are listed in Supplementary Table 1. Specifically, for HCI001, _n_
= 162 A1 genes, _n_ = 107 A2 genes and _n_ = 199 A3 genes. For HCI002, _n_ = 490 B1 genes, _n_ = 173 B2 genes, _n_ = 34 B3 genes, _n_ = 181 B4 genes and _n_ = 194 B5 genes. For HCI010, _n_
= 96 C1 genes, _n_ = 247 C2 genes, _n_ = 198 C3 genes, _n_ = 357 C4 genes, _n_ = 54 C5 genes and _n_ = 110 C6 genes. For HCI001, _n_ = 162 A1 genes, _n_ = 107 A2 genes and _n_ = 199 A3
genes. For HCI002, _n_ = 490 B1 genes, _n_ = 173 B2 genes, _n_ = 34 B3 genes, _n_ = 181 B4 genes and _n_ = 194 B5 genes. For HCI010, _n_ = 96 C1 genes, _n_ = 247 C2 genes, _n_ = 198 C3
genes, _n_ = 357 C4 genes, _n_ = 54 C5 genes and _n_ = 110 C6 genes. _P_ values were determined by the Fisher’s exact test in Enrichr. Adjusted _P_ values were determined by
Benjamini–Hochberg (BH) correction in Enrichr. SUPPLEMENTARY TABLE 3 330 genes differentially expressed between micrometastases and primary tumour cells. Differential expression analysis of
micrometastatic (_n_ = 435) and primary tumour (_n_ = 684) cells was performed using the tobit test in Seurat (additional details in Methods). _P_ values were determined by the tobit test in
Seurat, which utilizes a likelihood-ratio test. Adjusted _P_ values were determined by the default Bonferonni adjustment in the Seurat FindAllMarkers() function. SUPPLEMENTARY TABLE 4 GO
terms for the 330 genes differentially expressed between micrometastases and primary tumour cells and conserved in all three PDX models. GO terms identified for primary tumour (_n_ = 214
genes) and micrometastatic cells (_n_ = 116 genes) based on the 330 micrometastasis gene signature. _P_ values are determined by the Fisher’s exact test in Enrichr. Adjusted _P_ values were
determined by Benjamini–Hochberg (BH) correction in Enrichr. SUPPLEMENTARY TABLE 5 Genes associated with the 37 metabolic pathways for gene scoring analysis. SUPPLEMENTARY TABLE 6 Integrated
peak intensities for metabolites detected in micrometastases and primary tumour cells by LC–HRMS. SUPPLEMENTARY TABLE 7 Primer sequences used for quantitative real-time PCR. SOURCE DATA
SOURCE DATA FIG. 1 Statistical source data SOURCE DATA FIG. 2 Statistical source data SOURCE DATA FIG. 3 Statistical source data SOURCE DATA FIG. 4 Statistical source data SOURCE DATA FIG. 5
Statistical source data SOURCE DATA FIG. 6 Statistical source data SOURCE DATA EXTENDED DATA FIG. 1 Statistical source data SOURCE DATA EXTENDED DATA FIG. 2 Statistical source data SOURCE
DATA EXTENDED DATA FIG. 5 Statistical source data RIGHTS AND PERMISSIONS Reprints and permissions ABOUT THIS ARTICLE CITE THIS ARTICLE Davis, R.T., Blake, K., Ma, D. _et al._ Transcriptional
diversity and bioenergetic shift in human breast cancer metastasis revealed by single-cell RNA sequencing. _Nat Cell Biol_ 22, 310–320 (2020). https://doi.org/10.1038/s41556-020-0477-0
Download citation * Received: 28 October 2018 * Accepted: 04 February 2020 * Published: 06 March 2020 * Issue Date: March 2020 * DOI: https://doi.org/10.1038/s41556-020-0477-0 SHARE THIS
ARTICLE Anyone you share the following link with will be able to read this content: Get shareable link Sorry, a shareable link is not currently available for this article. Copy to clipboard
Provided by the Springer Nature SharedIt content-sharing initiative