Play all audios:
ABSTRACT Mitochondria are central to myriad biochemical processes, and thus even their moderate impairment could have drastic cellular consequences if not rectified. Here, to explore
cellular strategies for surmounting mitochondrial stress, we conducted a series of chemical and genetic perturbations to _Saccharomyces cerevisiae_ and analysed the cellular responses using
deep multiomic mass spectrometry profiling. We discovered that mobilization of lipid droplet triacylglycerol stores was necessary for strains to mount a successful recovery response. In
particular, acyl chains from these stores were liberated by triacylglycerol lipases and used to fuel biosynthesis of the quintessential mitochondrial membrane lipid cardiolipin to support
new mitochondrial biogenesis. We demonstrate that a comparable recovery pathway exists in mammalian cells, which fail to recover from doxycycline treatment when lacking the ATGL lipase.
Collectively, our work reveals a key component of mitochondrial stress recovery and offers a rich resource for further exploration of the broad cellular responses to mitochondrial
dysfunction. SIMILAR CONTENT BEING VIEWED BY OTHERS SPECIFIC ACTIVATION OF THE INTEGRATED STRESS RESPONSE UNCOVERS REGULATION OF CENTRAL CARBON METABOLISM AND LIPID DROPLET BIOGENESIS
Article Open access 27 September 2024 A GENETICALLY ENCODED TOOL TO INCREASE CELLULAR NADH/NAD+ RATIO IN LIVING CELLS Article 26 October 2023 UBIB PROTEINS REGULATE CELLULAR COQ DISTRIBUTION
IN _SACCHAROMYCES CEREVISIAE_ Article Open access 06 August 2021 MAIN Mitochondria are home to diverse metabolic, biosynthetic and signalling processes. Given this, even moderate
disruptions to mitochondrial function can lead to pervasive cellular consequences. Mutations in more than 400 genes have been causally linked to primary mitochondrial diseases1, which have a
collective incidence rate of 1:2,000–1:5,000 (ref. 2). Furthermore, several human diseases including Parkinson’s disease3, amyotrophic lateral sclerosis4, diabetes mellitus5 and Alzheimer’s
disease6 exhibit hallmarks of secondary mitochondrial dysfunction. Determining the mechanisms by which cells adapt to and overcome mitochondrial stress may be critical to treating these
diseases therapeutically. Additionally, this knowledge may assist the strategic impairment of mitochondria, such as in efforts to thwart apoptosis evasion by cancer cells—a therapeutic
strategy used for more than 50 years7,8. The cellular response pathways that restore mitochondrial function under stress conditions remain an active area of investigation. Early examinations
of mitochondrial DNA (mtDNA) loss in _Saccharomyces cerevisiae_ established a retrograde signalling pathway that alters nuclear gene expression to rescue critical metabolic functions and
extend the replicative lifespan9,10,11. Since these seminal studies, work in cultured mammalian cells and _Caenorhabditis elegans_ has revealed signalling pathways and gene expression
changes that occur during inter- and intracellular mitochondrial unfolded protein responses12,13,14,15. Beyond changes in gene expression, cells can elicit mitochondrial fragmentation16,17
or stress-induced mitochondrial hyperfusion and elongation in response to mitochondrial stress, which can confer stress resistance16,18,19. Although these and other studies have greatly
advanced our understanding of mitochondrial stress-related responses20,21,22,23, they were often conducted using singular and severe perturbations that may obscure important nuanced
responses across a gradient of stressor severity. This can hinder the exploration of certain response pathways, such as stress-induced mitochondrial hyperfusion, that require metabolically
active organelles18. Additionally, prior work has focused primarily on protein and gene effectors, marginalizing the role of lipids and metabolites, with few notable exceptions24,25.
Multiomic mass spectrometry profiling is an effective method to address these potential limitations because it can measure proteins, lipids and metabolites across multiple, diverse stress
conditions. This technique has been used extensively to link protein function to novel biological phenomenon26,27,28. Here, we present results from a multiomic mass spectrometry screen
examining _S._ _cerevisiae_ strains following perturbations to mitochondrial proteostasis of varying severity. We identified a consistent molecular signature unique to strains that recover
from mitochondrial stress. Specifically, we observed a repletion of mitochondrial content dependent on the mobilization of triacylglycerol (TAG) stores. This requisite mobilization was
independent of fatty acid oxidation but dependent on TAG lipases (Tgl3-5p), which liberated acyl groups for nascent cardiolipin biosynthesis. We further demonstrate that this mechanism for
overcoming mitochondrial stress is conserved in mammalian cells and that deletion of the TAG lipase gene _ATGL_ sensitizes cultured cells to treatment with doxycycline (DOX). Collectively,
these discoveries expand our understanding of a fundamental biological stress response and suggest that modulating lipid mobilization pathways may help cells contend with the moderate
mitochondrial dysfunction observed in pathological conditions. RESULTS MULTIOMIC PROFILING OF MITOCHONDRIAL STRESS AND RECOVERY To investigate how _S._ _cerevisiae_ respond to and recover
from certain mitochondrial stress, we performed a multiomic mass spectrometry analysis of 14 yeast strains (2 wild-type (WT) and 12 experimental) with distinct genetic and chemical
perturbations to mitochondrial proteostasis. Rather than ablate gene function through gene deletion, we introduced previously documented, disruptive point mutations in target genes using
CRISPR–Cas9 (see Supplementary Table 1 for detailed strain descriptions)20,29,30,31,32,33,34,35,36,37. This allowed us to include essential genes (_ssc1_, _hsp10_ and _mas1_) or genes
required for respiratory competency (_mrpl34_, _rrf1_ and _mrh4_). Furthermore, we examined constitutive overexpression of genes known to disrupt mitochondrial proteostasis (_cox4_ and
_mDhfr_) and exposure to pharmacological compounds that inhibit mitochondrial translation (doxycycline (DOX) and chloramphenicol (CAM)). To control for vehicle effects with pharmacologically
treated samples, we also included a dimethylsulfoxide (DMSO)-treated WT (WTV) as a vehicle control. We grew each experimental and control condition in biological triplicate in respiratory
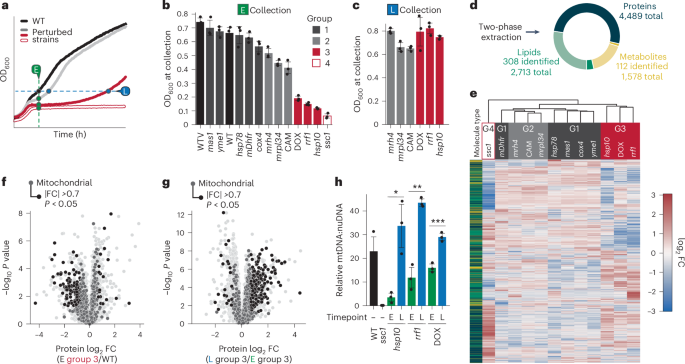
media and collected samples at one or two timepoints: a set early (E) timepoint shared by all strains and, for those strains with a growth lag, a late (L) timepoint at which their optical
density (OD) matched that of the WT strain’s early timepoint (Fig. 1a). Five strains, denoted ‘group 1’, exhibited a negligible growth lag within 20 min of WT and thus were only collected at
the E timepoint (Fig. 1b and Extended Data Fig. 1a,e). Among the others, three had a mild growth lag (group 2; Extended Data Fig. 1b) and three had a more severe growth lag (group 3;
Extended Data Fig. 1c), each of which were also collected at the L timepoint (Fig. 1c). Finally, a single strain (group 4; Extended Data Fig. 1d) did not survive the diauxic shift and was
thus collected only at the E timepoint. Collectively, these strains offer an opportunity to examine the cellular and molecular responses to a graded range of mitochondrial stress. We
analysed all collected samples using a custom liquid chromatography–mass spectrometry (LC–MS) processing protocol that allows for the extraction of proteins, lipids and polar metabolites
from a single sample38. This method resulted in the measurement of 4,489 proteins, 2,713 lipid species (308 identified) and 1,578 metabolites (112 identified), with biological replicates
matching closely on principal component analysis (Fig. 1d and Extended Data Fig. 1f). Hierarchical clustering separated the 12 experimental yeast strains and conditions collected at the E
timepoint into four distinct clades (Fig. 1e). These clades closely matched the four respiratory growth groups (Fig. 1b), suggesting that they may share common deficiency and recovery
signatures. Indeed, our group 3 strains, which had severe yet recoverable growth defects, exhibited marked loss of mitochondrial and OXPHOS proteins at the E timepoint that rebounded as the
strains recovered, along with increases in mtDNA levels and a rescue of OXPHOS, suggesting an increase in mitochondrial biogenesis (Fig. 1f–h and Extended Data Fig. 1g–j). Interestingly, the
group 4 _ssc1_ strain displayed a comparable set of mitochondria-related changes at the E timepoint (Extended Data Fig. 1k). In fact, group 3 and group 4 strains possessed a very similar
global respiration deficiency response—a universal response to loss of respiratory capacity26 (Extended Data Fig. 1l). Despite its similar response, the _ssc1_ strain did not recover,
perhaps indicating a failure to induce restorative pathways. Moreover, expression of defined retrograde stress-response pathway markers that may aid recovery were not induced in any of these
strains (Extended Data Fig. 1m,n). This is perhaps due to our selected parental yeast strain (W303), which has been shown to lack a robust retrograde response11. Collectively, these data
suggest that group 3 strains mount a successful cellular response to mitochondrial stress that may be distinct from the currently appreciated response pathways. TAG-DERIVED CARDIOLIPIN
PRODUCTION COINCIDES WITH RECOVERY To further investigate pathways relevant to the group 3 recovery, we examined our multiomic data for molecular changes that distinguish these strains from
group 4. The most striking difference between these groups was a marked decrease in group 3 TAG species, which remained largely unaffected in the sicker _ssc1_ strain (Fig. 2a). These
changes in TAG abundance occurred without notable changes to any other lipid class or an overall downshift in total lipid abundance (Extended Data Fig. 2a–d). Except for slight increases in
select species with low levels of saturation, the changes occurred in all TAG species regardless of chain length or saturation level (Extended Data Fig. 2e–g). The TAG phenotype was
confirmed using BODIPY staining (Fig. 2b and Extended Data Fig. 2h) and Nile red fluorescence (Fig. 2c and Extended Data Fig. 2i), demonstrating that the decrease was robust and specific to
the affected strains. Diminished TAG levels could result from compromised TAG biosynthesis and/or increased TAG mobilization. To assess the former, we performed a labelling experiment in
which strains subjected to chronic DOX treatment were pulsed with heavy [13C1]oleic acid for 1 h before collection to label newly synthesized TAGs. DOX-treated yeast again demonstrated
overall depletion of their unlabelled (light) TAGs (Fig. 2d); however, they rapidly produced new heavy-labelled TAGs following the [13C1]oleic acid pulse (Fig. 2e). This observation suggests
that the TAG loss in group 3 strains probably occurs through an increase in TAG mobilization, with liberated acyl groups potentially being shuttled into other lipid species. To monitor
potential destinations for TAG-derived acyl chains, we performed a separate labelling experiment in which WT cells were pulsed with [13C1]oleic acid for 1 h followed by an acute 3 h
treatment with DOX or vehicle (DMSO) control (Fig. 2f,g). The heavy oleic acid treatment effectively labelled TAGs and phospholipid species (Extended Data Fig. 2j–m), enabling us to observe
subsequent DOX-induced changes. Following the 3 h treatment, DOX-treated cells exhibited a significant elevation of labelled cardiolipin over vehicle-treated cells, despite the former’s
reduced growth rate (Fig. 2f,g). By contrast, no significant increases were observed for heavy phosphatidylethanolamine or heavy phosphatidylcholine (Fig. 2g). This suggests that, following
mitochondrial stress, available acyl groups are preferentially shuttled into nascent cardiolipin biosynthesis, potentially to support mitochondrial biogenesis. Consistently, along with their
increased mitochondrial protein abundance at the L timepoint of the multiomic screen (Fig. 1g), group 3 strains exhibited considerable elevation of the four most abundant _S._ _cerevisiae_
cardiolipin species39 to levels higher even than their healthy WT counterparts (Fig. 2h). Biosynthesis of the mitochondria-specific cardiolipin occurs entirely within the organelle itself40.
To determine whether disruption of this biosynthetic pathway would influence efficient recovery from mitochondrial dysfunction, we generated yeast deficient in the cardiolipin synthase
Crd1p and tested their growth under DOX treatment. Consistent with previous work41, deletion of _CRD1_ resulted in the total loss of cardiolipin in cells both treated and untreated with DOX
(Fig. 2i and Extended Data Fig. 2n). Likewise, consistent with past reports on _CRD1_ (ref. 42), we observed that the loss of cardiolipin occurred concurrently with a sharp increase in the
abundance of the cardiolipin precursor phosphatidylglycerol (PG) (Extended Data Fig. 2n). Although this strain did display a slight growth defect in glycerol, the increase in PG presumably
allows the _crd1_Δ strain to maintain respiratory growth (Fig. 2j). The increase in PG did not, however, enable this strain to efficiently recover from DOX treatment like its WT counterpart
(Fig. 2k). These data further suggest that cardiolipin is essential for recovery from mitochondrial stress and that the increase in cardiolipin we observe in our group 3 yeast strains is an
adaptive response that promotes efficient recovery. Interestingly, we found that, in addition to their lack of recovery, _crd1_Δ yeast did not mobilize TAG stores in response to DOX
treatment (Fig. 2l). LIPID DROPLETS PROVIDE TAGS FOR STRESS ADAPTATION These considerable lipid profile changes, coupled with the fact that our multiomic data lack spatial resolution,
prompted us to examine broader cellular phenotypes. To do so, we measured organellar changes using confocal microscopy in fluorescently tagged ‘rainbow’ yeast treated with DOX43. Consistent
with our multiomic data, the mitochondrial volume fraction of DOX-treated yeast was negatively skewed at the earlier timepoint and partially recovered by the late postrecovery timepoint.
(Fig. 3a–c). By contrast, the endoplasmic reticulum exhibited a more normal distribution at all timepoints measured (Fig. 3d,e). Interestingly, the volume of lipid droplets closely matched
that of mitochondria (Fig. 3f,g), further indicating a role for lipid mobilization in stress recovery and suggesting that lipid droplets are indeed the source of the exhausted TAG species.
Guided by this observation, we revisited our proteomics data and performed a correlation analysis with all measured proteins, lipids and metabolites to identify proteins correlated with the
TAGs most affected by mitochondrial stress (Fig. 3h). Of these, the partially characterized lipid droplet protein Pln1p (also known as Pet10p) was most positively correlated with all TAGs
measured, despite its modest absolute protein or transcript abundance changes in affected strains (Extended Data Fig. 3a–c). Pln1p has been described as a yeast perilipin and is thought to
reside on the surface of nascent lipid droplets and have a role in TAG biogenesis44; however, its role in TAG mobilization is unknown. Given its positive correlation with TAG levels, we
reasoned that overexpressing _PLN1_ could disrupt TAG catabolism observed under mitochondrial stress. Indeed, overexpression of _PLN1_ prevented the reduction of TAGs under DOX treatment and
resulted in an overall increase of TAG species (Fig. 3i,j and Extended Data Fig. 3d). To directly measure the effect of _PLN1_ overexpression on TAG catabolism, we performed a modified
[13C1]oleic acid pulse-chase experiment (Fig. 3k). As in our previous heavy labelling experiments, we cultured yeast in respiratory media and treated them with [13C1]oleic acid for 1 h
before collecting and measuring the abundance of newly synthesized heavy [13C1]-labelled triolein (Fig. 3k). Overexpression of _PLN1_ did not have a significant effect on the abundance of
heavy [13C3]-labelled TAGs, suggesting that is does not drastically increase the rates of TAG biosynthesis (Fig. 3l). Following the 1 h labelling with [13C1]oleic acid, we next treated the
strains with cerulenin, a potent inhibitor of TAG biosynthesis45, and DOX to induce TAG mobilization, and collected yeast after 1, 3 and 5 h to measure the rate at which the heavy
[13C3]triolein was mobilized (Fig. 3k). By the 3 h timepoint, TAG levels in WT yeast were already trending lower than the _PLN1_ overexpressing strain. This difference widened at 5 h, with
WT yeast having 43% lower levels of heavy [13C3]triolein compared with the _PLN1_ overexpressing strain (Fig. 3m). Fittingly, without the ability to mobilize TAG stores, yeast overexpressing
_PLN1_ displayed a significant growth defect in respiratory media when treated with DOX (Fig. 3n and Extended Data Fig. 3e,f). Together, these analyses highlight the importance of lipid
droplet-derived TAG mobilization for mitochondrial stress recovery that is, in part, regulated by the poorly characterized protein Pln1p. EFFICIENT STRESS RECOVERY REQUIRES TAG MOBILIZATION
Given our observation that TAG mobilization is key for mitochondrial recovery, we next explored the mechanism by which acyl chains are derived from lipid droplets. TAG catabolism in yeast
occurs via one of two pathways (Fig. 4a). The most well studied is the gradual lipolysis of TAG molecules at the lipid droplet via the TAG lipases Tgl3-5p46,47. The second pathway for TAG
mobilization is lipophagy, where lipid droplets are engulfed within the vacuole and rapidly degraded48. Lipophagy requires the lipid droplet–vacuole contact site Ldo proteins (Ldo45/16p)49
and canonical autophagy proteins such as Atg14p50, Atg15p48 and Atg1p51. To determine the mechanism for our observed decrease in intracellular TAG abundance, we generated yeast deletion
mutants defective in each of these pathways (_tgl3_Δ_tgl4_Δ_tgl5_Δ (_tgl_ΔΔΔ) for lipolysis, and both _ldo45_Δ/_16_Δ (_ldo_ΔΔ) _and atg14_Δ for lipophagy). We then performed an acute 3 h DOX
treatment to observe TAG mobilization. Despite the reduced duration of DOX treatment compared with our initial analysis (Fig. 1a), WT cells displayed reduced TAG levels as measured by
either Nile red florescence (Fig. 4b) or LC–MS/MS (Fig. 4c). Of the three deletion strains tested, only the triple _tg_lΔΔΔ mutant preserved TAG levels after the 3 h DOX treatment, while
both the _ldo_ΔΔ and _atg14_Δ strains exhibited TAG depletion comparable to WT cells (Fig. 4b,d and Extended Data Fig. 4a,b). Other canonical autophagy mutants such as _atg1_Δ and _atg15_Δ
also had no effect on TAG mobilization (Extended Data Fig. 4c–e). Together, these data indicate that Tgl3-5p-driven lipolysis is the main pathway for TAG catabolism employed by yeast cells
following this mitochondrial stress. To further explore the role of lipolysis in enabling cellular recovery from mitochondrial stress, we compared the ability of WT and _tgl_ΔΔΔ mutant
strains to recover from prolonged DOX treatment. Both strains exhibited a substantial growth defect after 24 h in DOX; however, unlike WT, _tgl_ΔΔΔ mutant yeast were unable to recover growth
by the later stage (Fig. 5a). Interestingly, yeast lacking the TAG biosynthetic gene diacylglycerol-acyl transferase (_dga1_Δ), which fail to accumulate TAGs under respiratory conditions,
or quadruple knockout strains lacking all neutral lipid synthesis enzymes (_dga1_Δ_lro1_Δ_are1_Δ_are2_Δ (ΔΔΔΔ)), also failed to overcome DOX treatment (Fig. 5a and Extended Data Fig. 5a–c).
Deletion of the alternative TAG synthesis enzyme in yeast, _LRO1_, alone did not affect recovery (Extended Data Fig. 2c). This further implicates an essential role for TAG biogenesis and
subsequent mobilization in overcoming mitochondrial stress and excludes the possibility that TAG toxicity from failed catabolism is driving the delayed growth phenotype in our _TGL_ triple
mutant strain. Our analyses above demonstrate that TAG mobilization is key to cellular recovery from mitochondrial stress, at least in part by supporting new cardiolipin production. A
potential second role for TAG lipolysis could be to fuel fatty acid beta-oxidation (FAO). To test this, we also generated an FAO-deficient yeast strain by deleting the fatty-acyl coenzyme A
oxidase gene, _POX1_. _pox1_Δ yeast, which showed increased TAG levels before treatment (Extended Data Fig. 5c), demonstrated robust recovery and TAG mobilization following DOX treatment
(Fig. 5a and Extended Data Fig. 5d). These experiments indicate that increased FAO was not supporting recovery and further highlight the importance of new lipid biosynthesis, such as
cardiolipin, for mitochondrial membrane biogenesis. Consistent with this hypothesis, unlike WT yeast, _tgl_ΔΔΔ yeast failed to fully increase their cardiolipin levels after prolonged DOX
treatment (Fig. 5b) and were unable to rescue mitochondrial protein abundance, despite having WT levels of mtDNA (Fig. 5c–g and Extended Data Fig. 5f). Furthermore, supplementation with
oleic acid, at a sufficient level for labelling TAG species, was not able to rescue the growth defect (Extended Data Fig. 5g,h). Together, these data indicate that TAG mobilization,
specifically through Tgl3-5p-driven lipolysis, is essential for overcoming DOX-induced mitochondrial stress. TAG PROCESSING DRIVES STRESS RECOVERY IN MAMMALIAN CELLS Finally, we sought to
determine whether mammalian cells also rely on TAG mobilization to recover from mitochondrial stress. To test whether mammalian cells would recover from DOX treatment, we grew HAP1 cells in
galactose-based media, in which cells require active mitochondrial respiration for survival, and treated with DOX over a 6 day time course. DOX-treated HAP1 cells exhibited a clear growth
lag following the swap into galactose media, but eventually grew to confluency, mirroring the growth pattern observed in our group 3 yeast strains (Fig. 6a). We next collected cells both
pre- and post-recovery to mirror our yeast collections. Unlike the yeast system, treatment with DOX did not result in the global loss of mitochondrial proteins, but instead elicited a more
specific decrease in nuclear- and mtDNA-encoded OXPHOS subunits (Extended Data Fig. 6a). Similar to the yeast strains, these mitochondrial proteins recovered in abundance over time (Fig.
6b). To examine the activity of TAG mobilization in this recovery phenotype, we performed untargeted lipidomics on the cells grown throughout the galactose time course. While DOX-treated
cells had higher TAG abundance at day 2 (Extended Data Fig. 6b), they consistently depleted their TAG stores between days 2 and 5 (Fig. 6c). We next tested whether the mammalian functional
homologue of the yeast _TGL_ genes, _ATGL_, was required for this TAG reduction and cellular growth recovery. Indeed, DOX-treated _ATGL_ knockout cells had increased TAG abundance by day 5,
indicating that _ATGL_ was at least partially responsible for the observed TAG mobilization (Fig. 6d). Remarkably, we observed that knockout of _ATGL_ was synthetically lethal with DOX
treatment, validating the importance of TAG mobilization in overcoming mitochondrial stress in mammalian cells (Fig. 6e,g). Comparable to the yeast model, mobilized acyl groups from
catabolized TAGs seemingly were not consumed via FAO, as disruption of carnitine palmitoyltransferase II (CPT2)—an enzyme essential for normal FAO—caused no further growth defect with DOX
treatment (Fig. 6f,g). Collectively, these data confirm that, in both mammalian and yeast systems, TAG mobilization is essential for the recovery from certain mitochondrial stress.
DISCUSSION Mitochondria are essential for many cellular processes, and yet cells have a considerable capacity to tolerate mitochondrial defects. This tolerance is perhaps most evident by the
extreme mutational load required to elicit an observable phenotype in patients with mtDNA heteroplasmy52. In turn, this indicates that cells invoke restorative response pathways to buffer
mitochondrial stresses. Here, we designed a study to probe how yeast overcome a range of mitochondrial stressors with varying severity and identified a common and essential response for
surmounting these perturbations. We found that cells faced with notable stress can rescue mitochondrial content by inducing mitochondrial biogenesis. Critically, this increase in
mitochondrial biogenesis requires the capacity to mobilize intracellular TAG stores as a means to provide acyl groups to support mitochondrial lipid biosynthesis. Yeast strains that lacked
the ability to use TAGs became sensitive to DOX treatment. Furthermore, we show that the necessity for TAG mobilization in overcoming mitochondrial stress is conserved in mammalian cells,
suggesting that there is, perhaps, an underappreciated role for the regulation of lipid availability in mitochondrial disease. This study is part of a growing narrative that lipid
homeostasis becomes dysregulated during mitochondrial stress. While numerous groups have measured the abundance of lipid species during stress conditions, the results are conflicting. In
_C._ _elegans_, previous work showed a decrease in the abundance of TAG species after treatment with DOX, potentially caused by an increase in TAG lipolysis25. By contrast, knockdown of
mtHsp70 in _C._ _elegans_ resulted in the induction of a mitochondria-to-cytosolic stress response, characterized by a concomitant increase in TAG abundance24. Interestingly, these results
match our DOX-treated and _ssc1_ (yeast homologue of mtHsp70) yeast strains, respectively, in which only the DOX-treated strain exhibited depleted TAG species. Collectively, these studies
point to the dysregulation of lipid metabolism during mitochondrial stress; however, their conflicting nature suggest these response pathways are more nuanced then previously realized and
require further investigation. How the lipidome changes in mammalian cells challenged with mitochondrial stress has also been an active area of investigation. Patients with primary
mitochondrial disease commonly have markedly increased plasma TAG abundance53 and mouse models with genetically induced mitochondrial dysfunction in enterocytes or hepatocytes will
accumulate lipids in these tissues54,55,56. Similarly, cultured cells treated with antimycin A or rotenone, two inhibitors of the mitochondrial electron transport chain, displayed elevated
TAG species due to an increase in TAG biosynthesis and decrease in beta-oxidation57,58,59. Increases in TAG abundance may perhaps lead to the incorrect assumption that TAG mobilization is
not important under stress conditions. However, our results demonstrate that, despite the increase in TAG abundance in DOX-treated HAP1 cells, their inability to mobilize TAG stores leads to
their demise. This suggests that increased TAG biogenesis may be tipping the scales to favour TAG accumulation despite increased reliance on mobilization. The role of the lipolysis in
overcoming mitochondrial stress in mammalian cells remains to be determined. The increase in cardiolipin abundance and the essentiality of the cardiolipin biosynthetic pathway that we
observe in yeast treated with DOX may point to changes in mitochondrial architecture. It has long been appreciated that mammalian cells undergo changes to their mitochondrial network after
CAM16 or DOX17 treatment. Furthermore, energy stress caused by glucose starvation will alter mitochondrial dynamics and result in mitochondrial elongation with an increase in cristae surface
area19,60. Presumably such drastic changes in mitochondrial membrane abundance would involve a considerable injection of lipid species into the system, although this has yet to be fully
explored. It is tempting to speculate that lipolysis of TAG stores could be involved in this process. Transfer of the acyl-tails from TAGs to phospholipids could then be used to supply
lipids needed for rapid mitochondrial membrane expansion, akin to that seen in autophagosome formation61. Strains that lack this ability may then lack the required space for mitochondrial
protein expression, resulting in the failure to rescue mitochondrial protein abundance observed in our _tgl_ΔΔΔ strains, even though they maintain WT levels of mtDNA. The mechanism of
drawing from TAG stores to feed membrane expansion is well established in yeast. Following the exit from stationary the phase, rapid growth requires the activity of _TGL3_ or _TGL4_ to
provide phospholipid substrates for membrane biosynthesis46. Similarly, spore membrane formation and sporulation efficiency also require these proteins46. Our observations that the _tgl_ΔΔΔ
mutant could not efficiently recover from mitochondrial stress and exogenous free fatty acids did not rescue this phenotype suggest that these proteins are also essential for mitochondrial
stress recovery. Interestingly, Tgl3-5p proteins in _S._ _cerevisiae_ contain both lipase and acyltransferase domains46,47, with the latter being most critically important for rescuing spore
formation46. Determining the contributions of the acyltransferase domain in overcoming mitochondrial stress is an intriguing future direction. Furthermore, as the mammalian TAG lipases do
not contain acyltransferase domains, this may indicate that there are additional acyltransferase proteins that could participate in mitochondrial recovery. It would be interesting to assess
whether any of the multiple, poorly characterized acyltransferases that localize to mitochondria could have a role in this process. Remaining open questions concern the signal that initiates
TAG mobilization and why certain strains seemingly lack the ability to mount a mobilization response. One possibility is the signal requires mtDNA. This model would be in line with our
observation that the _ssc1_ strain—the only strain with no detectable mtDNA—lacked the ability to mobilize TAGs under these circumstances. An alternative possibility is that the signal
requires a baseline level of OXPHOS function before being activated. Given that a baseline level of OXPHOS function is required to maintain mtDNA levels, these models are difficult to
separate. Interestingly, the _crd1_Δ mutant that lacked all cardiolipin also failed to mobilize TAG species, suggesting that this mitochondrial phospholipid may have an unappreciated role in
activating TAG mobilization. Our deep multiomic analyses enabled us to draw further connections between proteins and TAG abundance. In particular, we linked the lipid droplet protein Pln1p
to TAG mobilization during mitochondrial stress. The overexpression of _PLN1_ prevented efficient lipolysis required for surmounting mitochondrial stress, the first direct evidence that
Pln1p has a role in lipolysis. Mammalian cells have five distinct perilipins (PLIN1–PLIN5), whereas Pln1p is the only known perilipin in _S._ _cerevisiae_ expressed under normal growth
conditions62. Pln1p is involved in lipid droplet biogenesis, where it binds to nascent lipid droplets at an early stage and facilitates their expansion, akin to the function of the mammalian
PLIN3 (ref. 44). Additionally, Pln1p has been found localized to lipid droplet–mitochondrial contact sites, suggesting it may have overlapping functions with PLIN5 (ref. 63). It is
plausible that Pln1p performs more general, widespread perilipin functions rather than its more specialized mammalian counterparts. Fitting with this possibility, both PLIN2 and PLIN3, but
not PLIN1, were able to rescue the lipid droplet biogenesis phenotype observed in the _pln1_∆ yeast strain44. The role of Pln1p in lipolysis is less clear. Deletion of _PLN1_ destabilizes
lipid droplets44, therefore localized removal of Pln1p may be required for efficient lipolysis. It cannot be ruled out that Pln1p may have a more active role in lipolysis inhibition. Future
studies on Pln1p will elaborate on these functions, as well as determine what role, if any, mammalian perilipins play in overcoming mitochondrial stress. Finally, our results provide the
first indication that TAG mobilization may be a valid therapeutic target for human diseases involving mitochondrial stress. Increasing mitochondrial biogenesis to overcome mitochondrial
stress has been proposed to treat mitochondrial diseases64,65 and neurological conditions66,67. Our results would indicate that the bioavailability of acyl groups may become rate limiting
under these conditions and that potentially increasing phospholipid availability could be considered to help aid in treatment. Furthermore, many cancers are reliant on mitochondrial
function7 and increased metabolic stress in these cell lines makes their mitochondria a target for chemotherapeutic agents8,68. Here, combinatorial therapies that target both mitochondrial
function and lipid availability may represent an intriguing means to boost drug efficacy. In total, our dataset provides the quantification of over 8,500 biomolecules for each strain used in
the study, comprising comprehensive coverage of the expressed yeast proteome, many major lipid classes, and metabolites from the most well-known metabolic pathways, all within the context
of mitochondrial stress. Beyond the biological insights we provide here, this dataset will provide a rich community resource for further exploration of the multifaceted mitochondrial
stress-response pathways. METHODS YEAST STRAIN GENERATION AND CULTURE CONDITIONS The _S._ _cerevisiae_ haploid strain W303 (MATa leu2 trp1 can1 ura3 ade2 his3) was used and cultured under
standard laboratory conditions. Single (_gene_∆), double (_gene_∆_gene_∆) and triple (_gene_∆_gene_∆_gene_∆) deletion strains (Supplementary Table 1) were generated using homologous
recombination where open reading frames were replaced with the kanMX6, His3MX6, HygMX6, Leu2MX6 and/or Trp1 cassettes transformed using standard heat shock conditions and confirmed via PCR
genotyping69,70. Point mutants in the relevant genes were generated with a combined CRISPR–Cas9 vector71 (Addgene, plasmid 81191), using 500 bp donor DNA containing the relevant point
mutations. For overexpression strains, plasmids with arms homologous to the inert HO locus containing the Ura3 cassette (Addgene, plasmid 51663) were first digested using the NotI
restriction enzyme (NEB) and integrated into the genome though homologous recombination as above72. DOX (200 µM, Biogems) and CAM (300 µM, Sigma-Aldrich) treated strains were treated with
their respective compound throughout the secondary growth. For the multiomic screen, strains from glycerol stocks were first struck out YPD plates consisting of 1% (w/v) yeast extract (‘Y’)
(Research Products International), 2% (w/v) peptone (‘P’) (Research Products International), 2% (w/v) dextrose (‘D’) (Fisher) and 2% (w/v) agar (Sigma-Aldrich) and allowed to grow for 48 h
at 30 °C. Preliminary starter cultures were inoculated from individual colonies in 3 ml YPD media and incubated for 24 h (30 °C, 230 rpm). Cell density was measured at OD600 and 1.25 × 10⁶
cells from each starter culture were used to inoculate 50 ml of respiratory YPG media (1% (w/v) Y, 2% (w/v) P, 0.1% D and 3% glycerol (‘G’)) in a sterile 250 ml Erlenmeyer flask. Samples
were incubated (30 °C, 230 rpm) and 1 × 10⁸ cells were collected at 24 h, a timepoint that corresponds to early respiratory growth. Strains with a noticeable growth lag (>20 min) were
continuously monitored and a subsequent 1 × 10⁸ cells were collected at an OD that was at least 90% of the average WT OD at the 24 h timepoint. The samples were collected by centrifugation
(4,000_g_, 5 min, room temperature). The supernatant was removed and the cells washed with 1 ml of sterile water. Cells were pelleted again (12,000_g_, 1 min, room temperature) and the
supernatant was removed. Cell pellets were snap frozen in liquid nitrogen (LN2) and stored at −80 °C until analysis. HAP1 CELL CULTURE CONDITIONS HAP1 WT and knockout cells (Horizon
Discovery; Supplementary Table 5) were cultured in Iscove’s modified Dulbecco media (Thermo) with 10% heat-inactiated FBS (Biotechne) and 1× penicillin–streptomycin (Thermo) at 37 °C and 5%
CO2. For galactose growth assays, 5 × 10⁶ cells per plate were seeded in triplicate into 10 cm dishes with 10 µM DOX (Biogems) or vehicle control and incubated overnight to allow cells to
adhere to the plate. Cells were washed with 1× Dulbecco’s phosphate-buffered saline (DPBS) and medium was replaced with glucose-free Dulbecco’s modified Eagle media (Thermo) supplemented
with 25 mM galactose, 10% dialysed FBS (Biotechne) 1× penicillin–streptomycin and 10 µM DOX or DMSO vehicle control. Cells were collected at the indicated timepoint and cell counts were
acquired with the TC20 Automated Cell Counter (Bio-Rad). Population doubling was calculated as log2(final density/seeding density). For proteomic and lipidomic analysis 2 × 10⁶ cells were
collected at the indicated timepoints, snap frozen in LN2 and stored at −80 °C until analysis. RESPIRATORY GROWTH ASSAYS Starter cultures (YPD, 3 ml) were inoculated with individual colonies
and incubated overnight (30 °C, 230 rpm, 14–16 h). For plate reader-based assays, cells were pelleted and resuspended in respiratory media (YPG) at a density of 5 × 10⁶ cells per ml. Then,
100 µl of the resuspended cells were transferred to a sterile 96-well round-bottom plate (Thermo) with a Breathe-Easy cover seal (Diversified Biotech). Cultures were incubated (30 °C, 1140
rpm) in an Epoch2 plate reader (BioTek) with OD600 measured every 10 min. Growth rates and lag times were calculated using Gen5 v3.02.2 software (BioTek), excluding timepoints before the
diauxic shift and during the stationary phase growth. For larger culture growth assays, 2.5 × 10⁴ cells per ml were used to inoculate 50 ml of YPG culture in a sterile 250 ml Erlenmeyer
flask. Samples were incubated (30 °C, 230 rpm, 14–16 h) and then the OD was measured at the desired timepoints using a NanoDrop One spectrophotometer (Thermo Scientific). Where indicated,
200 µg ml−1 DOX was dissolved into media either immediately before inoculation for chronic treatment or spiked in at the desired timepoint for acute treatments. For experiments involving
overexpression of _PLN1_ in synthetic deficient (SD) media, growth times were as above but cells were grown in SD media (0.67% yeast nitrogen base, 0.2% Ura− drop-out mix) containing either
fermentative (2% D) or respiratory (3% G and 0.1% D) carbon sources. [13C1]OLEIC ACID HEAVY LABELLING CONDITIONS For initial labelling experiments, 3 ml starter and 50 ml secondary growth
cultures were inoculated as in ‘Yeast strain generation and culture conditions’ section with WT cells either treated with DOX (400 µM) or DMSO vehicle. [13C1]oleic acid (Cambridge Isotope
Labs) was added to the growth media at a concentration of 30 µM, 1 h before collection (23 h after inoculation). Then, 1 × 10⁸ cells were collected at 24 h growth time. For subsequent
experiments involving acute DOX treatment, WT cells were grown as above, but after 1 h of 13C labelling, 400 µM DOX was spiked into media, either with or without 10 mg l−1 cerulenin for the
pulse or pulse chase respectively. Next, 1 × 10⁸ cells were collected at the time of the DOX/cerulenin injection (_T_0) and again either 1, 3 or 5 h later (_T_1–5h). Cells for both
experiments were centrifuged (4,000_g_, 5 min, 4 °C) and washed with 1 ml of water. Cells were then snap frozen in LN2 and stored at −80 °C until analysis. BIOMOLECULE EXTRACTION FOR
MULTIOMIC SCREEN Samples were grouped into multiple batches and were randomized to mitigate batch effects on the overall study. The detailed extraction procedures were as follows: all
reagents were chilled on ice, and samples were maintained at ≤4 °C during the extraction procedure. A 5-mm-diameter stainless metal bead (Qiagen) was first added to each sample. Next, 500 µl
of M1 (75% (v/v) methyl _tert-_butyl ether (MTBE; Sigma-Aldrich), 25% (v/v) LC–MS grade methanol (Fisher) was added and tubes were vortexed for 2 min. Then, 325 µl of M2 (75% (v/v) filtered
water, 25% (v/v) methanol) was added to each tube. Samples were vortexed briefly then snap frozen in LN2 and thawed on ice three times to facilitate cell breakage. Samples were transferred
to a bead beater and shaken at 1/25 s frequency for 5 min, and this process was done three times. The samples were then centrifuged (12,500_g_, 10 min, 4 °C). For downstream lipid analysis,
200 µl of the organic layer (upper phase) was transferred to a glass autosampler vial and dried by vacuum centrifugation. For downstream metabolomic analysis, 200 µl of the aqueous layer
(lower phase) was transferred to a glass autosampler vial and dried by vacuum centrifugation. The remaining protein pellets were kept on ice until protein digestion. Once dried, organic
extracts intended for lipid analysis were resuspended in 100 µl of 65% (v/v) isopropyl alcohol (IPA; Fisher), 30% (v/v) acetonitrile (ACN; Fisher) and 5% (v/v) sterile water and vortexed for
20 s before analysis by LC–MS. Aqueous extracts intended for metabolomic analysis were resuspended in 50 µl of 50% (v/v) ACN and 50% (v/v) sterile water and also vortexed for 20 s before
analysis by LC–MS. PROTEOMICS LC–MS DATA ACQUISITION AND ANALYSIS FOR MULTIOMIC SCREEN Protein pellets were washed with 1 ml ACN and centrifuged (1,000_g_, 3 min, 4 °C). The supernatant ACN
was aspirated and pellets were allowed to sit for 10–15 min at room temperature or vacuum dried briefly to allow for evaporation of the liquid remaining in the tube. Next, 300 μl lysis
buffer (8 M urea (Sigma-Aldrich) with 100 mM tris(2-carboxyethyl)phosphine (Sigma-Aldrich), 40 mM 2-chloroacetamide (Sigma-Aldrich) and 100 mM Tris (Sigma-Aldrich, pH 8.0)) was added to each
sample and vortexed until the protein pellets were fully dissolved. Then, 5 μg LysC (Wako Chemicals) was added to each sample with a protein:enzyme ratio of 70:1 and digestion was proceeded
overnight at room temperature. Each sample was diluted with 100 mM Tris to reach a final concentration of 2 M urea. Trypsin (Promega) was added at 70:1 protein:enzyme ratio and digestion
proceeded for 6 h at room temperature. Desalting was carried out with 96-well desalting plates (10 mg per well, StrataTM-X 33 μm Polymeric Reversed phase, Phenomenex). A blank well between
any two samples was reserved to avoid cross contamination. Desalting started with equilibrating the desalting wells with 1 ml of 100% ACN, followed by 1 ml of 0.2% (v/v) formic acid (FA;
Thermo Scientific). The acidified peptide mixture was loaded to the 96-well desalting plate, followed by 2 ml 0.2% (v/v) FA wash. Peptides were eluted into a 96-well collection plate with
600 μl 80% (v/v) ACN with 0.2% (v/v) FA. Peptides were dried by vacuum centrifugation and stored at −80 °C until resuspension with 0.2% (v/v) FA. After resuspension, peptide concentration
was measured using a quantitative colorimetric peptide assay according to the manufacturer’s protocols (Pierce, Thermo Scientific). Peptides were separated on an in-house prepared
high-pressure reversed-phase C18 column. In brief, a 75–360 μm inner–outer diameter bare-fused silica capillary was packed, with 1.7 μm diameter, 130 Å pore size, bridged ethylene hybrid C18
particles (Waters) under high pressure of 25,000 psi to a final length of ~40 cm (ref. 73). The column was installed onto a Thermo Ultimate 3000 nano LC and heated to 50 °C for all runs.
Mobile phase buffer A was composed of water with 0.2% (v/v) FA. Mobile phase B was composed of 70% (v/v) ACN with 0.2% (v/v) FA. Samples were separated with a 90 min LC method: peptides were
loaded onto the column for 9 min at 0.30 μl per min. Mobile phase B was increased from 0% to 10% in 9 min, then increased to 55% B by 74 min, and increased to 100% B by 75 min and held for
4 min at 100% B, then decreased to 0% B by 80 min and allowed to equilibrate for 10 min 0% B. Eluting peptides were ionized by electrospray ionization and analysed on a Thermo Orbitrap
Eclipse. Survey scans of precursors were taken from 300 to 1,350 _m_/_z_ at 240,000 resolution (at 200 _m_/_z_). The maximum injection time was set to 50 ms and the automatic gain control
(AGC) target was 250%. Tandem MS was performed using an isolation window of 0.5 Th with a dynamic exclusion time of 10 s. Selected precursors were fragmented by higher energy collisional
dissociation using a normalized collision energy (NCE) level of 25%. The MS2 AGC target was set to 3 × 10⁴ ions with a maximum injection time of 14 ms. The scan range was 150–1,350 _m_/_z_.
Scans were taken using the Turbo speed setting and only peptides with a charge state of +2 or greater were selected for fragmentation. LC–MS files for proteomics were searched in Maxquant
(version 1.5.5.5) against the downloaded _S._ _cerevisiae_ proteome database from Uniprot. Original outputs from Maxquant were inspected and potential contaminant proteins, protein groups
that contain proteins identified with decoy peptide sequence and those identified only with a modification site were removed. Label-free quantification intensities were used as the
quantification metric. To replace missing values, log2 transformation and imputation in Perseus was performed. The parameters for imputation were the default settings, with width: 0.3, down
shift: 1.8 and mode: separately for each column. PROTEOMICS FOR HAP1 CELLS Cell pellets were resuspended in 200 µl 2% SDS containing cOmplete Protease Inhibitor Cocktail (Sigma-Aldrich) and
heated at 95 °C for 5 min. Nucleic acids were sheared with 2 µl benzonase (Sigma-Aldrich) and samples were incubated on ice for 15 min. Protein content was quantified using the BCA assay
(Pierce, Thermo) and 100 µg of protein was alkylated and reduced in digestion solution (10 mM tris(2-carboxyethyl)phosphine, 40 mM 2-chloroacetamide and 100 mM Tris (pH 8.0)) for 30 min at
room temperature. Protein was subjected to single-pot, solid-phase-enhanced sample preparation (SP3) to remove detergent by incubating with magnetic carboxylated SpeedBeads (Sigma). After 1
h incubation to allow protein binding, beads were washed with 80% (v/v) ethanol and allowed to dry. The beads were resuspended in 100 µl of 100 mM Tris (pH 8.0) and trypsin (Promega) was
added to each sample in an estimated 50:1 protein:enzyme ratio to digest at 37 °C for 16 h. The supernatant containing tryptic peptides was collected and acidified with trifluoroacetic acid
(Sigma-Aldrich) to a final pH of 2. Peptides were desalted by solid-phase extraction cartridges (Phenomenex) and dried under vacuum. Samples were resuspended in 0.2% FA and subjected to
LC–MS analysis. LC separation was performed using the Thermo Ultimate 3000 RSLC nano system. A 15 cm EASY-Spray PepMap RSLC C18 column (Thermo, 150 mm × 75 µm, 3 µm) was used at 300 nl per
min flow rate with an Acclaim PepMap C18 HPLC trap column (Thermo, 20 mm × 75 µm, 3 µm) for sample loading. For each sample run, the temperature was held at 35 °C for a 120 min gradient that
consisted of 4% B for 5 min and increased to 30% B over 100 min, followed by 5 min at 99% B and back to 4% B for equilibration for 10 min. Mobile phase A consisted of 0.1% FA in water, and
mobile phase B consisted of 0.1% FA in 80% (v/v) ACN and 20% (v/v) water. MS detection was performed with a Thermo Exploris 240 Orbitrap mass spectrometer with an EASY-Spray source operating
in positive mode. The source voltage was 1.8 kV, the ion transfer tube temperature was set to 275 °C and the RF lens at 70%. Full MS spectra were acquired from _m_/_z_ 350 to 1,400 at the
Orbitrap resolution of 60,000, with a normalized AGC target of 300% (3 × 10⁶). Data-dependent acquisition was performed with a 3 s duty cycle with a charge state of 2–6, an isolation window
width of 2 and an intensity threshold of 5 × 10³. Dynamic exclusion was 20 s with the exclusion of isotopes. Other settings for data-dependent acquisition were an Orbitrap resolution of
15,000 and higher energy collisional dissociation energy of 30%. Raw files were analysed by the SequestHT Search Engine incorporated in Proteome Discoverer v.2.5.0.400 software against human
databases downloaded from Uniprot. Label-free quantification was enabled in the searches. LIPIDOMICS LC–MS DATA ACQUISITION AND ANALYSIS FOR MULTIOMIC SCREEN Extracted lipids were separated
on an Acquity CSH C18 column (100 mm × 2.1 mm × 1.7 µm particle size; Waters) at 50 °C using the following gradient: 2% mobile phase B from 0 to 2 min, increased to 30% B over the next 1
min, increased to 50% B over the next 1 min, increased to 85% over the next 14 min, increased to 99% B over the next 1 min, then held at 99% B for the next 7 min (400 µl per min flow rate).
Column re-equilibration of 2% B for 1.75 min occurred between samples. For each analysis 10 µl per sample was injected by the autosampler. Mobile phase A consisted of 10 mM ammonium acetate
(Sigma-Aldrich) in 70% (v/v) ACN, 30% (v/v) water with 250 µl l−1 acetic acid (Sigma-Aldrich). Mobile phase B consisted of 10 mM ammonium acetate in 90% (v/v) IPA and 10% (v/v) ACN with 250
µl l−1 acetic acid. The LC system (Vanquish Binary Pump, Thermo Scientific) was coupled to a Q-Exactive Orbitrap mass spectrometer through a heated electrospray ionization (HESI II) source
(Thermo Scientific). Source and capillary temperatures were 300 °C, the sheath gas flow rate was 25 units, the aux gas flow rate was 15 units, the sweep gas flow rate was 5 units, the spray
voltage was |3.5 kV| for both positive and negative modes, and the S-lens RF was 90.0 units. MS was operated in a polarity switching mode, with alternating positive and negative full-scan MS
and MS2 (top 2). Full-scan MS were acquired at 17,500 resolution (at 200 _m_/_z_) with 1 × 10⁶ AGC target, max ion accumulation time of 100 ms and a scan range of 200–1,600 _m_/_z_. MS2
scans were acquired at 17,500 resolution (at 200 _m_/_z_) with 1 × 10⁵ AGC target, max ion accumulation time of 50 ms, 1.0 _m_/_z_ isolation window, stepped NCE at 20, 30 and 40, and 10.0 s
dynamic exclusion. LC–MS files for lipidomics were processed using Compound Discoverer 3.1 (Thermo Scientific) and LipiDex74. All peaks with a 1.4–23 min retention time and 100–5,000 Da MS1
precursor mass were aggregated into compound groups using a 10 ppm mass tolerance and 0.4 min retention time tolerance. Peaks were excluded if peak intensity was less than 2 × 10⁶, peak
width was greater than 0.75 min, signal-to-noise ratio was less than 1.5 or intensity was <3-fold greater than the blank. MS2 spectra were searched against an in silico generated spectral
library75. Spectra matches with a dot product score >500 and reverse dot product score >700 were retained for further analysis. Lipid MS/MS spectra that contained <75% interference
from co-eluting isobaric lipids, eluted within a 3.5 median absolute retention time deviation of each other and were found within at least four processed files were used for identification
at the individual fatty acid substituent levels of structural resolution. If individual fatty acid substituents were unresolved, then identifications were made with the sum of the fatty acid
substituents. Lipid identifications were filtered with our in-house developed Degreaser module within LipidDex2 (v0.1.0)76, based on retention time modelling. The retention time tolerance
used was 0.5 min. Unreliable identifications were discarded. Further filtering based on instrument quality control (QC) coefficient variance was carried out and only features with below 30%
QC coefficient variance were kept for further analysis. FOLLOW-UP LIPIDOMICS EXPERIMENTS Lipids from cell pellets in follow-up experiments were extracted using MTBE (Sigma-Aldrich). Frozen
cell pellets were resuspended in 225 µl 100% LC-grade methanol (Fisher), containing 1 µM CoQ8 (Avanti Lipids) as an internal standard. Glass beads (100 µl, 0.5 mm; BioSpec) were then added
and the samples were vortexed using a Vortex Genie for 10 min (3,000 rpm, 4 °C) to lyse the cells. Next, 187.5 µl of water and 750 µl of MTBE were added to each sample and the tubes were
vortexed again for 3 min (3,000 rpm, 4 °C). To separate the layers, the samples were centrifuged for 3 min (1,000_g_, 4 °C). The organic (top) layer was removed into a separate
microcentrifuge tube and a new 750 µl of MTBE was added. Organic extraction was repeated a second time with the second MTBE layer added to the first. Samples were dried by vacuum
centrifugation and resuspended in 50 µl of 20 mM ammonium acetate in 78% (v/v) methanol, 20% IPA (Sigma-Aldrich) and 2% water. LC instrumentation and separation conditions were identical to
those used for the multiomic screen. MS acquisition was performed by a Thermo Exploris 240 Orbitrap mass spectrometer. Samples were ionized by a HESI II source (Thermo Scientific) kept at a
vaporizer temperature of 350 °C. The sheath gas was set to 50 units, auxiliary gas to 8 units and sweep gas to 1 unit. For untargeted discovery lipidomics, the MS was operated in polarity
switching mode with the spray voltage set to 3,500 V for positive mode and 2,500 V for negative mode. The inlet ion transfer tube temperature was kept at 325 °C with 70% RF lens. Full MS1
scans were acquired at 22,500 resolution (at 200 _m_/_z_), a max ion accumulation time of 100 ms and with a scan range of _m_/_z_ 200–1,600. MS2 scans (top 3) were acquired at 30,000
resolution (at 200 _m_/_z_), max ion accumulation time of 50 ms, a 1.0 _m_/_z_ isolation window, stepped NCE at 20, 30 and 40, and a 10.0 s dynamic exclusion. Automatic gain control (AGC)
targets were set to standard mode for both MS1 and MS2 acquisitions. Raw files were analysed as described above for the multiomic screen, apart from requiring the identified lipids to be
found in at least four processed files and removal of the secondary QC coefficient variance filter. For targeted analyses, chromatography and mass spectrometer conditions were the same as
untargeted analyses, except runs for quantification were acquired in only full MS1 scans in either positive or negative mode depending on the target. List of targeted compounds, polarity,
targeted _m_/_z_ and retention times are given in Supplementary Table 6. Compound identification was first validated using previously published MS2 fragmentation patterns77 and/or analytical
standards (Avanti Lipids). Peak integration was performed on MS1 peaks that had at least >10 measurements across peak width using Tracefinder 5.1 (Thermo Scientific). For all analyses,
the peak area was then normalized to the area of the CoQ8 internal standard. METABOLOMICS LC–MS DATA ACQUISITION AND ANALYSIS FOR MULTIOMIC SCREEN Polar metabolites were separated on a
Sequant ZIC-pHILIC HPLC column (100 mm × 2.1 mm × 5 µm particle size) at 50 °C using the following gradient: 95% mobile phase B from 0–2 min, decreased to 30% B over the next 16 min, held at
30% B for 8 min, then increased to 95% B over the next 1 min, then held at 95% B for the next 8 min. The flow rate was 130 µl per min. For each analysis, 2 µl per sample was loaded onto the
column. Mobile phase A consisted of 10 mM ammonium acetate in 10% (v/v) ACN and 90% (v/v) water with 0.1% (v/v) ammonium hydroxide (Sigma-Aldrich). Mobile phase B consisted of 10 mM
ammonium acetate in 95 (v/v) ACN and 5% (v/v) water with 0.1% ammonium hydroxide. The LC system (Vanquish Binary Pump, Thermo Scientific) was coupled to a Q-Exactive HF Orbitrap mass
spectrometer through a HESI II source (Thermo Scientific). Source and capillary temperatures were 350 °C, the sheath gas flow rate was 45 units, the aux gas flow rate was 15 units, sweep gas
flow rate was 1 units, spray voltage was 3.0 kV for both positive and negative modes and the S-lens RF was 50.0 units. The MS was operated in a polarity switching mode, with alternating
positive and negative full-scan MS and MS2 (top 10). Full-scan MS were acquired at 60,000 resolution (at 200 _m_/_z_) with a 1 × 10⁶ AGC target, max ion accumulation time of 100 ms and a
scan range of 70–900 _m_/_z_. MS2 scans were acquired at 45,000 resolution (at 200 _m_/_z_) with 1 × 10⁵ AGC target, max ion accumulation time of 100 ms, 1.0 _m_/_z_ isolation window,
stepped NCE at 20, 30 and 40, and a 30.0 s dynamic exclusion. LC–MS files for metabolomics were processed using Compound Discoverer 3.3 (Thermo Scientific) in a discovery mode workflow. All
peaks between 0 and 22 min retention time and 0–5,000 Da MS1 precursor mass were grouped into distinct chromatographic profiles (that is, compound groups) and aligned against the reference
file (the QC file running in the middle of all the files). Profiles not reaching a minimum peak intensity of 5 × 10⁴, a maximum peak width of 3 min, a signal-to-noise ratio of 1.5 and a
fivefold intensity increase over blanks were excluded from further processing. Profiles having fewer than five points across the peak were also excluded. Element compositions were predicted
with 5 ppm mass tolerance based on MS1 precursor mass. Precursors were matched to compounds by searching against databases including Biocyc, Human metabolome database and Kyoto Encyclopedia
of Genes and Genomes. MS/MS spectra were searched against mzCloud (Thermo Scientific) containing 19,503 unique molecular compositions, mzVault libraries including in-house curated MS2
spectra of 151 standards, 598 polar compounds from Bamba lab, the Fiehn lab HILIC library of 3,061 entries, the KI-GIAR zic HILIC library of 814 entries and six other libraries from MassBank
of North America. The resulting features were filtered based on the peak quality rating and only the features that had a peak rating greater than 4.0 (on a scale of 0–10) in at least 20
samples were kept for further analysis. Compound annotation was done manually by examining the formula composition, MS2 spectrum and retention time similarities to library entries. Only
features with instrument QC coefficient variance below 30% were kept for further analysis. MULTIOMIC DATA INTEGRATION AND VISUALIZATION All data analysis and visualizations were generated
using Python (v3.9). Principal component analysis was performed using the sklearn Python module with the default settings. Hierarchical clustering was calculated using the seaborn Python
module set to the Euclidean distance and _z_-transformed. Gene Ontology term enrichment was calculated using the ShinyGO 0.80 web interface with a false discovery rate cutoff of 0.05 (ref.
78). To label mitochondrial protein volcano plots and perform enrichment tests, yeast proteins were deemed mitochondrial if they were present in the high-confidence yeast mitochondrial
proteome79. Human proteins were deemed mitochondrial if present in MitoCarta 3.0 (ref. 80). Proteins were classified as up- or downregulated if the absolute value of the fold change was
>0.7 and the _P_ was <0.05. Enrichment was determined by a Fisher exact test. Correlation analysis was performed using all FCs for each molecule under all experiment conditions. To
determine the correlation score for a set of molecules, the Spearman correlation coefficient was calculated for every individual pairwise comparison between the molecules within that set and
all others. Each molecule was then rank ordered based on the correlation coefficient and the correlation score was determined by taking the average rank for each molecule. To train the
support vector machine (SVM) model for the respiration deficient (RD) response, data and classifications of RD and respiration competent strains were compiled from previous work26. Only
overlapping measurements from both datasets were considered for training. SVM was generated using the sklearn module from Python (kernel='rbf', probability=True, gamma=.03) with
70% of the data used for training and 30% withhold for testing. SVM model was deemed to accurately predict RD strains on the test set (accuracy: 0.98; precision: 0.90; recall: 1.0). SVM was
then used to predict probability of RD in indicated strains from the current multiomic dataset. MTDNA MEASUREMENT Yeast were cultured and collected using conditions described in ‘Yeast
strain generation and culture conditions’ section. Total DNA (genomic and mitochondrial) was extracted using previously described methods27, then diluted to 100 ng µl−1. Quantitative PCR
(qPCR) was performed using the following reaction: 10 µl Power SYBR Green PCR Master Mix (Thermo), 1 µl DNA and 250 nM forward and reverse primers. Previously documented mtDNA and genomic
DNA targeting primers were used81. For the qPCR cycle, an initial 2 min incubation at 50 °C was followed by 2 min denaturing at 95 °C. Then, 40 cycles of 95 °C for 15 s, 60 °C for 15 s and
72 °C for 1 min were performed. qPCR data were collected using QuantStudio Real-Time PCR software v1.2 (Applied Biosciences). mtDNA abundance was calculated using the ∆∆_Ct_ method and the
relative level of mtDNA abundance was calculated and normalized to the expression level of actin82. The primers for qPCR are listed in Supplementary Table 7. _PLN1_ MRNA MEASUREMENT USING
QPCR Yeast were cultured and collected using the conditions described in ‘Yeast strain generation and culture conditions’ section. Total RNA was extracted using the Mastepure Yeast RNA
Purification kit (Lucigen), according to the manufacturer’s protocols. Then, 2 µg of RNA was converted into cDNA using the SuperScript III kit (Thermo Scientific) with the random hexamer
primers and standard reverse transcription reaction conditions. qPCR was performed using the following reaction: 10 µl Power SYBR Green PCR Master Mix (Thermo), 1 µl of a 1:20 dilution of
cDNA and 250 nM forward and reverse primers. For the qPCR cycle, an initial 2 min incubation at 50 °C was followed by 2 min denaturing at 95 °C. Then, 40 cycles of 95 °C for 15 s, 60 °C for
15 s and 72 °C for 1 min were performed. qPCR data were collected using QuantStudio Real-Time PCR software v1.2 (Applied Biosciences). _PLN1_ abundance was calculated using the ∆∆_Ct_ method
and normalized to the expression level of actin. The primers for qPCR are listed in Supplementary Table 7. OCR MEASUREMENT The oxygen consumption rate (OCR) was measured using the
MitoXpress Xtra Oxygen Consumption Assay kit (Agilent), according to the manufacturer’s protocols. In brief, yeast were cultured as described in ‘Yeast strain generation and culture
conditions’ section. Then, 5 × 10⁵ cells were transferred into a clear, 96-well plate (Thermo) and the volume was adjusted to 100 µl. Next, 10 µl of MitoXpress Xtra probe was added to each
well and the liquid was topped with four drops of mineral oil. Changes in fluorescence intensity were measured using a Cytation 3 plate reader (BioTek, 30 °C, 1,140 rpm, excitation: 380 nm
and emission: 650 nm) over a 120 min period. The OCR was calculated using Gen5 v3.02.2 software (BioTek) measuring the ∆relative fluorescent units (RFU) over the linear time frame for each
sample. FLUORESCENCE MICROSCOPY For imaging neutral lipids inside lipid droplets, cells were first grown as described in ‘Yeast strain generation and culture conditions’ section. Then, 1 ×
108 cells were pelleted by centrifugation (3,000_g_, 5 min) and washed twice with 1 ml of 1× DPBS solution (Gibco). Cells were then incubated in DPBS containing 2 µM BODIPY 493/503 (Thermo)
for 15 min at 30 °C. Cells were then centrifuged (3,000_g_, 5 min) and washed twice in 1× DPBS before imaging. Samples were mounted on Superfrost Plus slides (Fisher) with Fluoromount-G
(SouthernBiotech). Yeast were imaged on a Zeiss LSM 880 II Airyscan FAST confocal microscope using a 100× objective. Fluorescent and differential interference contrast czi images were
processed using ImageJ software (v2.9.0/1.53t) NILE RED FLUORESCENCE The Nile red staining protocol was adapted from previously described methods83. Cells were grown as described in ‘Yeast
strain generation and culture conditions’ section. First, 2 × 10⁷ cells were pelleted by centrifugation (500_g_, 2 min) and washed twice with 1 ml of 1× DPBS solution (Gibco). The pellet was
resuspended in 1 ml of DPBS and 250 µl was transferred into a black 96-well clear-bottom plate (Thermo), along with 25 µl of 50% (v/v) DMSO and 50% (v/v) DPBS. Finally, 25 µl of 60 µg ml−1
Nile red stain (Sigma-Aldrich) in acetone was added to each well. The RFU was measured rapidly using a Cytation 3 plate reader (BioTek, 30 °C, 1,140 rpm, excitation: 485 nm, emission: 535
nm, automatic gain) for a 10 min period. RFU values were calculated using Gen5 v3.02.2 software (BioTek) by averaging the fluorescent signal intensity over the 10 min time frame and
subtracting background wells where 250 µl of DPBS was substituted for sample. IMAGING MITOCHONDRIAL VOLUME DENSITY _S._ _cerevisiae_ diploid yeast expressing six fluorescently labelled,
organelle-specific proteins (Supplementary Table 8) were used for imaging. The diploid strain was generated by mating two parental WT W303 haploid strains (EY2795 and EY2796) engineered to
express three fluorescent organelle-specific marker proteins, using standard mating protocols. Imaging was performed using a Nikon Ti2 microscope equipped with laser scanning A1-HD25
confocal scan head, a LUN4 4-line solid state laser illumination system and an A1-DUS spectral detector. Organelle images were captured in _z_-stacks (step size of 0.2 µm) with hyperspectral
confocal microscopy at four different optical configurations each with a laser power of 5% (Supplementary Table 9). The spectral detector was set to have a resolution of 6.0 nm per bin. To
distinguish overlapping fluorescence emission spectra, red and cyan fluorescent protein (CFP) channels were subject to linear unmixing using the in-built Nikon Elements software to acquire
single channel _z_-stacks for the two organelles captured in each channel. Organelles were segmented by inputting corresponding single channel _z_-stacks into the interactive machine
learning tool ilastik (v.1.3.3)84. Using the ilastik pixel classification workflow, organelle and background classes were determined by user-defined, hand-drawn labels for each class.
Ilastik then assigned each pixel a probability of belonging to either class. Using a threshold of 0.5, the probability map was distinguished into background and organelle, giving a binary
image. To segment cells, an average intensity _z_-projection of the endoplasmic reticulum binary ilastik images was taken using ImageJ85 and input into the convolutional neural network YeaZ
(v1.0.3)86. A custom MATLAB code was used to binarize the cell and organelle images and estimate volume fractions. Cell size was estimated by treating cells as prolate ellipsoids. Average
intensity-based cell size measurement was verified to be correlated to a brightfield image-derived cell-size estimate (correlation coefficient of 0.984, _P_ = 1.334 × 10−74). The cell mask
was applied to the organelle images over all _z_-planes and organelles were grouped into objects. To estimate the volume fraction, the pixels of each organelle within a cell were counted and
converted into physical units and then normalized to the estimated cell size. Kernel density estimation was calculated using the seaborn Python module. STATISTICS AND REPRODUCIBILITY All
experiments were performed in at least biological triplicate, unless otherwise stated. No statistical methods were used to predetermine sample sizes but our sample sizes are similar to those
reported in previous publications26,27,87. Data distribution was assumed to be normal, but this was not formally tested. Randomization was used for MS injection to minimize batch effects.
No other randomization was used for experimental groups. Data collection and analysis were not performed blind to the conditions of the experiments. No data were excluded from the analyses.
For all assays, quantification and statistics were derived from _n_ = 3 independent biological replicates unless specified in the legends. All statistical analysis was performed using Excel
or Python. All results are presented as the arithmetic mean ± s.d. _P_ values were calculated using either unpaired, two-sided Student’s _t_-test, or Fisher enrichment tests as specified in
the methods and legends. _P_ values less than 0.05 were considered significant. DATA AND MATERIAL AVAILABILITY All MS data (proteomics, lipidomics and metabolomics) have been deposited in
Massive with the primary accession codes MSV000092267 (multiomic screen) and MSV000095028 (follow-up experiments). Source data are provided with this paper. The following databases were used
in the searching of MS files: Biocyc, Human Metabolome Database, Kyoto Encyclopedia of Genes and Genomes, mzCloud, MassBank, MitoCarta and Uniprot. All other data supporting the findings of
this study are available from the corresponding author on reasonable request. REPORTING SUMMARY Further information on research design is available in the Nature Portfolio Reporting Summary
linked to this article. CODE AVAILABILITY Custom MATLAB code used to binarize cell data is available without restrictions via GitHub (https://github.com/alinearra/CellandOrganelleAnalysis).
REFERENCES * Schlieben, L. D. & Prokisch, H. The dimensions of primary mitochondrial disorders. _Front. Cell Dev. Biol._ 8, 600079 (2020). Article PubMed PubMed Central Google
Scholar * Gorman, G. S. et al. Prevalence of nuclear and mitochondrial DNA mutations related to adult mitochondrial disease. _Ann. Neurol._ 77, 753–759 (2015). Article CAS PubMed PubMed
Central Google Scholar * Wright, R. Mitochondrial dysfunction and Parkinson’s disease. _Nat. Neurosci._ 25, 2 (2022). Article CAS PubMed Google Scholar * Kaus, A. & Sareen, D. ALS
patient stem cells for unveiling disease signatures of motoneuron susceptibility: perspectives on the deadly mitochondria, ER stress and calcium triad. _Front. Cell. Neurosci._ 9, 448
(2015). Article PubMed PubMed Central Google Scholar * Szendroedi, J., Phielix, E. & Roden, M. The role of mitochondria in insulin resistance and type 2 diabetes mellitus. _Nat. Rev.
Endocrinol._ 8, 92–103 (2012). Article CAS Google Scholar * Bano, D., Ehninger, D. & Bagetta, G. Decoding metabolic signatures in Alzheimer’s disease: a mitochondrial perspective.
_Cell Death Discov._ 9, 432 (2023). Article CAS PubMed PubMed Central Google Scholar * Vyas, S., Zaganjor, E. & Haigis, M. C. Mitochondria and cancer. _Cell_ 166, 555–566 (2016).
Article CAS PubMed PubMed Central Google Scholar * Dijk, S. N., Protasoni, M., Elpidorou, M., Kroon, A. M. & Taanman, J.-W. Mitochondria as target to inhibit proliferation and
induce apoptosis of cancer cells: the effects of doxycycline and gemcitabine. _Sci. Rep._ 10, 4363 (2020). Article CAS PubMed PubMed Central Google Scholar * Liao, X., Small, W. C.,
Srere, P. A. & Butow, R. A. Intramitochondrial functions regulate nonmitochondrial citrate synthase (CIT2) expression in _Saccharomyces cerevisiae_. _Mol. Cell. Biol._ 11, 38–46 (1991).
CAS PubMed PubMed Central Google Scholar * Liao, X. & Butow, R. A. RTG1 and RTG2: two yeast genes required for a novel path of communication from mitochondria to the nucleus. _Cell_
72, 61–71 (1993). Article CAS PubMed Google Scholar * Kirchman, P. A., Kim, S., Lai, C.-Y. & Jazwinski, S. M. Interorganelle signaling is a determinant of longevity in _Saccharomyces
cerevisiae_. _Genetics_ 152, 179–190 (1999). Article CAS PubMed PubMed Central Google Scholar * Zhao, Q. et al. A mitochondrial specific stress response in mammalian cells. _EMBO J._
21, 4411–4419 (2002). Article CAS PubMed PubMed Central Google Scholar * Haynes, C. M., Petrova, K., Benedetti, C., Yang, Y. & Ron, D. ClpP mediates activation of a mitochondrial
unfolded protein response in _C. elegans_. _Dev. Cell_ 13, 467–480 (2007). Article CAS PubMed Google Scholar * Haynes, C. M., Yang, Y., Blais, S. P., Neubert, T. A. & Ron, D. The
matrix peptide exporter HAF-1 signals a mitochondrial UPR by activating the transcription factor ZC376.7 in _C. elegans_. _Mol. Cell_ 37, 529–540 (2010). Article CAS PubMed PubMed Central
Google Scholar * Nargund, A. M., Fiorese, C. J., Pellegrino, M. W., Deng, P. & Haynes, C. M. Mitochondrial and nuclear accumulation of the transcription factor ATFS-1 promotes OXPHOS
recovery during the UPRmt. _Mol. Cell_ 58, 123–133 (2015). Article CAS PubMed PubMed Central Google Scholar * Smith, U., Smith, D. S. & Yunis, A. A. Chloramphenicol-related changes
in mitochondrial ultrastructure. _J. Cell Sci._ 7, 501–521 (1970). Article CAS PubMed Google Scholar * Moullan, N. et al. Tetracyclines disturb mitochondrial function across eukaryotic
models: a call for caution in biomedical research. _Cell Rep._ 10, 1681–1691 (2015). Article CAS PubMed PubMed Central Google Scholar * Tondera, D. et al. SLP‐2 is required for
stress‐induced mitochondrial hyperfusion. _EMBO J._ 28, 1589–1600 (2009). Article CAS PubMed PubMed Central Google Scholar * Gomes, L. C., Benedetto, G. D. & Scorrano, L. During
autophagy mitochondria elongate, are spared from degradation and sustain cell viability. _Nat. Cell Biol._ 13, 589–598 (2011). Article CAS PubMed PubMed Central Google Scholar * Wrobel,
L. et al. Mistargeted mitochondrial proteins activate a proteostatic response in the cytosol. _Nature_ 524, 485–488 (2015). Article CAS PubMed Google Scholar * Wang, X. & Chen, X.
J. A cytosolic network suppressing mitochondria-mediated proteostatic stress and cell death. _Nature_ 524, 481–484 (2015). Article CAS PubMed PubMed Central Google Scholar * Münch, C.
& Harper, J. W. Mitochondrial unfolded protein response controls matrix pre-RNA processing and translation. _Nature_ 534, 710–713 (2016). Article PubMed PubMed Central Google Scholar
* Sutandy, F. X. R., Gößner, I., Tascher, G. & Münch, C. A cytosolic surveillance mechanism activates the mitochondrial UPR. _Nature_ 618, 849–854 (2023). Article CAS PubMed PubMed
Central Google Scholar * Kim, H.-E. et al. Lipid biosynthesis coordinates a mitochondrial-to-cytosolic stress response. _Cell_ 166, 1539–1552.e16 (2016). Article CAS PubMed PubMed
Central Google Scholar * Gao, A. W. et al. Multi-omics analysis identifies essential regulators of mitochondrial stress response in two wild-type _C. elegans_ strains. _Iscience_ 25,
103734 (2022). Article CAS PubMed PubMed Central Google Scholar * Stefely, J. A. et al. Mitochondrial protein functions elucidated by multi-omic mass spectrometry profiling. _Nat.
Biotechnol._ 34, 1191–1197 (2016). Article CAS PubMed PubMed Central Google Scholar * Veling, M. T. et al. Multi-omic mitoprotease profiling defines a role for Oct1p in coenzyme Q
production. _Mol. Cell_ 68, 970–977.e11 (2017). Article CAS PubMed PubMed Central Google Scholar * Rensvold, J. W. et al. Defining mitochondrial protein functions through deep multiomic
profiling. _Nature_ 606, 382–388 (2022). Article CAS PubMed PubMed Central Google Scholar * Yaffe, M. P., Ohta, S. & Schatz, G. A yeast mutant temperature-sensitive for
mitochondrial assembly is deficient in a mitochondrial protease activity that cleaves imported precursor polypeptides. _EMBO J._ 4, 2069–2074 (1985). Article CAS PubMed PubMed Central
Google Scholar * Nakai, T., Yasuhara, T., Fujiki, Y. & Ohashi, A. Multiple genes, including a member of the AAA family, are essential for degradation of unassembled subunit 2 of
cytochrome c oxidase in yeast mitochondria. _Mol. Cell. Biol._ 15, 4441–4452 (1995). Article CAS PubMed PubMed Central Google Scholar * Schmitt, M., Neupert, W. & Langer, T. The
molecular chaperone Hsp78 confers compartment-specific thermotolerance to mitochondria. _J. Cell Biol._ 134, 1375–1386 (1996). Article CAS PubMed Google Scholar * Vestweber, D. &
Schatz, G. Point mutations destabilizing a precursor protein enhance its post‐translational import into mitochondria. _EMBO J._ 7, 1147–1151 (1988). Article CAS PubMed PubMed Central
Google Scholar * De Silva, D., Fontanesi, F. & Barrientos, A. The DEAD box protein Mrh4 functions in the assembly of the mitochondrial large ribosomal subunit. _Cell Metab._ 18, 712–725
(2013). Article PubMed Google Scholar * Guedes‐Monteiro, R. F. et al. Mitochondrial ribosome bL34 mutants present diminished translation of cytochrome c oxidase subunits. _Cell Biol.
Int._ 42, 630–642 (2018). Article PubMed Google Scholar * Teyssier, E. et al. Temperature‐sensitive mutation in yeast mitochondrial ribosome recycling factor (RRF). _Nucleic Acids Res._
31, 4218–4226 (2003). Article CAS PubMed PubMed Central Google Scholar * Höhfeld, J. & Hartl, F. U. Role of the chaperonin cofactor Hsp10 in protein folding and sorting in yeast
mitochondria. _J. Cell Biol._ 126, 305–315 (1994). Article PubMed Google Scholar * Gambill, B. D. et al. A dual role for mitochondrial heat shock protein 70 in membrane translocation of
preproteins. _J. Cell Biol._ 123, 109–117 (1993). Article CAS PubMed Google Scholar * Zhu, Y. et al. Mass spectrometry-based multi-omics integration with a single set of _C. elegans_
samples. _Anal. Chem._ 95, 10930–10938 (2023). Article CAS PubMed PubMed Central Google Scholar * Schlame, M., Ren, M., Xu, Y., Greenberg, M. L. & Haller, I. Molecular symmetry in
mitochondrial cardiolipins. _Chem. Phys. Lipids_ 138, 38–49 (2005). Article CAS PubMed Google Scholar * Joshi, A., Richard, T. H. & Gohil, V. M. Mitochondrial phospholipid metabolism
in health and disease. _J. Cell Sci._ 136, jcs260857 (2023). Article CAS PubMed PubMed Central Google Scholar * Jiang, F., Rizavi, H. S. & Greenberg, M. L. Cardiolipin is not
essential for the growth of _Saccharomyces cerevisiae_ on fermentable or non‐fermentable carbon sources. _Mol. Microbiol._ 26, 481–491 (1997). Article CAS PubMed Google Scholar * Zhong,
Q., Gohil, V. M., Ma, L. & Greenberg, M. L. Absence of cardiolipin results in temperature sensitivity, respiratory defects, and mitochondrial DNA instability independent of pet56. _J.
Biol. Chem._ 279, 32294–32300 (2004). Article CAS PubMed Google Scholar * Wang, S. & Mukherji, S. Uncovering the principles coordinating systems-level organelle biogenesis with
cellular growth. Preprint at _bioRxiv_ https://doi.org/10.1101/2022.11.01.514705 (2022). * Gao, Q. et al. Pet10p is a yeast perilipin that stabilizes lipid droplets and promotes their
assembly. _J. Cell Biol._ 216, 3199–3217 (2017). Article CAS PubMed PubMed Central Google Scholar * Kurat, C. F. et al. Obese yeast: triglyceride lipolysis is functionally conserved
from mammals to yeast. _J. Biol. Chem._ 281, 491–500 (2006). Article CAS PubMed Google Scholar * Rajakumari, S. & Daum, G. Janus-faced enzymes yeast Tgl3p and Tgl5p catalyze lipase
and acyltransferase reactions. _Mol. Biol. Cell_ 21, 501–510 (2010). Article CAS PubMed PubMed Central Google Scholar * Rajakumari, S. & Daum, G. Multiple functions as lipase,
steryl ester hydrolase, phospholipase, and acyltransferase of Tgl4p from the yeast _Saccharomyces cerevisiae_. _J. Biol. Chem._ 285, 15769–15776 (2010). Article CAS PubMed PubMed Central
Google Scholar * van Zutphen, T. et al. Lipid droplet autophagy in the yeast _Saccharomyces cerevisiae_. _Mol. Biol. Cell_ 25, 290–301 (2014). Article PubMed PubMed Central Google
Scholar * Álvarez-Guerra, I. et al. LDO proteins and Vac8 form a vacuole–lipid droplet contact site to enable starvation-induced lipophagy in yeast. _Dev. Cell_ 59, 759–775.e5 (2024).
Article PubMed Google Scholar * Seo, A. Y. et al. AMPK and vacuole-associated Atg14p orchestrate μ-lipophagy for energy production and long-term survival under glucose starvation. _eLife_
6, e21690 (2017). Article PubMed PubMed Central Google Scholar * Nishimura, T. & Tooze, S. A. Emerging roles of ATG proteins and membrane lipids in autophagosome formation. _Cell
Discov._ 6, 32 (2020). Article CAS PubMed PubMed Central Google Scholar * Nissanka, N. & Moraes, C. T. Mitochondrial DNA heteroplasmy in disease and targeted nuclease‐based
therapeutic approaches. _EMBO Rep._ 21, e49612 (2020). Article CAS PubMed PubMed Central Google Scholar * Clarke, C. et al. Mitochondrial respiratory chain disease discrimination by
retrospective cohort analysis of blood metabolites. _Mol. Genet. Metab._ 110, 145–152 (2013). Article CAS PubMed Google Scholar * Moschandrea, C. et al. Mitochondrial dysfunction
abrogates dietary lipid processing in enterocytes. _Nature_ 625, 385–392 (2024). Article CAS PubMed Google Scholar * Hlynialuk, C. J. et al. The mitochondrial metallochaperone SCO1 is
required to sustain expression of the high-affinity copper transporter CTR1 and preserve copper homeostasis. _Cell Rep._ 10, 933–943 (2015). Article CAS PubMed Google Scholar * Diaz, F.
et al. Pathophysiology and fate of hepatocytes in a mouse model of mitochondrial hepatopathies. _Gut_ 57, 232 (2008). Article CAS PubMed Google Scholar * Vankoningsloo, S. et al.
Mitochondrial dysfunction induces triglyceride accumulation in 3T3-L1 cells: role of fatty acid β-oxidation and glucose. _J. Lipid Res._ 46, 1133–1149 (2005). Article CAS PubMed Google
Scholar * Vankoningsloo, S. et al. CREB activation induced by mitochondrial dysfunction triggers triglyceride accumulation in 3T3-L1 preadipocytes. _J. Cell Sci._ 119, 1266–1282 (2006).
Article CAS PubMed Google Scholar * He, Q., Wang, M., Petucci, C., Gardell, S. J. & Han, X. Rotenone induces reductive stress and triacylglycerol deposition in C2C12 cells. _Int J.
Biochem. Cell Biol._ 45, 2749–2755 (2013). Article CAS PubMed Google Scholar * Rambold, A. S., Cohen, S. & Lippincott-Schwartz, J. Fatty acid trafficking in starved cells: regulation
by lipid droplet lipolysis, autophagy, and mitochondrial fusion dynamics. _Dev. Cell_ 32, 678–692 (2015). Article CAS PubMed PubMed Central Google Scholar * Dupont, N. et al. Neutral
lipid stores and lipase PNPLA5 contribute to autophagosome biogenesis. _Curr. Biol._ 24, 609–620 (2014). Article CAS PubMed PubMed Central Google Scholar * Griseti, E. et al. Molecular
mechanisms of perilipin protein function in lipid droplet metabolism. _FEBS Lett._ https://doi.org/10.1002/1873-3468.14792 (2024). * Pu, J. et al. Interactomic study on interaction between
lipid droplets and mitochondria. _Protein Cell_ 2, 487–496 (2011). Article CAS PubMed PubMed Central Google Scholar * Taivassalo, T. et al. Endurance training and detraining in
mitochondrial myopathies due to single large-scale mtDNA deletions. _Brain_ 129, 3391–3401 (2006). Article PubMed Google Scholar * Lightowlers, R. N., Taylor, R. W. & Turnbull, D. M.
Mutations causing mitochondrial disease: what is new and what challenges remain? _Science_ 349, 1494–1499 (2015). Article CAS PubMed Google Scholar * Kim, D. et al. SIRT1 deacetylase
protects against neurodegeneration in models for Alzheimer’s disease and amyotrophic lateral sclerosis. _EMBO J._ 26, 3169–3179 (2007). Article CAS PubMed PubMed Central Google Scholar
* Tsunemi, T. et al. PGC-1α rescues Huntington’s disease proteotoxicity by preventing oxidative stress and promoting TFEB function. _Sci. Transl. Med._ 4, 142ra97 (2012). Article PubMed
PubMed Central Google Scholar * Sainero-Alcolado, L., Liaño-Pons, J., Ruiz-Pérez, M. V. & Arsenian-Henriksson, M. Targeting mitochondrial metabolism for precision medicine in cancer.
_Cell Death Differ._ 29, 1304–1317 (2022). Article CAS PubMed PubMed Central Google Scholar * Longtine, M. S. et al. Additional modules for versatile and economical PCR‐based gene
deletion and modification in _Saccharomyces cerevisiae_. _Yeast_ 14, 953–961 (1998). Article CAS PubMed Google Scholar * Wach, A., Brachat, A., Alberti‐Segui, C., Rebischung, C. &
Philippsen, P. Heterologous HIS3 marker and GFP reporter modules for PCR‐targeting in _Saccharomyces cerevisiae_. _Yeast_ 13, 1065–1075 (1997). Article CAS PubMed Google Scholar *
Generoso, W. C., Gottardi, M., Oreb, M. & Boles, E. Simplified CRISPR–Cas genome editing for _Saccharomyces cerevisiae_. _J. Microbiol Methods_ 127, 203–205 (2016). Article CAS PubMed
Google Scholar * Voth, W. P., Richards, J. D., Shaw, J. M. & Stillman, D. J. Yeast vectors for integration at the HO locus. _Nucleic Acids Res._ 29, e59–e59 (2001). Article CAS
PubMed PubMed Central Google Scholar * Shishkova, E., Hebert, A. S., Westphall, M. S. & Coon, J. J. Ultra-high pressure (>30,000 psi) packing of capillary columns enhancing depth
of shotgun proteomic analyses. _Anal. Chem._ 90, 11503–11508 (2018). Article CAS PubMed PubMed Central Google Scholar * Hutchins, P. D., Russell, J. D. & Coon, J. J. LipiDex: an
integrated software package for high-confidence lipid identification. _Cell Syst._ 6, 621–625.e5 (2018). Article CAS PubMed PubMed Central Google Scholar * Hutchins, P. D., Russell, J.
D. & Coon, J. J. Mapping lipid fragmentation for tailored mass spectral libraries. _J. Am. Soc. Mass. Spectrom._ 30, 659–668 (2019). Article CAS PubMed PubMed Central Google Scholar
* Anderson, B. J., Brademan, D. R., He, Y., Overmyer, K. A. & Coon, J. J. LipiDex 2 integrates MSn tree-based fragmentation methods and quality control modules to improve discovery
lipidomics. _Anal. Chem._ 96, 6715–6723 (2024). Article CAS PubMed Google Scholar * Pi, J., Wu, X. & Feng, Y. Fragmentation patterns of five types of phospholipids by
ultra-high-performance liquid chromatography electrospray ionization quadrupole time-of-flight tandem mass spectrometry. _Anal. Methods_ 8, 1319–1332 (2016). Article CAS Google Scholar *
Ge, S. X., Jung, D. & Yao, R. ShinyGO: a graphical enrichment tool for animals and plants. _Bioinformatics_ 36, 2628–2629 (2019). Article PubMed Central Google Scholar * Morgenstern,
M. et al. Definition of a high-confidence mitochondrial proteome at quantitative scale. _Cell Rep._ 19, 2836–2852 (2017). Article CAS PubMed PubMed Central Google Scholar * Rath, S. et
al. MitoCarta3.0: an updated mitochondrial proteome now with sub-organelle localization and pathway annotations. _Nucleic Acids Res._ 8, D1541–D1547 (2020). Google Scholar * Bradley, M. C.
et al. COQ11 deletion mitigates respiratory deficiency caused by mutations in the gene encoding the coenzyme Q chaperone protein Coq10. _J. Biol. Chem._ 295, 6023–6042 (2020). Article CAS
PubMed PubMed Central Google Scholar * Gonzalez‐Hunt, C. P. et al. PCR‐based analysis of mitochondrial DNA copy number, mitochondrial DNA damage, and nuclear DNA damage. _Curr. Protoc.
Toxicol._ 67, 20.11.1–20.11.25 (2016). Article PubMed Google Scholar * Rostron, K. A. & Lawrence, C. L. Histochemistry of single molecules, methods and protocols. _Methods Mol. Biol._
1560, 219–229 (2017). Article CAS PubMed Google Scholar * Berg, S. et al. ilastik: interactive machine learning for (bio)image analysis. _Nat. Methods_ 16, 1226–1232 (2019). Article
CAS PubMed Google Scholar * Schindelin, J. et al. Fiji: an open-source platform for biological-image analysis. _Nat. Methods_ 9, 676–682 (2012). Article CAS PubMed Google Scholar *
Dietler, N. et al. A convolutional neural network segments yeast microscopy images with high accuracy. _Nat. Commun._ 11, 5723 (2020). Article CAS PubMed PubMed Central Google Scholar *
Tai, J. et al. Hem25p is required for mitochondrial IPP transport in fungi. _Nat. Cell Biol._ 25, 1616–1624 (2023). Article CAS PubMed PubMed Central Google Scholar Download references
ACKNOWLEDGEMENTS We thank the Pagliarini Laboratory for their feedback and discussion throughout the duration of this study. This work was supported by National Institutes of Health awards
R35GM131795 (to D.J.P.), R35GM118119 and P41GM208538 (to J.J.C.), R35GM127009 (to E.A.C) and R35GM142704 (to S.M.), as well as funds from the BJC Investigator Program (to D.J.P.). D.J.P. is
an investigator of the Howard Hughes Medical Institute. This article is subject to HHMI’s Open Access to Publications policy. HHMI lab heads have previously granted a nonexclusive CC BY 4.0
license to the public and a sublicensable license to HHMI in their research articles. Pursuant to those licenses, the author-accepted manuscript of this article can be made freely available
under a CC BY 4.0 license immediately upon publication. AUTHOR INFORMATION AUTHORS AND AFFILIATIONS * Department of Cell Biology and Physiology, Washington University School of Medicine, St.
Louis, MO, USA Zakery N. Baker, Rachel M. Guerra, Andrew J. Smith & David J. Pagliarini * Department of Chemistry, University of Wisconsin–Madison, Madison, WI, USA Yunyun Zhu, Lia R.
Serrano, Katherine A. Overmyer & Joshua J. Coon * National Center for Quantitative Biology of Complex Systems, Madison, WI, USA Yunyun Zhu, Lia R. Serrano, Katherine A. Overmyer &
Joshua J. Coon * Department of Physics, Washington University, St. Louis, MO, USA Aline Arra & Shankar Mukherji * Morgridge Institute for Research, Madison, WI, USA Katherine A. Overmyer
& Joshua J. Coon * Department of Biochemistry, University of Wisconsin–Madison, Madison, WI, USA Elizabeth A. Craig * Department of Biomolecular Chemistry, University of
Wisconsin–Madison, Madison, WI, USA Joshua J. Coon * Department of Biochemistry and Molecular Biophysics, Washington University School of Medicine, St. Louis, MO, USA David J. Pagliarini *
Department of Genetics, Washington University School of Medicine, St. Louis, MO, USA David J. Pagliarini * Howard Hughes Medical Institute, Washington University School of Medicine, St.
Louis, MO, USA David J. Pagliarini Authors * Zakery N. Baker View author publications You can also search for this author inPubMed Google Scholar * Yunyun Zhu View author publications You
can also search for this author inPubMed Google Scholar * Rachel M. Guerra View author publications You can also search for this author inPubMed Google Scholar * Andrew J. Smith View author
publications You can also search for this author inPubMed Google Scholar * Aline Arra View author publications You can also search for this author inPubMed Google Scholar * Lia R. Serrano
View author publications You can also search for this author inPubMed Google Scholar * Katherine A. Overmyer View author publications You can also search for this author inPubMed Google
Scholar * Shankar Mukherji View author publications You can also search for this author inPubMed Google Scholar * Elizabeth A. Craig View author publications You can also search for this
author inPubMed Google Scholar * Joshua J. Coon View author publications You can also search for this author inPubMed Google Scholar * David J. Pagliarini View author publications You can
also search for this author inPubMed Google Scholar CONTRIBUTIONS Z.N.B., E.A.C. and D.J.P. conceived of the project and its design. Y.Z., Z.N.B., L.R.S. and K.A.O performed sample
preparation, MS and data analyses for the initial screen. A.A. and S.M. performed volume fraction measurements. Z.N.B., R.M.G., A.J.S., J.J.C. and D.J.P. performed all other experimentation,
MS and data analyses. Z.N.B. and D.J.P. wrote the original draft. All authors contributed to editing and revising of the final manuscript. D.J.P., E.A.C., J.J.C. and S.M. provided
supervision and funding. CORRESPONDING AUTHOR Correspondence to David J. Pagliarini. ETHICS DECLARATIONS COMPETING INTERESTS J.J.C. is a consultant for Thermo Fisher Scientific, 908 Devices,
and Seer. The remaining authors declare no competing interests. PEER REVIEW PEER REVIEW INFORMATION _Nature Cell Biology_ thanks Timothy Garrett and the other, anonymous, reviewer(s) for
their contribution to the peer review of this work. ADDITIONAL INFORMATION PUBLISHER’S NOTE Springer Nature remains neutral with regard to jurisdictional claims in published maps and
institutional affiliations. EXTENDED DATA EXTENDED DATA FIG. 1 A MULTIOMIC MASS SPECTROMETRY SCREEN TO IDENTIFY REQUIREMENTS FOR OVERCOMING MITOCHONDRIAL DISFUNCTION. A-D, Growth assays of
WT and experimental yeast strains used in multiomic screen. Strains were grouped based on growth rate: WT-like growth (Group 1) (A), slight growth defect (Group 2) (B), large growth defect
(Group 3) (C), and unrecoverable growth defect (Group 4, _ssc1_) (D). Growth was measured continuously in a 100 µl culture in YPG media (n = 3) E, log2 transformed lag time calculated for WT
and all experiment strains from growth assays (A-D) (n = 3). F, Principal component analysis (PCA) derived from the normalized abundances of all biomolecules for WT controls and all
experimental strains used in multiomic screen (n = 3). G, Enriched GO-terms for proteins that had significantly decreased abundance (FC < -0.7, _p_ < 0.05, two-sided Student’s t-test)
in combined Group 3 strains (n = 9) compared to the WT (n = 3) at the early time point. Size of ball represents number of proteins containing the respective GO term, color represents the
false discovery rate (FDR), and the bar size represents the fold enrichment of the GO term over the expected frequency. H,I, Number of significantly decreased (FC < -0.7, _p_ < 0.05,
two-sided Student’s t-test) mitochondrial proteins for Group 3 strains at the early time point (n = 9) (H) or increased mitochondrial proteins (FC > 0.7, _p_ < 0.05, two-sided
Student’s t-test) at the later time point (n = 9) (I) as quantified in Fig. 1f, g, with calculated enrichment. J, Oxygen consumption rate (OCR) of WT and Group 3 strains at the early and
later time points. OCR was measured as a change in relative fluorescence over a linear period of either 60-, 90-, or 120-minutes depending on rate of change (n = 3, *P = 0.06, **P =
8.42×10⁻³, ***P = 1.92×10⁻², two-sided Student’s t-test). K, Number of significantly decreased (FC < -0.7, _p_ < 0.05, two-sided Student’s t-test) mitochondrial proteins for the _ssc1_
strain with calculated enrichment (n = 3). L, Probability of respiratory deficiency in WT, _ssc1_, and Group 3 strains at either the early (E) or later (L) time point. Probability was
calculated by a support vector machine model trained on data obtained from a previous large-scale multiomic screen containing both respiratory competent and deficient yeast strains. M,L,
Relative protein abundance of common retrograde response proteins Cit2p (M) and Pdh1p (N) in WT and experimental yeast strains (n = 3). For all experiments error bars are standard deviation,
centre values represent the mean and n= number of independent biological replicates. All enrichments are calculated using a Fisher exact test. Numerical data are available in Source data.
Source data EXTENDED DATA FIG. 2 YEAST STRAINS THAT RECOVER FROM MITOCHONDRIAL STRESS MOBILISE TAG STORES TO FACILITATE CARDIOLIPIN BIOSYNTHESIS. A-D, Relative lipid abundance versus
statistical significance for DOX-treated (A), _rrf1_ (B), _hsp10_ (C), and _ssc1_ (D) yeast strains collected at the early time point. Abundance is given by the log2 transformed fold-change
for each strain compared to the WT. Points are color-coded according to lipid class. (n = 3) E-G, Relative log2 fold change abundance of all quantified TAG species of DOX-treated (E), _rrf1_
(F), or _hsp10_ (G) yeast strains compared to WT. Saturation and length of TAG species is given by the number of double bonds or total number of carbons in the acyl-tails, respectively (n =
3). H, Representative confocal microscopy images of WT and _hsp10_ BODIPY (green) stained yeast strains taken at 60X magnification. Cells were grown for 24 hours in YPG respiratory media.
Scale bar represents 10 µm. I, Relative fluorescent signal from Nile red staining of _hsp10_ and WT yeast strains. Cells were grown for 24 hours in YPG respiratory media (n = 6, **P =
1.40×10⁻⁸, two-sided Student’s t-test). J, Normalized relative abundance of light Triolein (light blue, m + 0) or heavy [13C3]-Triolein (dark blue) in WT cells (from Fig. 2f) pulsed with
[13C1]-oleic acid for one hour (n = 3, ***P = 1.70×10⁻⁶, two-sided Student’s t-test). K, Normalized relative abundance of light 36:2 Phosphatidylethanolamine (PE) (orange, m + 0),
[13C1]-36:2 PE (tan, m + 1), or [13C2]-36:2 PE (beige, m + 2) in WT cells (from Fig. 2f) pulsed with [13C1]-oleic acid for one hour (n = 3, *P = 5.55×10⁻⁶, **P = 1.12×10⁻⁵, two-sided
Student’s t-test). L, Normalized relative abundance of light 36:2 Phosphatidylcholine (PC) (purple, m + 0), [13C1]-36:2 PC (pink, m + 1), or [13C2]-36:2 PC (peach, m + 2) in WT cells (from
Fig. 2f) pulsed with [13C1]-oleic acid for one hour (n = 3, *P = 6.39×10⁻⁵, **P = 1.35×10⁻⁴, two-sided Student’s t-test). M, Normalized relative abundance of light 72:4 Cardiolipin (CL)
(dark red, m + 0), [13C1]-72:4 CL (red, m + 1), [13C2]-72:4 CL (orange, m + 2), [13C3]-72:4 CL (light orange, m + 3), or [13C4]-72:4 CL (light peach, m + 4) in WT cells (from Fig. 2f) pulsed
with [13C1]-oleic acid for one hour (n = 3, *P = 3.39×10⁻⁴, **P = 5.61×10⁻⁵, ***P = 3.85×10⁻⁵, ****P = 3.26×10⁻⁵, two-sided Student’s t-test). N, Relative lipid abundance versus statistical
significance for _crd1_Δ versus WT yeast. Cells were grown for 24 hours in YPG respiratory media (n = 3). Quantified cardiolipin species are colored in red and phosphatidylglycerol species
highlighted in pink. All other lipid species are colored in grey. For all experiments error bars are standard deviation, centre values represent the mean and n= number of independent
biological replicates. Numerical data are available in Source data. Source data EXTENDED DATA FIG. 3 PLN1P HAS A ROLE TAG MOBILIZATION AND RECOVERY FROM MITOCHONDRIAL STRESS. A, Spearman
correlation of log2 transformed Pln1p abundance and all quantified species of triacylglyceride (TAG) from multiomic screen. Saturation and length of TAG species is given by the number of
double bonds or total number of carbons in the acyl-tails respectively. B-C, Relative protein abundance at the early time point of multiomic screen (B) or mRNA (C) abundance of Pln1p in WT
and experimental yeast strains. Red bars indicate Group 3 strains. for C, cells were grown for 24 hours in YPG respiratory media (n = 3, *P = 0.03, **P = 0.02, two-sided Student’s t-test).
D, Relative lipid abundance versus statistical significance for _pln1∆_ yeast overexpressing GPD-_PLN1_ treated with DOX or a DMSO control. Cells were grown for 24 hours in SD (Ura-)
respiratory media. Abundance is given as a log2 transformed fold-change compared the vehicle control. Quantified TAG species are colored in light blue with TAG species that are significantly
changed ( | FC | > 0.7, _p_ < 0.05, two-sided Student’s t-test) highlighted in dark blue. All other lipid species are colored in grey (n = 3). E-F, Full growth assay of WT expressing
the _GPD_-_PLN1_ gene as depicted in Fig. 3n. or an empty vector control. Cells were treated with either DMSO control (E) or DOX (F) (n = 3). Growth was determined in cells grown in YPG +
G418 respiratory media over the course of 24 (E) to 48 (F) hours. For all experiments error bars are standard deviation, centre values represent the mean and n= number of independent
biological replicates. Numerical data are available in Source data. Source data EXTENDED DATA FIG. 4 TRIACYLGLYCERIDE MOBILISATION DURING MITOCHONDRIAL STRESS REQUIRES _TGL_ LIPASES. A-D,
Relative lipid abundance versus statistical significance for _ldo45_Δ_ldo16_Δ (_ldo_ΔΔ_)_ A), _atg14_Δ (B), _atg15_Δ (C), or _atg1_Δ (D) yeast. Cells were grown for 24 hours in YPG
respiratory media. Abundance is given as a log2 transformed fold-change compared to the same strain treated with vehicle control. For (A-D), quantified TAG species are colored in light blue
with TAG species that are significantly changed ( | FC | > 0.7, _p_ < 0.05, two-sided Student’s t-test) highlighted in dark blue. All other lipid species are colored in grey (n = 3).
E, Relative fluorescent signal from Nile red staining of WT, _TGL_ triple deletion (_tgl3_Δ_tgl4_Δ_tgl5_Δ_, tgl_ΔΔΔ), _atg1_Δ, and _atg15_Δ yeast (n = 6, *P = 2.20×10⁻⁴, **P = 2.15×10⁻⁷,
***P = 1.31×10⁻³, n.s.= not significant, two-sided Student’s t-test). Cells were grown for 24 hours in YPG respiratory media and were treated with either DOX or a DMSO vehicle control. For
all experiments error bars are standard deviation, centre values represent the mean and n= number of independent biological replicates. Numerical data are available in Source data. Source
data EXTENDED DATA FIG. 5 TGL-DEPENDENT TRIACYLGLYCERIDE MOBILISATION IS ESSENTIAL FOR YEAST TO OVERCOME MITOCHONDRIAL STRESS. A, Relative lipid abundance versus statistical significance for
_dga1_Δ yeast. Cells were grown for 24 hours in YPG respiratory media. Abundance is given as a log2 transformed fold-change compared to WT cells (n = 3). B, Representative confocal
microscopy images of BODIPY (green) stained WT or _dga1_Δ yeast strains. Images were taken at 100X magnification. Scale bar represents 10 µm. C, Growth assay of WT, _dga1_Δ_, lro1_Δ_,
dga1_Δ_lro1_Δ double deletion, and _dga1_Δ_lro1_Δ_are1_Δ_are2_Δ quadruple deletion (ΔΔΔΔ) yeast treated with DOX. Growth was determined after 24 hours (Time point E) or 48 hours (Time point
L) in YPG respiratory media (n = 3, *P < 0.05, **P < 0.01, n.s.= not significant, two-sided Student’s t-test). D, Relative lipid abundance versus statistical significance for _pox1_Δ
yeast compared to a WT strain (D) or treated with DOX and compared to _pox1_Δ yeast treated with a vehicle (E). Cells were grown for 24 hours in YPG respiratory media (n = 3). For (A), (C),
and (D) quantified TAG species are colored in light blue with TAG species that are significantly changed ( | FC | > 0.7, _p_ < 0.05, two-sided Student’s t-test) highlighted in dark
blue. All other lipid species are colored in grey. F, Relative abundance of mitochondrial DNA (mtDNA) as measured by a ratio of mtDNA to nuclear DNA (nuDNA) for WT or _TGL_ triple deletion
(_tgl3_Δ_tgl4_Δ_tgl5_Δ_, tgl_ΔΔΔ) yeast treated with DOX or vehicle control after 24 hours (Time point E) or 48 hours (Time point L). Cells were grown in YPG respiratory media (n = 3, *P =
0.01, **P = 0.03, two-sided Student’s t-test). G, Normalized abundance of de-novo synthesized [13C3]-Triolein (m + 3) in WT or _TGL_ triple deletion (_tgl3_Δ_tgl4_Δ_tgl5_Δ_, tgl_ΔΔΔ) after 1
hr treatment with 0.0002% [13C1]-oleic acid or vehicle (n = 3). Abundances were normalized to CoQ8 internal standard. H, Growth assay of WT or _TGL_ triple deletion (_tgl3_Δ_tgl4_Δ_tgl5_Δ_,
tgl_ΔΔΔ) yeast treated with 0.0002% [13C1]-oleic acid or vehicle. Growth was determined after 24 hours (Time point E) or 48 hours (Time point L) in YPG respiratory media, (n = 3, *P = 0.03,
**P = 0.02, n.s.= not significant, two-sided Student’s t-test). For all experiments error bars are standard deviation, centre values represent the mean and n= number of independent
biological replicates. Numerical data are available in Source data. Source data EXTENDED DATA FIG. 6 TRIACYLGLYCERIDE MOBILISATION IS REQUIRED FOR MAMMALIAN CELLS TO OVERCOME MITOCHONDRIAL
STRESS. A, Relative protein abundances for WT HAP1 cells grown in galactose media treated with 10 µM DOX collected on Day 2 versus statistical significance. Abundance is given by a log2
transformed fold-change compared to the vehicle treated control with non-mitochondrial proteins (grey), mitochondrial proteins (light orange), OxPhos (dark orange) and mtDNA encoded proteins
(dark brown) highlighted by colour. (n = 3) B, Relative lipid abundance versus statistical significance for WT HAP1 cells grown in galactose, treated with 10 µM DOX DOX for 2 days compared
to a vehicle treated control. Quantified TAG species are colored in light blue with TAG species that are significantly increased (FC > 0.7, _p_ < 0.05, two-sided Student’s t-test) or
decreased (FC < −0.7, _p_ < 0.05, two-sided Student’s t-test) highlighted in dark blue. All other lipid species are colored in grey (n = 3). For all experiments, n= number of
independent biological replicates. Numerical data are available in Source data. Source data SUPPLEMENTARY INFORMATION REPORTING SUMMARY PEER REVIEW FILE SUPPLEMENTARY TABLE Supplementary
Tables 1–10 SOURCE DATA SOURCE DATA FIG. 1 Statistical source data. SOURCE DATA FIG. 2 Statistical source data. SOURCE DATA FIG. 3 Statistical source data. SOURCE DATA FIG. 4 Statistical
source data. SOURCE DATA FIG. 5 Statistical source data. SOURCE DATA FIG. 6 Statistical source data. SOURCE DATA EXTENDED DATA FIG. 1/TABLE 1 Statistical source data. SOURCE DATA EXTENDED
DATA FIG. 2/TABLE 2 Statistical source data. SOURCE DATA EXTENDED DATA FIG. 3/TABLE 3 Statistical source data. SOURCE DATA EXTENDED DATA FIG. 4/TABLE 4 Statistical source data. SOURCE DATA
EXTENDED DATA FIG. 5/TABLE 5 Statistical source data. SOURCE DATA EXTENDED DATA FIG. 6/TABLE 6 Statistical source data. RIGHTS AND PERMISSIONS OPEN ACCESS This article is licensed under a
Creative Commons Attribution 4.0 International License, which permits use, sharing, adaptation, distribution and reproduction in any medium or format, as long as you give appropriate credit
to the original author(s) and the source, provide a link to the Creative Commons licence, and indicate if changes were made. The images or other third party material in this article are
included in the article’s Creative Commons licence, unless indicated otherwise in a credit line to the material. If material is not included in the article’s Creative Commons licence and
your intended use is not permitted by statutory regulation or exceeds the permitted use, you will need to obtain permission directly from the copyright holder. To view a copy of this
licence, visit http://creativecommons.org/licenses/by/4.0/. Reprints and permissions ABOUT THIS ARTICLE CITE THIS ARTICLE Baker, Z.N., Zhu, Y., Guerra, R.M. _et al._ Triacylglycerol
mobilization underpins mitochondrial stress recovery. _Nat Cell Biol_ 27, 298–308 (2025). https://doi.org/10.1038/s41556-024-01586-6 Download citation * Received: 04 June 2024 * Accepted: 26
November 2024 * Published: 08 January 2025 * Issue Date: February 2025 * DOI: https://doi.org/10.1038/s41556-024-01586-6 SHARE THIS ARTICLE Anyone you share the following link with will be
able to read this content: Get shareable link Sorry, a shareable link is not currently available for this article. Copy to clipboard Provided by the Springer Nature SharedIt content-sharing
initiative