Play all audios:
ABSTRACT The Montreal Protocol was designed to protect the stratospheric ozone layer by enabling reductions in the abundance of ozone-depleting substances such as chlorofluorocarbons (CFCs)
in the atmosphere1,2,3. The reduction in the atmospheric concentration of trichlorofluoromethane (CFC-11) has made the second-largest contribution to the decline in the total atmospheric
concentration of ozone-depleting chlorine since the 1990s1. However, CFC-11 still contributes one-quarter of all chlorine reaching the stratosphere, and a timely recovery of the
stratospheric ozone layer depends on a sustained decline in CFC-11 concentrations1. Here we show that the rate of decline of atmospheric CFC-11 concentrations observed at remote measurement
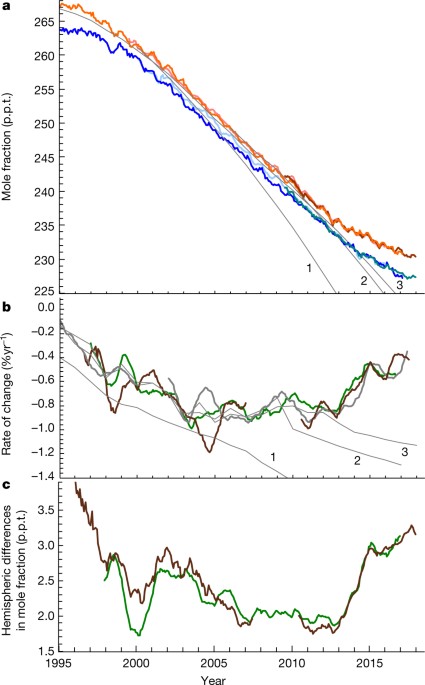
sites was constant from 2002 to 2012, and then slowed by about 50 per cent after 2012. The observed slowdown in the decline of CFC-11 concentration was concurrent with a 50 per cent increase
in the mean concentration difference observed between the Northern and Southern Hemispheres, and also with the emergence of strong correlations at the Mauna Loa Observatory between
concentrations of CFC-11 and other chemicals associated with anthropogenic emissions. A simple model analysis of our findings suggests an increase in CFC-11 emissions of 13 ± 5 gigagrams per
year (25 ± 13 per cent) since 2012, despite reported production being close to zero4 since 2006. Our three-dimensional model simulations confirm the increase in CFC-11 emissions, but
indicate that this increase may have been as much as 50 per cent smaller as a result of changes in stratospheric processes or dynamics. The increase in emission of CFC-11 appears unrelated
to past production; this suggests unreported new production, which is inconsistent with the Montreal Protocol agreement to phase out global CFC production by 2010. Access through your
institution Buy or subscribe This is a preview of subscription content, access via your institution ACCESS OPTIONS Access through your institution Access Nature and 54 other Nature Portfolio
journals Get Nature+, our best-value online-access subscription $32.99 / 30 days cancel any time Learn more Subscribe to this journal Receive 51 print issues and online access $199.00 per
year only $3.90 per issue Learn more Buy this article * Purchase on SpringerLink * Instant access to full article PDF Buy now Prices may be subject to local taxes which are calculated during
checkout ADDITIONAL ACCESS OPTIONS: * Log in * Learn about institutional subscriptions * Read our FAQs * Contact customer support SIMILAR CONTENT BEING VIEWED BY OTHERS GLOBAL INCREASE OF
OZONE-DEPLETING CHLOROFLUOROCARBONS FROM 2010 TO 2020 Article 03 April 2023 A DECLINE IN EMISSIONS OF CFC-11 AND RELATED CHEMICALS FROM EASTERN CHINA Article 10 February 2021 A DECLINE IN
GLOBAL CFC-11 EMISSIONS DURING 2018−2019 Article 10 February 2021 REFERENCES * Carpenter, L. J. et al. in _Scientific Assessment of Ozone Depletion: 2014_. Global Ozone Research and
Monitoring Project—Report No. 55, Ch. 1, 1.1–1.101, (World Meteorological Organization, Geneva, 2014). Google Scholar * Montzka, S. A. et al. Decline in the tropospheric abundance of
halogen from halocarbons: Implications for stratospheric ozone depletion. _Science_ 272, 1318–1322 (1996). Article ADS CAS Google Scholar * Prinn, R. G. et al. A history of chemically
and radiatively important gases in air deduced from ALE/GAGE/AGAGE. _J. Geophys. Res._ 105, 17751–17792 (2000). Article ADS CAS Google Scholar * Ozone Secretariat. _Handbook for the
Montreal Protocol on Substances that Deplete the Ozone Layer_, 9th edn (United Nations Environment Programme, 2012). * Technology and Economic Assessment Panel_. Assessment of Alternatives
to HCFCs and HFCs and Update of the TEAP 2005 Supplement Report Data_. Task Force Decision XX/8 Report (United Nations Environment Programme, Nairobi, 2009). Google Scholar * Daniel, J. et
al. in _Scientific Assessment of Ozone Depletion: 2010_. Global Ozone Research and Monitoring Project—Report No. 52, Ch. 5, 5.1–5.56 (World Meteorological Organization, Geneva, 2011). Google
Scholar * Harris, N. R. P. in et al. _Scientific Assessment of Ozone Depletion: 2014_. Global Ozone Research and Monitoring Project—Report No. 55, Chapter 5, 5.1–5.58 (World Meteorological
Organization, Geneva, 2014). Google Scholar * Montzka, S. A. et al. in _Scientific Assessment of Ozone Depletion: 2010_. Global Ozone Research and Monitoring Project—Report No. 52, Chapter
1, 1.1–1.108 (World Meteorological Organization, Geneva, 2011). Google Scholar * Liang, Q. et al. Constraining the carbon tetrachloride (CCl4) budget using its global trend and
inter-hemispheric gradient. _Geophys. Res. Lett._ 41, 5307–5315 (2014). Article ADS CAS Google Scholar * Lin, M., Horowitz, L. W., Oltmans, S. J., Fiore, A. M. & Fan, S. Tropospheric
ozone trends at Mauna Loa Observatory tied to decadal climate variability. _Nat. Geosci._ 7, 136–143 (2014). Article ADS CAS Google Scholar * Oram, D. E. et al. A growing threat to the
ozone layer from short-lived anthropogenic chlorocarbons. _Atmos. Chem. Phys._ 17, 11929–11941 (2017). Article ADS CAS Google Scholar * Rosenlof, K. R. & Reid, G. C. Trends in the
temperature and water vapor content of the tropical lower stratosphere: Sea surface connection. _J. Geophys. Res._ 113, D06107 (2008). Article ADS Google Scholar * Randel, W. J., Wu, F.,
Vömel, H., Nedoluha, G. E. & Forster, P. Decreases in stratospheric water vapor after 2001: Links to changes in the tropical tropopause and the Brewer-Dobson circulation. _J. Geophys.
Res._ 111, D12312 (2006). Article ADS Google Scholar * Ploeger, F. et al. Variability of stratospheric mean age of air and of the local effects of residual circulation and eddy mixing.
_J. Geophys. Res._ 120, 716–733 (2015). Article Google Scholar * Stiller, G. P. et al. Shift of subtropical transport barriers explains observed hemispheric asymmetry of decadal trends of
age of air. _Atmos. Chem. Phys._ 17, 11177–11192 (2017). Article ADS CAS Google Scholar * Newman, P. A., Coy, L., Pawson, S. & Lait, L. R. The anomalous change in the QBO in
2015–2016. _Geophys. Res. Lett._ 43, 8791–8797 (2016). Article ADS Google Scholar * Chirkov, M. et al. Global HCFC-22 measurements with MIPAS: retrieval, validation, global distribution
and its evolution over 2005–2012. _Atmos. Chem. Phys._ 16, 3345–3368 (2016). Article ADS CAS Google Scholar * Marsh, D. R. et al. Climate change from 1850 to 2005 simulated in
CESM1(WACCM). _J. Clim._ 26, 7372–7391 (2013). Article ADS Google Scholar * Lamarque, J.-F. et al. CAM-chem: description and evaluation of interactive atmospheric chemistry in the
Community Earth System Model. _Geosci. Model Dev._ 5, 369–411 (2012). Article ADS CAS Google Scholar * Rienecker, M. M. et al. MERRA: NASA’s modern-era retrospective analysis for
research and applications. _J. Clim._ 24, 3624–3648 (2011). Article ADS Google Scholar * Boothe, A. C. & Homeyer, C. R. Global large-scale stratosphere-troposphere exchange in modern
reanalyses. _Atmos. Chem. Phys._ 17, 5537–5559 (2017). Article ADS CAS Google Scholar * Ashford, P. et al. in _Safeguarding the Ozone Layer and the Global Climate System: Issues Related
to Hydrofluorocarbons and Perfluorocarbons_ (eds Metz, B. et al.) Ch. 7 (Cambridge Univ. Press, Cambridge, 2005). * Hu, L. et al. Considerable contribution of the Montreal Protocol to
declining greenhouse gas emissions from the United States. _Geophys. Res. Lett._ 44, 8075–8083 (2017). Article ADS CAS Google Scholar * Laube, J. C. et al. Newly detected ozone-depleting
substances in the atmosphere. _Nat. Geosci._ 7, 266–269 (2014). Article ADS CAS Google Scholar * Hossaini, R. et al. The increasing threat to stratospheric ozone from dichloromethane.
_Nat. Commun._ 8, 15962 (2017). Article ADS CAS Google Scholar * Montzka, S. A. et al. in _Scientific Assessment of Ozone Depletion: 2002_. Global Ozone Research and Monitoring
Project—Report No. 47, Ch. 1, 1.1–1.83 (World Meteorological Organization, Geneva, 2003). Google Scholar * Jones, A. R., Thomson, D. J., Hort, M. & Devenish, B. in _Air Pollution
Modeling and its Application_ XVII (eds Borrego C. & Norman A.-L.) Ch. 62, 580–589 (Springer, New York, 2007). * Hall, B. D., Dutton, G. S. & Elkins, J. W. The NOAA nitrous oxide
standard scale for atmospheric observations. _J. Geophys. Res._ 112, D09305 (2007). Article ADS Google Scholar * McCulloch, A., Ashford, P. & Midgley, P. M. Historic emissions of
fluorotrichloromethane (CFC-11) based on a market survey. _Atmos. Environ._ 35, 4387–4397 (2001). Article ADS CAS Google Scholar * Liang, Q., Stolarski, R. S., Douglass, A. R., Newman,
P. A. & Nielsen, J. E. Evaluation of emissions and transport of CFCs using surface observations and their seasonal cycles and the GEOS CCM simulation with emissions-based forcing. _J.
Geophys. Res._ 113, D14302 (2008). Article ADS Google Scholar * Rigby, M. et al. Re-evaluation of the lifetimes of the major CFCs and CH3CCl3 using atmospheric trends. _Atmos. Chem.
Phys._ 13, 2691–2702 (2013). Article ADS Google Scholar * Hamilton, K. & Fan, S.-M. Effects of the stratospheric quasi-biennial oscillation on long-lived greenhouse gases in the
troposphere. _J. Geophys. Res._ 105, 20581–20587 (2000). Article ADS CAS Google Scholar * Simmonds, P. G. et al. Interannual fluctuations in the seasonal cycle of nitrous oxide and
chlorofluorocarbons due to the Brewer-Dobson circulation. _J. Geophys. Res._ 118, 10694–10706 (2013). CAS Google Scholar * Nevison, C. D. et al. Exploring causes of interannual variability
in the seasonal cycles of tropospheric nitrous oxide. _Atmos. Chem. Phys._ 11, 3713–3730 (2011). Article ADS CAS Google Scholar Download references ACKNOWLEDGEMENTS We thank NOAA
station personnel for sample flask collection and on-site instrument operation, maintenance and troubleshooting; and personnel from cooperative institutions involved with flask sampling in
Australia (CSIRO), Canada (AES), Ireland (University of Bristol), Israel (Weizmann Institute) and the United States (University of Colorado, Harvard University, University of Wisconsin, and
the Scripps Institute for Oceanography). We thank the US National Science Foundation for logistics support at Summit (Greenland) and the South Pole; J. Butler, D. Fahey, S. Reimann, P.
Newman and scientists from the Advanced Global Atmospheric Gases Experiment for discussions; S. Davis for MERRA2 reanalysis winds; and P. Novelli for CO data from MLO. The CESM project is
supported by the NSF and the Office of Science (BER) of the US Department of Energy. We acknowledge the NOAA Research and Development High Performance Computing Program for computing and
storage resources. This work was funded in part by the NOAA Climate Program Office’s AC4 program. The scientific results and conclusions, as well as any views or opinions expressed herein,
are those of the authors and do not necessarily reflect the views of NOAA or the Department of Commerce. REVIEWER INFORMATION _Nature_ thanks J. Laube and the other anonymous reviewer(s) for
their contribution to the peer review of this work. AUTHOR INFORMATION AUTHORS AND AFFILIATIONS * Global Monitoring Division, Earth System Research Laboratory, National Oceanic and
Atmospheric Administration, Boulder, CO, USA Stephen A. Montzka, Geoff S. Dutton, Brad D. Hall, Debra Mondeel, Carolina Siso, J. David Nance, Lei Hu, Fred Moore, Ben R. Miller & James W.
Elkins * Cooperative Institute for Research in Environmental Sciences, University of Colorado, Boulder, CO, USA Geoff S. Dutton, Pengfei Yu, Eric Ray, Debra Mondeel, Carolina Siso, J. David
Nance, Lei Hu, Fred Moore & Ben R. Miller * Chemical Sciences Division, Earth System Research Laboratory, National Oceanic and Atmospheric Administration, Boulder, CO, USA Pengfei Yu,
Eric Ray, Robert W. Portmann & John S. Daniel * A/gent Consultancy BV, Venlo, The Netherlands Lambert Kuijpers * School of Chemistry, University of Bristol, Bristol, UK Matt Rigby *
United Kingdom Met Office, Exeter, UK Alistair J. Manning Authors * Stephen A. Montzka View author publications You can also search for this author inPubMed Google Scholar * Geoff S. Dutton
View author publications You can also search for this author inPubMed Google Scholar * Pengfei Yu View author publications You can also search for this author inPubMed Google Scholar * Eric
Ray View author publications You can also search for this author inPubMed Google Scholar * Robert W. Portmann View author publications You can also search for this author inPubMed Google
Scholar * John S. Daniel View author publications You can also search for this author inPubMed Google Scholar * Lambert Kuijpers View author publications You can also search for this author
inPubMed Google Scholar * Brad D. Hall View author publications You can also search for this author inPubMed Google Scholar * Debra Mondeel View author publications You can also search for
this author inPubMed Google Scholar * Carolina Siso View author publications You can also search for this author inPubMed Google Scholar * J. David Nance View author publications You can
also search for this author inPubMed Google Scholar * Matt Rigby View author publications You can also search for this author inPubMed Google Scholar * Alistair J. Manning View author
publications You can also search for this author inPubMed Google Scholar * Lei Hu View author publications You can also search for this author inPubMed Google Scholar * Fred Moore View
author publications You can also search for this author inPubMed Google Scholar * Ben R. Miller View author publications You can also search for this author inPubMed Google Scholar * James
W. Elkins View author publications You can also search for this author inPubMed Google Scholar CONTRIBUTIONS S.A.M. led the investigation, provided GC–MS measurements, and performed
interpretive analysis and box modelling; G.S.D., D.J.N. and D.M. provided GC–ECD measurements; C.S. and B.R.M. provided GC–MS measurements; D.J.N. and M.R. performed 12-box modelling; P.Y.
and R.W.P. performed CCM simulations; J.S.D., E.R. and F.M. performed box modelling and provided conceptual understanding; B.D.H. ensured accuracy and consistency in standard scales; L.K.
provided insight into UNEP reporting; L.H. provided data analysis; A.J.M. performed trajectory calculations; and S.A.M. wrote the paper with input from J.S.D., M.R., P.Y., L.K., B.D.H.,
G.S.D., J.W.E. and L.H. CORRESPONDING AUTHOR Correspondence to Stephen A. Montzka. ETHICS DECLARATIONS COMPETING INTERESTS The authors declare no competing interests. ADDITIONAL INFORMATION
PUBLISHER’S NOTE: Springer Nature remains neutral with regard to jurisdictional claims in published maps and institutional affiliations. EXTENDED DATA FIGURES AND TABLES EXTENDED DATA FIG. 1
HEMISPHERIC DIFFERENCES IN CFC-11 MOLE FRACTIONS REPRESENTED BY RESULTS FROM INDIVIDUAL SITES AT COMPARABLE LATITUDES. A, Twelve-month running means of monthly differences are plotted at
the mid-point of that time interval. Results from low latitudes (green lines) include a site at high-altitude (MLO) and low-altitude (KUM) in the Northern Hemisphere compared to the site at
American Samoa (SMO). Results from mid- to high-latitude site pairs are indicated in other colours and include data from high-altitude (NWR, SUM, SPO) and low-altitude (THD, MHD, BRW) sites.
Comparisons made at sites with similar sampling altitudes are indicated in bold lines. B, Details of site locations from which measurements of CFC-11 are obtained from flasks and from in
situ instrumentation. EXTENDED DATA FIG. 2 OBSERVED AND SIMULATED GLOBAL RATES OF CHANGE AND HEMISPHERIC DIFFERENCES FOR SOME OTHER LONG-LIVED CHEMICALS. A, Measured global surface rates for
N2O (grey line), CFC-12 (thin blue lines), and CFC-113 (thin green lines) from flasks analysed by GC–ECD and also, for the CFCs, by GC–MS. B, Hemispheric differences measured for CFC-12 and
N2O. C, Hemispheric differences measured for CFC-113. Multiple CCM simulation results appear in A, B, and C for CFCs as thick dark lines and are updated only annually; they represent
simulations using the CAMCHEM model with MERRA2 reanalysis meteorology and the three-box-derived emission history. Dashed lines after 2012 represent simulations with emissions kept constant
after 2012 (dark blue for CFC-12 or dark green for CFC-113), or when the three-box-derived emission record was considered but dynamics in 2012 were repeated in subsequent years (red dashed
lines). Emission distribution 1 was used in all simulations (see Methods). Interannual variability in global growth rates for these gases are sometimes correlated, suggesting a common cause
related to STE dynamics, perhaps associated with the quasi-biannual oscillation, although emission variations are particularly likely for N2O (for example, refs 32,33,34). This may explain
the peak in growth rates for a number of gases in 2015. The change in rate for CFC-11 (see Fig. 4), however, is substantially larger and is sustained in 2016 when rates for other gases do
not change appreciably or become smaller, suggesting that the underlying causes for the majority of changes observed for CFC-11 are unique to that gas. EXTENDED DATA FIG. 3 THE SENSITIVITY
OF HEMISPHERIC MOLE FRACTION DIFFERENCES TO VARIATIONS IN HEMISPHERIC AIR MASS EXCHANGE. A, B, Points represent the observation-based (blue symbols) or modelled (red and grey symbols)
hemispheric difference as a function of the global emission rate derived for that year in the three-box model for HCFC-22 (A) and for HFC-134a (B; see Methods; lines connect sequential years
and the legend applies to A and B). The sensitivity of the hemispheric mole fraction difference (N−S difference) to exchange timescale (τexch, N−S) was tested in the model by incorporating
values of ± 0.1 yr around 1.1 yr. If this timescale did not vary interannually, we would expect the observation-based points (blue) to overlay those from the model (red). A change in the
annual mean value of this exchange would increase the difference between the observed and modelled N−S difference. Specifically, an annual mean change of ± 0.1 year would be reflected in the
observed N−S difference being two-thirds of the way closer to the grey point associated with the emission derived for that year. The consistency between the model (red) and observed (blue)
hemispheric differences in most years suggests that interannual changes in the exchange timescale are 0.1 yr (around 10%) or less, typically. More importantly, the results show no systematic
change in this relationship before and after 2012, suggesting that any change in the rate of hemispheric air exchange in the troposphere is less than 10% during this period. We estimate
that to fit the observed increase in the N–S difference measured for CFC-11 after 2012 without increasing the net CFC-11 flux to the Northern Hemisphere, this exchange time constant would
have had to increase from 1.1 to 1.7 yr, which is inconsistent with the results presented here. Although the distribution of emissions between and within the hemispheres can affect the N–S
difference, any considerable change in this distribution over time would probably be a shift to lower latitudes (away from the US and Europe) and would lead to a decrease in the N−S
difference over time, not an increase as is observed for CFC-11 after 2012. Consistent with this, the best fit to the observations was obtained when the emission distribution (North
Hemisphere/global) in these analyses was linearly decreased over time (from 0.95 in 1995 to 0.85 in 2015 for HFC-134a, and from 0.86 to 0.82 for HCFC-22). Assuming a constant hemispheric
emission distribution (Northern Hemisphere/global) over time does not change the conclusions from this analysis. EXTENDED DATA FIG. 4 MEASURED AND MODELLED ANNUAL HEMISPHERIC DIFFERENCES
VERSUS GLOBAL EMISSIONS OF CFC-11. A, Measured mole fraction differences between the Northern and Southern Hemispheres (North − South) as a function of the global emission derived with a
three-box model for 1978–2016; the line is a fit to all results and each point represents an annual mean difference and emission for a particular year. B, An expanded scale of data displayed
in A with results from different measurement methods represented by symbols of the same colour; grey symbols (plus signs and diamonds) refer to a combined set of results from flasks and in
situ instruments analysed by GC–ECD. For each method (colour), unfilled symbols refer to results for the years 2010–2012; filled symbols refer to 2013–2016. Specific years are labelled for
GC–MS results during 2013–2016 and for ECD results during 1997–2000 (for example, ’15 is 2015). The data show that the relationship observed here during 2014–2016 is similar to that observed
during 1996–2000. C, Same as B, but with differences between the Northern and Southern Hemispheres derived from the three-box model shown (black points and line connecting sequential
years); select model years are labelled. EXTENDED DATA FIG. 5 CORRELATIONS BETWEEN TRACE GASES MEASURED DURING AUTUMN AT MAUNA LOA. A, Measured mole fractions of CFC-11 and HCFC-22 in all
samples collected during autumn (fraction of year > 0.6 and < 0.9) at MLO in the past nine years. B, Results for CH2Cl2 versus HCFC-22 in those same samples and years. C, The _r_2
regression coefficients (blue filled symbols, left-hand scale) and slopes (red unfilled symbols, right-hand scale) determined from the data in A over time. Only slopes for correlations that
are significant at _P_ < 0.05 are shown (that is, those for which _r_2 > ~0.25). D, The same as C, but for the data in B (CH2Cl2 versus HCFC-22). Eastern Asia has been a substantial
source of HCFC-22 and CH2Cl2 for a number of years1,11. As a result, significant correlated variability is expected in their mixing ratios downwind of this region; this is borne out in
observations at MLO during autumn from 2009 to 2017. These data may also provide rough estimates of relative emission magnitudes. For example, inventory- and atmosphere-based studies suggest
emissions of HCFC-22 from China of around 100 Gg in 2010, increasing to 150 Gg in 2015 (ref. 1). Considering the slopes measured at MLO between HCFC-22 and CH2Cl2, this would correspond to
regional emissions of CH2Cl2 of 300 Gg in 2010 increasing to 440 Gg in 2016. This is comparable to the 455 Gg ( ± 10%) estimated to have been used in China for emissive applications in 2015
(ref. 11). Applying the same analysis to CFC-11 suggests total emissions of 30–40 Gg yr−1 for 2014–2017, or 10–35 Gg higher than estimated for Chinese CFC-11 emissions in 2008–2009
(considering errors1), which is of the same order as the global CFC-11 emission increase derived here for 2014–2016 (13 ± 5 Gg yr−1). Although our data and analyses do not allow for a robust
identification of the origin of the increase in CFC-11 emissions, we explore China’s potential contribution because it is also the largest producer and user of HCFCs in eastern Asia (see
ref. 4 and http://ozone.unep.org/en/data-reporting/data-centre). EXTENDED DATA FIG. 6 CORRELATIONS BETWEEN ADDITIONAL TRACE GASES MEASURED DURING AUTUMN AT MAUNA LOA. Same as Extended Data
Fig. 5, but for mole fractions of carbon monoxide versus HCFC-22 measured at MLO during autumn. A, The results in individual years. B, The _r_2 regression coefficients (blue filled symbols,
left-hand axis) and slopes (red unfilled symbols, right-hand axis) determined from the data in A over the past eight years. EXTENDED DATA FIG. 7 VARIABILITY IN TRACE GAS MOLE FRACTIONS
MEASURED AT MLO BEFORE AND AFTER 2012. A, Mole fractions of HCFC-22 measured in flasks collected at MLO during the autumn of 2011 (red lines and symbols) and 2016 (blue lines and symbols).
B, The same as A, but for CFC-11. C–F, Back trajectories calculated27 for 2011 samples indicated by the red text L1, L2, H1 and H2 in A and B. G–J, Back trajectories calculated for 2016
samples indicated by the blue text L1, L2, H1 and H2 in A and B. In C–J, darker shading represents surface regions sensed by the corresponding sampling events at MLO, with darker colours
indicating greater influence. The colour scale in the trajectory maps is logarithmic (1 × 10⁻⁹ to 1 × 10⁻³ g s m−3, darker colours for higher concentrations) and represents the calculated
time-averaged concentration within the 0–2,000 m surface layer during the 30 days before the sampling event given a point release at MLO27 of 1 g s−1. Increased mole fractions of HCFC-22 are
observed in both 2011 and 2016 (labelled H1 and H2 in A or B and High 1 and High 2 in C–J) when surface sensitivity over eastern Asia is enhanced; CFC-11 mole fractions at MLO co-vary with
HCFC-22 in these eastern-Asian influenced samples only after 2012. Some industrialized regions (for example, Japan) have considerable influence on samples containing both high and low mole
fractions of CFC-11, HCFC-22 and CH2Cl2 and, therefore, are less likely to be the source of the greater mole fractions of CFC-11 at MLO after 2012. These results, along with results from
Fig. 3 and Extended Data Figs. 5 and 6, suggest an increase in CFC-11 emissions from eastern Asia that is coincident with the increase in global emissions derived from our sampling network.
EXTENDED DATA FIG. 8 ADDITIONAL MODEL SIMULATIONS OF THE CHANGES IN CFC-11 MOLE FRACTION OVER TIME AND OF HEMISPHERIC DIFFERENCES. Rates of change and hemispheric differences from different
combinations of emission distributions (E1, E2, E3), reanalysis meteorology (MERRA1 (M1), MERRA2 (M2), and GEOS5 (G5)), and CCMs (CAM and WACCM) are compared to quantities derived from
observations (red lines or shading indicate the range of results from two (hemispheric differences) or three (global change rates) measurement techniques (Methods)). In all panels, results
from observations and the CAM run using the Emission1 distribution and MERRA2 reanalysis meteorology are shown for reference (solid light blue and green lines). All blue lines represent
simulations using the emission record derived from the three-box model analysis of observations, whereas all green lines indicate simulations with emissions kept constant after 2012 at the
2012 rate. A–C, Results from CAM as a function of emission distribution (E1 and E3) and nudging methodology (temperature and winds, or wind-only). D–F, Results from WACCM as a function of
reanalysis meteorology (MERRA1 or MERRA2). G–I, Results from WACCM with GEOS5 reanalysis meteorology and two different emission distributions (E2 and E1). The comparisons are made for the
CFC-11 global rate of change at the Earth’s surface (A, D, G; left column), the surface mean hemispheric difference (B, E, H; middle column), and the change in the surface mean hemispheric
difference relative to the mean during 2010–2012 (C, F, I; right column; note expanded time axis). All quantities being compared are derived from hemispheric means determined from cosine of
latitude weighting of observed or simulated mole fractions at sampling locations (Methods). EXTENDED DATA FIG. 9 THE SENSITIVITY OF DERIVED BANK RELEASE RATES TO CFC-11 LIFETIME AND
INCINERATION. Bank release rates derived with a 57.5-year lifetime as shown in Fig. 2b (black squares and the dashed blue line) are also calculated considering the upper and lower values for
the most likely CFC-11 lifetime range (red lines; 43–67 yr, ref. 1). Including quantities of CFC-11 destroyed (for example, by incineration) reported to UNEP (grey circles) affect this
result minimally. SOURCE DATA SOURCE DATA FIGURE 1 SOURCE DATA FIGURE 2 SOURCE DATA FIGURE 3 SOURCE DATA FIGURE 4 RIGHTS AND PERMISSIONS Reprints and permissions ABOUT THIS ARTICLE CITE THIS
ARTICLE Montzka, S.A., Dutton, G.S., Yu, P. _et al._ An unexpected and persistent increase in global emissions of ozone-depleting CFC-11. _Nature_ 557, 413–417 (2018).
https://doi.org/10.1038/s41586-018-0106-2 Download citation * Received: 07 November 2017 * Accepted: 19 March 2018 * Published: 16 May 2018 * Issue Date: 17 May 2018 * DOI:
https://doi.org/10.1038/s41586-018-0106-2 SHARE THIS ARTICLE Anyone you share the following link with will be able to read this content: Get shareable link Sorry, a shareable link is not
currently available for this article. Copy to clipboard Provided by the Springer Nature SharedIt content-sharing initiative