Play all audios:
ABSTRACT The most robust and reliable signatures of brain states are enriched in rhythms between 0.1 and 20 Hz. Here we address the possibility that the fundamental unit of brain state could
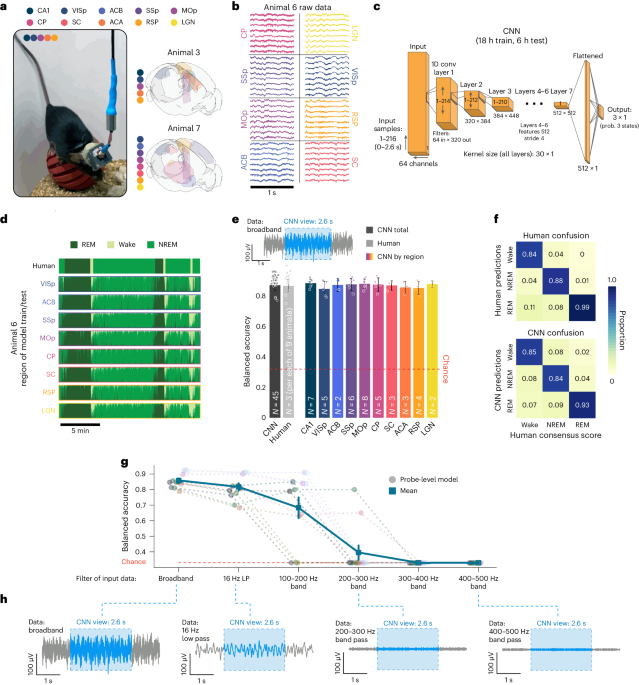
be at the scale of milliseconds and micrometers. By analyzing high-resolution neural activity recorded in ten mouse brain regions over 24 h, we reveal that brain states are reliably
identifiable (embedded) in fast, nonoscillatory activity. Sleep and wake states could be classified from 100 to 101 ms of neuronal activity sampled from 100 µm of brain tissue. In contrast
to canonical rhythms, this embedding persists above 1,000 Hz. This high-frequency embedding is robust to substates, sharp-wave ripples and cortical on/off states. Individual regions
intermittently switched states independently of the rest of the brain, and such brief state discontinuities coincided with brief behavioral discontinuities. Our results suggest that the
fundamental unit of state in the brain is consistent with the spatial and temporal scale of neuronal computation. Access through your institution Buy or subscribe This is a preview of
subscription content, access via your institution ACCESS OPTIONS Access through your institution Access Nature and 54 other Nature Portfolio journals Get Nature+, our best-value
online-access subscription $32.99 / 30 days cancel any time Learn more Subscribe to this journal Receive 12 print issues and online access $209.00 per year only $17.42 per issue Learn more
Buy this article * Purchase on SpringerLink * Instant access to full article PDF Buy now Prices may be subject to local taxes which are calculated during checkout ADDITIONAL ACCESS OPTIONS:
* Log in * Learn about institutional subscriptions * Read our FAQs * Contact customer support SIMILAR CONTENT BEING VIEWED BY OTHERS THE INSIDEOUT FRAMEWORK PROVIDES PRECISE SIGNATURES OF
THE BALANCE OF INTRINSIC AND EXTRINSIC DYNAMICS IN BRAIN STATES Article Open access 10 June 2022 COMPLEXITY OF CORTICAL WAVE PATTERNS OF THE WAKE MOUSE CORTEX Article Open access 15 March
2023 DECODING BRAIN STATES ON THE INTRINSIC MANIFOLD OF HUMAN BRAIN DYNAMICS ACROSS WAKEFULNESS AND SLEEP Article Open access 09 July 2021 DATA AVAILABILITY The datasets generated and/or
analyzed in this study constitute tens of terabytes of raw neural broadband. The data are stored in a cost-efficient manner not immediately accessible to the internet. We are excited to
share data upon reasonable request and as technical limitations make possible. The Allen Brain Atlases used for stereotaxic targeting are available at https://atlas.brain-map.org/. CODE
AVAILABILITY All relevant code from our lab, including software needed to run recordings or CNN models like ours, is in Python 3 and is publicly available via GitHub at
https://github.com/hengenlab. Other groups’ code, including Open Ephys, SpikeInterface and MountainSort4, is publicly available as specified in Methods. REFERENCES * Berger, H. Über das
Elektrenkephalogramm des Menschen. _Arch. Psychiatr. Nervenkrankh._ 87, 527–570 (1929). Article Google Scholar * Gervasoni, D. et al. Global forebrain dynamics predict rat behavioral
states and their transitions. _J. Neurosci._ 24, 11137–11147 (2004). Article CAS PubMed PubMed Central Google Scholar * Volgushev, M. et al. Precise long-range synchronization of
activity and silence in neocortical neurons during slow-wave sleep. _J. Neurosci._ 26, 5665–5672 (2006). Article CAS PubMed PubMed Central Google Scholar * Burle, B. et al. Spatial and
temporal resolutions of EEG: is it really black and white? A scalp current density view. _Int. J. Psychophysiol._ 97, 210–220 (2015). Article PubMed PubMed Central Google Scholar * Ding,
F. et al. Changes in the composition of brain interstitial ions control the sleepwake cycle. _Science_ 352, 550–555 (2016). Article CAS PubMed PubMed Central Google Scholar * Lee,
S.-H. & Dan, Y. Neuromodulation of brain states. _Neuron_ 76, 209–222 (2012). Article CAS PubMed PubMed Central Google Scholar * Nir, Y. & de Lecea, L. Sleep and vigilance
states: embracing spatiotemporal dynamics. _Neuron_ 111, 1998–2011 (2023). Article CAS PubMed Google Scholar * Routtenberg, A. Hippocampal correlates of consummatory and observed
behavior. _Physiol. Behav._ 3, 533–535 (1968). Article Google Scholar * Sainsbury, R. S., Heynen, A. & Montoya, C. P. Behavioral correlates of hippocampal type 2 theta in the rat.
_Physiol. Behav._ 39, 513–519 (1987). Article CAS PubMed Google Scholar * Harris, K. D. & Thiele, A. Cortical state and attention. _Nat. Rev. Neurosci._ 12, 509–523 (2011). Article
CAS PubMed PubMed Central Google Scholar * Engel, T. A. et al. Selective modulation of cortical state during spatial attention. _Science_ 354, 1140–1144 (2016). Article CAS PubMed
Google Scholar * Lacroix, M. M. et al. Improved sleep scoring in mice reveals human-like stages. Preprint at _bioRxiv_ https://doi.org/10.1101/489005 (2018). * Huber, R. et al. Arm
immobilization causes cortical plastic changes and locally decreases sleep slow wave activity. _Nat. Neurosci._ 9, 1169–1176 (2006). Article CAS PubMed Google Scholar * Nir, Y. et al.
Regional slow waves and spindles in human sleep. _Neuron_ 70, 153–169 (2011). Article CAS PubMed PubMed Central Google Scholar * Emrick, J. J. et al. Different simultaneous sleep states
in the hippocampus and neocortex. _Sleep_ 39, 2201–2209 (2016). Article PubMed PubMed Central Google Scholar * Soltani, S. et al. Sleep–wake cycle in young and older mice. _Front. Syst.
Neurosci._ 13, 51 (2019). Article CAS PubMed PubMed Central Google Scholar * Vyazovskiy, V. V. et al. Local sleep in awake rats. _Nature_ 472, 443–447 (2011). Article CAS PubMed
PubMed Central Google Scholar * Rattenborg, N. C. et al. Evidence that birds sleep in mid-flight. _Nat. Commun._ 7, 12468 (2016). Article CAS PubMed PubMed Central Google Scholar *
Serafetinides, E. A., Shurley, J. T. & Brooks, R. E. Electroencephalogram of the pilot whale, _Globicephala scammoni_, in wakefulness and sleep: lateralization aspects. _Int. J.
Psychobiol._ 2, 129–135 (1972). [Google Scholar]. Google Scholar * Tamaki, M. et al. Night watch in one brain hemisphere during sleep associated with the first-night effect in humans.
_Curr. Biol._ 26, 1190–1194 (2016). Article CAS PubMed PubMed Central Google Scholar * Rector, D. M. et al. Local functional state differences between rat cortical columns. _Brain Res._
1047, 45–55 (2005). Article CAS PubMed Google Scholar * Amzica, F. & Steriade, M. Electrophysiological correlates of sleep delta waves. _Electroencephalogr. Clin. Neurophysiol._
107, 69–83 (1998). Article CAS PubMed Google Scholar * Buzsáki, G. & Schomburg, E. W. What does gamma coherence tell us about interregional neural communication? _Nat. Neurosci._ 18,
484–489 (2015). Article PubMed PubMed Central Google Scholar * Mölle, M. et al. Hippocampal sharp wave-ripples linked to slow oscillations in rat slow-wave sleep. _J. Neurophysiol._ 96,
62–70 (2006). Article PubMed Google Scholar * Girardeau, G. & Lopes-dos-Santos, V. Brain neural patterns and the memory function of sleep. _Science_ 374, 560–564 (2021). Article CAS
PubMed PubMed Central Google Scholar * Muñoz-Torres, Z. et al. Amygdala and hippocampus dialogue with neocortex during human sleep and wakefulness. _Sleep_ 46, zsac224 (2022). Article
Google Scholar * Rolnick, D. et al. Deep learning is robust to massive label noise. Preprint at http://arxiv.org/abs/1705.10694 (2018). * Gent, T. C., Bassetti, C. L. A. & Adamantidis,
A. R. Sleep–wake control and the thalamus. _Curr. Opin. Neurobiol._ 52, 188–197 (2018). Article CAS PubMed Google Scholar * Saper, C. B. Staying awake for dinner: hypothalamic
integration of sleep, feeding, and circadian rhythms. In _Hypothalamic Integration of Energy Metabolism_, _Proc. 24th International Summer School of Brain Research, held at the Royal
Netherlands Academy of Arts and Sciences_ 243–252 (Elsevier, 2006). * Ellis, C. A., Miller, R. L. & Calhoun, V. D. A systematic approach for explaining time and frequency features
extracted by convolutional neural networks from raw electroencephalography data. _Front. Neuroinform._ 16, 872035 (2022). Article PubMed PubMed Central Google Scholar * Hengen, K. B. et
al. Neuronal firing rate homeostasis is inhibited by sleep and promoted by wake. _Cell_ 165, 180–191 (2016). Article CAS PubMed PubMed Central Google Scholar * Chung, J. E. et al. A
fully automated approach to spike sorting. _Neuron_ 95, 1381–1394.e6 (2017). Article CAS PubMed PubMed Central Google Scholar * Bédard, C., Kröger, H. & Destexhe, A. Model of
low-pass filtering of local field potentials in brain tissue. _Phys. Rev. E_ 73, 051911 (2006). Article Google Scholar * Harris, K. D. et al. Improving data quality in neuronal population
recordings. _Nat. Neurosci._ 19, 1165–1174 (2016). Article PubMed PubMed Central Google Scholar * Trautmann, E. M. et al. Accurate estimation of neural population dynamics without spike
sorting. _Neuron_ 103, 292–308.e4 (2019). Article CAS PubMed PubMed Central Google Scholar * Vanderwolf, C. H. Hippocampal electrical activity and voluntary movement in the rat.
_Electroencephalogr. Clin. Neurophysiol._ 26, 407–418 (1969). Article CAS PubMed Google Scholar * Girardeau, G. et al. Selective suppression of hippocampal ripples impairs spatial
memory. _Nat. Neurosci._ 12, 1222–1223 (2009). Article CAS PubMed Google Scholar * Karlsson, M. P. & Frank, L. M. Awake replay of remote experiences in the hippocampus. _Nat.
Neurosci._ 12, 913–918 (2009). Article CAS PubMed PubMed Central Google Scholar * Kay, K. et al. A hippocampal network for spatial coding during immobility and sleep. _Nature_ 531,
185–190 (2016). Article CAS PubMed PubMed Central Google Scholar * Vallat, R. & Walker, M. P. An open-source, high-performance tool for automated sleep staging. _eLife_ 10, e70092
(2021). Article CAS PubMed PubMed Central Google Scholar * Funk, C. M. et al. Local slow waves in superficial layers of primary cortical areas during REM sleep. _Curr. Biol._ 26,
396–403 (2016). Article CAS PubMed PubMed Central Google Scholar * Halasz, P. Hierarchy of micro-arousals and the microstructure of sleep. _Neurophysiol. Clin._ 28, 461–475 (1998).
Article CAS PubMed Google Scholar * Ekstedt, M., Åkerstedt, T. & Söderström, M. Microarousals during sleep are associated with increased levels of lipids, cortisol, and blood
pressure. _Psychosom. Med._ 66, 925–931 (2004). Article CAS PubMed Google Scholar * Andrillon, T. et al. Predicting lapses of attention with sleep-like slow waves. _Nat. Commun._ 12,
64–78. (2021). Article Google Scholar * Siclari, F. & Tononi, G. Local aspects of sleep and wakefulness. _Curr. Opin. Neurobiol._ 44, 222–227 (2017). Article CAS PubMed PubMed
Central Google Scholar * Poulet, J. F. A. & Petersen, C. C. H. Internal brain state regulates membrane potential synchrony in barrel cortex of behaving mice. _Nature_ 454, 881–885
(2008). Article CAS PubMed Google Scholar * Tan, A. Y. Y. et al. Sensory stimulation shifts visual cortex from synchronous to asynchronous states. _Nature_ 509, 226–229 (2014). Article
CAS PubMed PubMed Central Google Scholar * Kramer, D. L. & McLaughlin, R. L. The behavioral ecology of intermittent locomotion. _Am. Zool._ 41, 137–153 (2001). Google Scholar *
Steriade, M., McCormick, D. A. & Sejnowski, T. J. Thalamocortical oscillations in the sleeping and aroused brain. _Science_ 262, 679–685 (1993). Article CAS PubMed Google Scholar *
Carter, M. E. et al. Tuning arousal with optogenetic modulation of locus coeruleus neurons. _Nat. Neurosci._ 13, 1526–1533 (2010). Article CAS PubMed PubMed Central Google Scholar *
Chen, K.-S. et al. A hypothalamic switch for REM and non-REM sleep. _Neuron_ 97, 1168–1176.e4 (2018). Article CAS PubMed Google Scholar * Moruzzi, G. & Magoun, H. W. Brain stem
reticular formation and activation of the EEG. _Electroencephalogr. Clin. Neurophysiol._ 1, 455–473 (1949). Article CAS PubMed Google Scholar * Li, S.-B. et al. Hyperexcitable arousal
circuits drive sleep instability during aging. _Science_ 375, eabh3021 (2022). Article CAS PubMed PubMed Central Google Scholar * Sweyta Lohani et al. Spatiotemporally heterogeneous
coordination of cholinergic and neocortical activity. _Nat. Neurosci._ 25, 1706–1713 (2022). Article PubMed PubMed Central Google Scholar * Noda, H. & Adey, W. R. Changes in neuronal
activity in association cortex of the cat in relation to sleep and wakefulness. _Brain Res._ 19, 263–275 (1970). Article CAS PubMed Google Scholar * Abásolo, D. et al. Lempel–Ziv
complexity of cortical activity during sleep and waking in rats. _J. Neurophysiol._ 113, 2742–2752 (2015). Article PubMed PubMed Central Google Scholar * Watson, B. O. et al. Network
homeostasis and state dynamics of neocortical sleep. _Neuron_ 90, 839–852 (2016). Article CAS PubMed PubMed Central Google Scholar * Levenstein, D. et al. Sleep regulation of the
distribution of cortical firing rates. _Curr. Opin. Neurobiol._ 44, 34–42 (2017). Article CAS PubMed PubMed Central Google Scholar * Brunwasser, S. J. et al. Circuit-specific selective
vulnerability in the DMN persists in the face of widespread amyloid burden. Preprint at _bioRxiv_ https://doi.org/10.1101/2022.11.14.516510 (2022). * Xu, Y. et al. Sleep restores an optimal
computational regime in cortical networks. _Nat. Neurosci._ 27, 1–11 (2024). Article Google Scholar * Simonyan, K., Vedaldi, A. & Zisserman, A. Deep inside convolutional networks:
visualising image classification models and saliency maps. Preprint at http://arxiv.org/abs/1312.6034 (2013). * Torsvall, L. & Åkerstedt, T. Sleepiness on the job: continuously measured
EEG changes in train drivers. _Electroencephalogr. Clin. Neurophysiol._ 66, 502–511 (1987). Article CAS PubMed Google Scholar * Carskadon, M.A. & Rechtschaffen, A. in _Principles and
Practice of Sleep Medicine_ (eds. Kryger, M. H., Roth, T. & Dement, W. C.) 1359–1377 (Elsevier, 2005). * Franken, P., Malafosse, A. & Tafti, M. Genetic variation in EEG activity
during sleep in inbred mice. _Am. J. Physiol. Regul. Integr. Comp. Physiol._ 275, R1127–R1137. (1998). Article CAS Google Scholar * Kjaerby, C. et al. Memory-enhancing properties of sleep
depend on the oscillatory amplitude of norepinephrine. _Nat. Neurosci._ 25, 1059–1070 (2022). Article CAS PubMed PubMed Central Google Scholar * Hertig-Godeschalk, A. et al. Microsleep
episodes in the borderland between wakefulness and sleep. _Sleep_ 43, zsz163 (2019). Article Google Scholar * Nobili, L. et al. Dissociated wake-like and sleep-like electro-cortical
activity during sleep. _NeuroImage_ 58, 612–619 (2011). Article PubMed Google Scholar * Hung, C.-S. et al. Local experience-dependent changes in the wake EEG after prolonged wakefulness.
_Sleep_ 36, 59–72 (2013). Article PubMed PubMed Central Google Scholar * Kroeger, D. & de Lecea, L. The hypocretins and their role in narcolepsy. _CNS Neurol. Disord. Drug Targets_
8, 271–280 (2009). Article CAS PubMed Google Scholar * Cao, M. T. & Guilleminault, C. in _Principles and Practice of Sleep Medicine_ (eds. Kryger, M. H., Roth, T. & Dement, W.
C.) 873–882.e5 (Elsevier, 2017). * Claudi, F. et al. Visualizing anatomically registered data with brainrender. _eLife_ 10, e65751 (2021). Article CAS PubMed PubMed Central Google
Scholar * Siegle, J. H. et al. Open Ephys: an open-source, plugin-based platform for multichannel electrophysiology. _J. Neural Eng._ 14, 045003 (2017). Article PubMed Google Scholar *
Buccino, A. P. et al. SpikeInterface, a unified framework for spike sorting. _eLife_ 9, e61834 (2020). Article CAS PubMed PubMed Central Google Scholar * Science: Public Resources:
Atlases: Allen Mouse Brain Atlas. _Allen Institute for Brain Science_ http://www.alleninstitute.org/science/public_resources/atlases/mouse_atlas.html (2012). * Mathis, A. et al. DeepLabCut:
markerless pose estimation of user-defined body parts with deep learning. _Nat. Neurosci._ 21, 1281–1289 (2018). Article CAS PubMed Google Scholar * Good, I. J. Rational decisions. _J.
R. Stat. Soc. Ser. B_ 14, 107–114 (1952). Article Google Scholar * Brodersen, K. H. et al. The balanced accuracy and its posterior distribution. In _20th International Conference on
Pattern Recognition_ 3121–3124 (IEEE, 2010). * Kelleher, J. D., Namee, B. M. & D’Arcy, A. _Fundamentals of Machine Learning for Predictive Data Analytics: Algorithms, Worked Examples,
and Case Studies_ (The MIT Press, 2015). * Siapas, A. G. & Wilson, M. A. Coordinated interactions between hippocampal ripples and cortical spindles during slow-wave sleep. _Neuron_ 21,
1123–1128 (1998). Article CAS PubMed Google Scholar * Farnebäck, G. _Two-Frame Motion Estimation Based on Polynomial Expansion. Lecture Notes in Computer Science_ (ed. Goos, G.) 363–370
(Springer, 2003). * Bates, D. et al. Parsimonious mixed models. Preprint at https://arxiv.org/abs/1506.04967 (2015). Download references ACKNOWLEDGEMENTS This work is supported by NIH BRAIN
Initiative 1R01NS118442-01 (KBH), and the Schmidt Futures Foundation SF 857 (D.H.). Through the Pacific Research Platform, this work was supported in part by NSF awards CNS-1730158,
ACI-1540112, ACI-1541349, OAC-1826967, the University of California Office of the President, and the University of California San Diego’s California Institute for Telecommunications and
Information Technology/Qualcomm Institute. We acknowledge CENIC for the 100 Gpbs networks. We also thank S. Aton, B. Carlson, S. Ching, C. Cirelli, M. Frank, K. Ganguly, T. Holy, L. de
Lecea, D. Redish and P. Shaw for their insights and conversations about this research. AUTHOR INFORMATION Author notes * These authors contributed equally: David F. Parks, Aidan M.
Schneider. AUTHORS AND AFFILIATIONS * Department of Biomolecular Engineering, University of California, Santa Cruz, CA, USA David F. Parks & David Haussler * Department of Biology,
Washington University in Saint Louis, St. Louis, MO, USA Aidan M. Schneider, Yifan Xu, Samuel J. Brunwasser, Samuel Funderburk & Keith B. Hengen * Independent researcher, Exeter, NH, USA
Danilo Thurber * White Matter LLC, Seattle, WA, USA Tim Blanche * Department of Biomedical Engineering, Georgia Institute of Technology, Atlanta, GA, USA Eva L. Dyer Authors * David F.
Parks View author publications You can also search for this author inPubMed Google Scholar * Aidan M. Schneider View author publications You can also search for this author inPubMed Google
Scholar * Yifan Xu View author publications You can also search for this author inPubMed Google Scholar * Samuel J. Brunwasser View author publications You can also search for this author
inPubMed Google Scholar * Samuel Funderburk View author publications You can also search for this author inPubMed Google Scholar * Danilo Thurber View author publications You can also search
for this author inPubMed Google Scholar * Tim Blanche View author publications You can also search for this author inPubMed Google Scholar * Eva L. Dyer View author publications You can
also search for this author inPubMed Google Scholar * David Haussler View author publications You can also search for this author inPubMed Google Scholar * Keith B. Hengen View author
publications You can also search for this author inPubMed Google Scholar CONTRIBUTIONS D.F.P. developed and ran the models and performed behavioral analyses, A.M.S. performed statistical
analyses, wrote the paper, performed the single-unit spiking analyses and performed behavioral analyses, Y.X. provided sleep-scoring expertise and animal care, S.J.B. contributed substate
analyses, S.F. provided sleep-scoring expertise, D.T. performed flicker identification, T.B. provided intellectual and technical consultation, E.L.D. provided mentorship and consultation,
D.H. provided mentorship and consultation and K.B.H. led, directed and envisioned the project, edited figures and wrote the paper. CORRESPONDING AUTHOR Correspondence to Keith B. Hengen.
ETHICS DECLARATIONS COMPETING INTERESTS The authors declare they have no competing interests. PEER REVIEW PEER REVIEW INFORMATION _Nature Neuroscience_ thanks Tatiana Engel and the other,
anonymous, reviewer(s) for their contribution to the peer review of this work. ADDITIONAL INFORMATION PUBLISHER’S NOTE Springer Nature remains neutral with regard to jurisdictional claims in
published maps and institutional affiliations. EXTENDED DATA EXTENDED DATA FIG. 1 HUMAN SLEEP SCORING, POLYSOMNOGRAPHY, EXAMPLE TRACES. A, 8-seconds of exemplary polysomnography data from
an animal during wake. From top-to-bottom: the low-passed LFP trace, the LFP spectrogram, the EMG, and the MinMax normalized change in position tracked by DeepLabCut (DLC) are shown (Mathis
et al.75). To form EEG-like traces, raw data were low-pass filtered at 125 Hz, downsampled to 500 Hz, and 8 non-adjacent channels were averaged. B, 8-seconds of exemplary data from NREM, C,
8 seconds of exemplary data from REM. D, An hour of data sleep-scored for Wake, NREM and REM with polysomnography. Delta band power (0.1-4 Hz) is highly enriched in NREM (slow wave) sleep,
theta band power (6-8 Hz) is enriched in REM sleep, and high resolution motor output disambiguates periods of waking, including microarousals (Watson et al.57). E, _Top-_ Confusion matrices
for average individual scorer performance using EMG or DLC for motion (rows) to consensus scoring among three expert scorers using polysomnography, including DLC and EMG (columns). _Bottom-_
Confusion matrices for microarousal detection in NREM for average individual scorer performance using polysomnography (including DLC and EMG) and polysomnography (with DLC, but not EMG).
Ground truth is consensus of three expert scorers using polysomnography, including DLC and EMG (columns). F, Exemplary hour of data sleep-scored by three experts to produce a consensus
score, which is used as training data for a CNN (predictions shown). Blue movement trace is based on DeepLabCut. G, Box plots of normalized optical flow (see methods section “Flickers During
Waking Behavior”) for active wake (active motion state), quiet wake (inactive motion state), NREM, and REM. Box plots box the intermediate quartiles, and whiskers extend 1.5 IQR beyond this
box. Highly significant differences in means were observed for all comparisons (p < 0.0001 for all comparisons, ANOVA with post-hoc EMMeans with Tukey correction, n = 1 animal). _ns p_
> _0.05, * p_ < _=0.05, ** p_ < _0.01, *** p_ < _0.001_. EXTENDED DATA FIG. 2 CNN TRAIN/TEST SEPARATION, MODEL INDEPENDENCE, AND FLICKERING. A, The three arousal states, REM,
NREM, and wake, were not evenly distributed in the recorded data (dataset distribution). Training on equal amounts of data from each state, that is, class balancing (training distribution),
prevents CNN models from simply learning to predict the most frequent class whenstate information is not clear. B, 24 h of data spanning a complete 12-12 light/dark cycles was included from
each animal. Cartoon is a schematic illustrating 24 h of light/dark (top row), and two examples of train/test segmentation of data (bottom rows). CNNs were trained on 18 h of data. Test data
comprised six contiguous hours of data spanning a light/dark transition. C, Models were trained using consensus human labels (top row). Independent models were trained and tested in each
brain region within each animal (bottom five rows show the predictions of five models, each trained to recapitulate the human labels from data recorded within the brain region indicated on
the left). CNNs are well suited to overcome label error, such as when a human score lags or leads a transition. The provided example demonstrates disagreement and model independence
surrounding a global state transition (wake into NREM). The y-axis of CNN models indicates instantaneous confidence [0-1] in each state via the proportion of each of three colors at each
point in time. D, In contrast to assessment of model accuracy, flickers are extracted from both train and test output. Flickers detected in the training component of data represent CNNs
directly disagreeing with training labels (red line indicates example of wake-to-REM flicker). Human labeled data (top row) and corresponding CNN predictions (bottom row) are computed on an
interval set by the experimenter. Flickers were extracted and cross validated in both 2.6 s and 1 s interval models. EXTENDED DATA FIG. 3 CNN ACCURACY BY REGION AS A FUNCTION OF HIGH-PASS
AND SAMPLE SIZE REDUCTION. A, Balanced accuracy of CNNs trained and tested on progressively high-passed raw data from each recorded brain region (n = 45 implants, 9 animals, 10 regions). Dot
color represents the region from which this model was trained. The region-colored line traces the average balanced accuracy of models trained on data from that region across various levels
of high-pass. High-pass filtering significantly decreased brain state information above 1,000 Hz (y = -9.892e-05*x + 0.84, p < 0.0001, r2 = 0.43). B, To directly test the minimum time
interval in which sleep and wake states reliably structure neural dynamics, we trained and tested a series of CNNs on single channel data, each model operating on a progressively smaller
interval of data (from 2.6 s to 0 s). Accuracy declined as a function of number of input sample points (pearson correlation: r = 0.650464, p < 0.0001). Example data at various input sizes
is shown below the x-axis. Model accuracy is shown as a function of region (marker color). Regional means are shown in colored lines (+/- SEM, shaded area). EXTENDED DATA FIG. 4 SPECTRAL
DENSITY DOES NOT CAPTURE THE FULL EXTENT OF HIGH FREQUENCY STATE EMBEDDING. To evaluate whether the embedding of brain state in > 750 hz activity is explained by spectral bandpower, a
logistic regression (LR) was trained on either low frequency bandpower (1-16 Hz) or high frequency bandpower (750-3,000 Hz). The resolvability of state in the LR was compared to the
performance of a CNN exposed to the same frequencies. Analyses consider the 71 single channel models that contribute to data in Fig. 3. A, Proportion of the CNN’s balanced accuracy that is
achieved by LR. Data are presented as mean values +/- SEM. At both low frequencies (1-16 Hz blue), and high frequencies (750 - 3,000 Hz, red) the CNN substantially out performs a LR model
using bandpower/FFT features. The difference between LR vs. CNN models is more pronounced in the 750 - 3,000 Hz range with the LR performance slightly better than ½ the balanced accuracy of
CNN models. B, Unity line plot comparing the performance of 750 - 3,000 Hz LR versus 40 ms CNN models on a channel-by-channel basis. Note that points generally fall below the unity line,
indicating higher balanced accuracies with the CNN than the LR. C, Confusion matrices for a single channel’s models - top is the CNN, bottom is the LR. Note that the CNN learns information
about all three states - the diagonal is characterized by above chance accuracy (white lettering, red boxes). In contrast, the LR collapses to a two-state solution (sleep v wake). For A-C, n
= 69 individual channels, where each implant is represented at least once. D,E To understand the frequency-based patterns that contain reliable state information, we examined the feature
weights for the low and high frequency LR models. D, 14 high-accuracy 1 - 16 Hz LR model weights were averaged together. The signatures of state learned in a data-driven fashion are,
unsurprisingly, highly consistent with human heuristics. For example, the 1-4 Hz (delta) band is highly weighted during NREM, and the 6-8 Hz (theta) band is highly weighted during REM. E,
High frequency LR models did not exhibit consistent patterns across channels. Here we show two exemplary 750 - 3,000 Hz LR models. While each model learned to score state at > 50%
balanced accuracy, the two weight distributions show distinct learning patterns, characterized by various irregularly interspersed frequency bands. This supplemental analysis employing
logistic regression models trained on bandpower features provides valuable insight into the spectral components of dynamical signatures of sleep and wake states. While a CNN-based approach
confirms the critical role of high frequency patterns in state classification, logistic regression analyses offer a complementary perspective, suggesting that state information persists in
the high frequency domain, albeit less comprehensively than captured by CNNs. This dual approach underscores the complexity of neural embedding of states and the limitations of relying
solely on traditional frequency domain analyses to understand such dynamics. EXTENDED DATA FIG. 5 40 MS CNNS ARE RESILIENT TO OSCILLATORY SUBSTATES. A, Top- Broadband trace of exemplary
activity during active wake in MOp over several seconds. Blue box shows the width of an individual input data used by the 40 ms CNN to predict state. Middle- Raster of MOp spiking. Bottom-
Stacked barplot of CNN prediction probabilities across the three states every 1/15 s. B, Exemplary data from MOp during quiet wake. C, Cross-correlogram between spindles (S), ripples (R),
and flickers (F) in Animal 5. A strong central peak in the cross-correlogram is observed between spindles and ripples consistent with prior work (Siapas & Wilson79). No substantial
positive correlation is observed with flickers by spindles or ripples. D) Cross-correlogram between OFF-states and flickers of various states (for instance ->W includes NREM-to-wake, and
REM-to-wake). A major central correlation trough is observed in flickers to wake, meaning flickering is reduced during sleep OFF states. E) Percent of substates which coincide with errors in
model classification in 1 s CNNs. Stacked black lines show the intermediate quartiles with all points as swarm scatter colored by region. Cortical OFF states and sleep spindles were
detected in all cortical regions in two animals (n = 10). Ripples were detected in all recordings of CA1 hippocampus (n = 7). As a negative control, for each substate, an equal number of
randomly selected timestamps were selected and evaluated. No significant differences (p > 0.05) were found between this negative control and any of the three substates. EXTENDED DATA FIG.
6 FLICKER DEFINITION METHOD APPLIED TO SYNTHETIC DATA. To illustrate the process of identifying flickers within data, we generated a synthetic dataset equivalent to 64 channels of recording
from a single brain region. The synthetic data were designed to contain examples of all forms of noise that our algorithms exclude in the process of identifying flickers. A, Human experts
score animal arousal state based on polysomnography (top). Based on these scores, three CNNs are trained to identify NREM, REM and wake based on raw neural data (1 s input) from all 64
channels within a brain region. Shown are triplicate CNN-generated state scores for our simulated brain region. B, We identify and exclude two forms of extended intervals during which
flickers are not to be considered. First, we identify windows of time during which a _transition_ (orange arrow) between two sustained states occurs. Second, we identify rare instances of
label _confusion_ (typically the result of extreme noise or CNN error) (blue arrow). This is achieved by automatically excluding any 35 s epochs with a mean confidence <75%. To exclude
low confidence _noise_ (yellow arrow) from our analyses, we eliminate 1 s epochs with a mean confidence <75%. For each time point, we then assign the label of the most
confidently-predicted state. C, To exclude _disagreements_ (magenta arrow), or artifacts of particular CNN models (that is predicted by only one of three CNNs), we collapse predictions
across models by selecting the most commonly predicted state at each time point. D, We then slide a 35 s modal filter across the majority state array to create a label corresponding to the
stable macro state surrounding each point in time. _Flickers_ are defined as disagreements between the consensus array and the continuous array (red arrow). EXTENDED DATA FIG. 7 FLICKER
TIMING SHOWS SIGNIFICANT DIFFERENCES BY CIRCUIT AND FLICKER TYPE. Pairwise comparisons between subsets of flickers using EMMeans with Tukey correction as a post hoc-test for an ANOVA fit to
a linear mixed effects model with animal as a random effect. For all ANOVAs, p < 0.001. p-Values for the pairwise comparison of row and column are printed inside a cell of the diagonal
matrices. Values of 0.0 indicate p < 0.001. A, Left- Significant differences in flicker frequency (that is rate) when grouped by region (that is circuit). Right- Significant differences
in flicker duration when grouped by region. B, Left- Significant differences in flicker frequency (that is rate) when grouped by flicker type. Right- Significant differences in flicker
duration when grouped by flicker type. EXTENDED DATA FIG. 8 FLICKERING CORRESPONDS TO TRANSITION-LIKE SPIKING PATTERNS. This figure expands on trends in spiking presented in Fig. 6. A, The
portion of units whose sampled instantaneous firing rate was different relative to a random sample of the surrounding state: surrounding state vs. surrounding state (negative control),
surrounding state-to-predicted state flicker, surrounding state-to-predicted state transition, and surrounding state vs. predicted state (n = 45 implantation sites, 9 animals). B, The mean
single unit firing rate of recorded circuits during a surrounding state, surrounding state-to-predicted state flicker, surrounding state-to-predicted state transition, and predicted state (n
= 45 implantation sites, 9 animals). Box plots show the intermediate quartiles with all points as swarm scatter colored by region. C) Mean scaled PC1 projections for the ten regions. For
each region surrounding state, predicted flicker state, flicker, and transition are shown. All recorded sites were utilized, except one site which only yielded a one single-unit, which is
insufficient for PCA (n = 44 implantation sites, 9 animals). To incorporate the n animals into estimated variance, error bars are the SEM multiplied by the square-root of n animals. See
Supplemental Tables 2-5 for significance of pairwise comparisons based on linear mixed effects model projection ~ sample type (that is flicker, transition, surrounding, predicted) + (1 |
animal) with post-hoc EMMeans with Tukey correction. Bonferroni multiple hypothesis correction was applied based on the number of regions. EXTENDED DATA FIG. 9 COMMON SIGNALS (EG., EMG, EOG)
DO NOT ACCOUNT FOR THE FAST EMBEDDING OF STATE OR FLICKERS. EMG, EOG, and noise events should impact all electrodes within a brain region. To test whether such common signals were the basis
of the embedding of state at fast timescales, we evaluated CNN performance and flickers in the context of a mean-subtracted version of our data. A, Example raw data (navy) are shown
alongside the average signal from the entire array (64 ch; purple). Note that the large, non-neuronal artifact at two seconds is obvious in the array-mean as well as on the single channel.
Subtracting the mean from the single channel removes the common artifact (orange), but preserves local spiking (amplitude ~ 50 μV). B, We passed the mean-subtracted single channel data into
the extant single channel models, which were trained on the broadband raw data. Tested on mean-subtracted data, the majority of models performed within 10% of their balanced accuracy when
tested on broadband data (teal points; gray band indicates region of equivalent broadband and mean-subtracted balanced accuracy +/- 10%). This was true for both 2.6 s and 40 msec models
(large and small points). Points below the 10% band represent models that either originally learned from shared signals, or models that were disabled by the distortion of the data. Note that
the teal points serve as an existence proof that, absent common signals, it is possible to identify brain state in local neural dynamics in 40 msec windows. It is likely that training new
models on mean-subtracted data would substantially improve the performance of all models. C, To test whether flickers were the result of common signals (such as EMG artifact) we cross
correlated disagreements between the CNN and human labels in two contexts: broadband data and mean-subtracted data. Cartoon of the two hypothesis to illustrate the expected results in the
null and alternative condition. D, Cross correlogram of flickers in broadband and mean subtracted data reveal a peak at zero lag, suggesting that there is a high correspondence of flicker
events between the two datasets. E, Example CNN predictions on the same time interval in broadband (top) and mean-subtracted data (bottom). EXTENDED DATA FIG. 10 ADDITIONAL EXAMPLES OF
FLICKERING BETWEEN STATES. Three exemplary flickers. Flickers are defined as high-confidence, non-global events that are not detected in low-pass models, and are distinct from transitions
between states. Top trace is neural broadband. Second row is human scoring of the corresponding state. Bottom five rows are outputs of independent CNNs trained in each of the four brain
regions recorded in the same animal. The black box in the left column indicates a NREM-to-wake flicker in primary motor cortex. The black box in the center column demonstrates a NREM-to-REM
flicker in primary visual cortex. The white box in the right column demonstrates a NREM-to-wake flicker in retrosplenial cortex. SUPPLEMENTARY INFORMATION SUPPLEMENTARY INFORMATION
Supplementary Tables 1–5 and Figs./legends 1–5. REPORTING SUMMARY RIGHTS AND PERMISSIONS Springer Nature or its licensor (e.g. a society or other partner) holds exclusive rights to this
article under a publishing agreement with the author(s) or other rightsholder(s); author self-archiving of the accepted manuscript version of this article is solely governed by the terms of
such publishing agreement and applicable law. Reprints and permissions ABOUT THIS ARTICLE CITE THIS ARTICLE Parks, D.F., Schneider, A.M., Xu, Y. _et al._ A nonoscillatory, millisecond-scale
embedding of brain state provides insight into behavior. _Nat Neurosci_ 27, 1829–1843 (2024). https://doi.org/10.1038/s41593-024-01715-2 Download citation * Received: 26 June 2023 *
Accepted: 19 June 2024 * Published: 15 July 2024 * Issue Date: September 2024 * DOI: https://doi.org/10.1038/s41593-024-01715-2 SHARE THIS ARTICLE Anyone you share the following link with
will be able to read this content: Get shareable link Sorry, a shareable link is not currently available for this article. Copy to clipboard Provided by the Springer Nature SharedIt
content-sharing initiative