Play all audios:
ABSTRACT Chip is a visual representation of rock breaking by cutter, and their related parameters are crucial for revealing the rock breaking mechanism in deep-sea mining. Based on sieving
and three-dimensional size measurement methods widely used in mining engineering, this paper reports a dataset of chip parameters for rock breaking by chisel pick under deep-sea hydrostatic
pressure. Specifically, we first designed an experimental setup that can accurately simulate deep-sea hydrostatic pressure, conducted rock breaking experiments and carefully collected chips.
Subsequently, those chips were sieved, high-resolution images were collected, and the coarseness index (_CI_), chip size uniformity (_n_), absolute chip size (_d_e), and fractal dimension
(_D_) were measured. Finally, three-dimensional size (long, intermediate and short) was measured for 3064 chips with particle sizes greater than 4.75 mm. This dataset will be used by
researchers to validate numerical simulations or optimize equipment structures related to deep-sea mining, including deep-sea rock mechanics, mining cutter and conveyor pipes. SIMILAR
CONTENT BEING VIEWED BY OTHERS ROTARY CUTTING TEST ON ROCK-BREAKING MECHANISM AND EFFICIENCY OF MILLED-TOOTH ROLLING CUTTERS FOR SHAFT SINKING BY DRILLING METHODS Article Open access 26 May
2025 THE IMPORTANCE OF THE SURFACE ROUGHNESS AND RUNNING BAND AREA ON THE BOTTOM OF A STONE FOR THE CURLING PHENOMENON Article Open access 26 November 2020 RESEARCH ON THE ROCK CUTTING
PERFORMANCE AND FEASIBILITY VERIFICATION OF SMALL-SCALE ROTARY CUTTING TEST FOR DISC CUTTER Article Open access 19 November 2024 BACKGROUND & SUMMARY The marine environment hosts a
diverse range of mineral resources, encompassing not only traditional oil and natural gas, but also various underrecognized and underutilized minerals1. As the demand for mineral resources
continues to grow while land-based resources become increasingly depleted, the exploration of seabed resources has emerged as a pivotal strategy to alleviate the global resource deficit. The
deep-sea, typically situated 200 meters below sea level, represents one of the largest and most challenging-to-access biological habitats on Earth. Nonetheless, deep-sea mining has
attracted global attention, prompting national mining companies and scientific research institutes to pursue reasoned approaches to deep-sea mining2,3. Currently, the predominant mining
method for rock-based polymetallic sulfides (PMS) is the Pipe-Lift Mining System, which involves mining vehicle, pipe, and sea support vessel4. It is worth noting that research on rock
fragmentation in the deep-sea environment plays a critical role in enhancing both mining efficiency and subsequent processes. Given the importance of preserving the delicate ecological
balance during deep-sea mining operations5, the conventional blasting method is deemed unsuitable. On the contrary, mechanical mining is considered more feasible. During the process of rock
breaking with mechanical cutting tools, a large amount of mineral chips is generated6. Nevertheless, the deep-sea hydrostatic pressure imposes constraints on large-scale rock extraction7,8.
Research on rock breaking under hydrostatic pressure is still in its primary stages. In order to comprehensively explore the mechanisms, accurate simulation of rock breaking under
hydrostatic pressure is essential. However, the inherent complexity of deep-sea environment presents significant challenges in obtaining well-constrained field-scale rock breaking datasets.
Consequently, meticulously controlled and reproducible laboratory experiments play a pivotal role in understanding and validating the process of rock breaking under hydrostatic pressure.
Rock chip is an apparent phenomenon of rock breaking by cutter9. Parameters associated with rock chips, such as the coarseness index (_CI_), chip size uniformity (_n_), absolute chip size
(_d_e), and fractal dimension (_D_), offer valuable insights into the mechanisms and efficiency of rock breaking10,11,12. These parameters are instrumental in validating the rationality of
simulations13,14. Therefore, the study of chip parameters is well-established in land geotechnical engineering contexts, including mining15, tunneling16, and dredging17 processes.
Furthermore, in the context of conveying broken minerals through pipelines using pneumatic or hydraulic methods, mineral size plays a critical role18. For instance, The Japan Oil, Gas and
Metals National Corporation (JOGMEC) conducted successful tests for pipeline conveying of deep-sea broken minerals, focusing on conveying a maximum mineral size of 30 mm19,20. As such, the
chip parameters resulting from rock breaking under hydrostatic pressure hold significance for the design and optimization of conveying pipelines. Unfortunately, detailed experimental data
pertaining to rock breaking chip parameters under hydrostatic pressure are scarce due to the high costs associated with deep-sea hydrostatic pressure simulation experimental platforms.
Therefore, conducting rock breaking experiments under hydrostatic pressure to obtain meaningful data on chip parameters in laboratory settings is paramount. This is particularly rare in the
field of deep-sea mining, especially with experiments conducted under authentic hydrostatic pressure. As a result, an experimental dataset describing chip parameters for rock breaking holds
substantial value. Based on this background, the Engineering Research Center of Dredging Technology of Hohai University has designed a deep-sea hydrostatic pressure rock cutting experimental
platform. This innovative platform can precisely replicate rock breaking at various cutting depths under hydrostatic pressure. As a result of this technological advancement, the rock
breaking chip parameters have been meticulously compiled into a dataset, encompassing essential metrics such as _CI_, _n_, _d_e, _D_ and three-dimensional size (long, intermediate and
short). This dataset will offer invaluable experimental data for understanding the variation of rock chip parameters under hydrostatic pressure. Furthermore, it can be utilized to validate
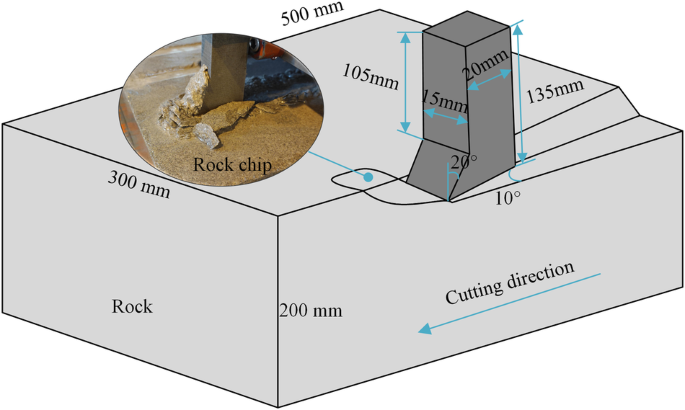
rock breaking simulations, enhance deep-sea rock mechanics theories, and optimize pipeline lifting systems for the advancement of deep-sea mining equipment. METHODS ROCK SAMPLE AND CHISEL
PICK The sandstones utilized in the experiments, as depicted in Fig. 1, were sourced from the same mining area and uniformly cut to dimensions of 500 mm × 300 mm × 200 mm. Following
measurement, it was determined that the rock surfaces exhibited favorable flatness and isotropy, ensuring consistent cutting depth during the rock cutting process with the chisel pick. The
chisel pick, a commonly employed rock-breaking tool, was geometrically crafted via wire cutting to meet specified parameter sizes. Due to its exceptional rock-breaking capabilities, the
chisel pick is widely utilized in mineral resource mining, prompting numerous researchers to investigate its rock-breaking characteristics and mechanisms21,22,23,24. The performance of both
the rock and the chisel pick underwent testing, and the findings are summarized in Table 1. The rock mechanics tests were performed in accordance with the available ASTM standards25. The
material chosen for the chisel pick is high-speed steel, the mechanical properties of which are based on standardized test methods for common metallic materials26,27. EXPERIMENTAL SET-UP The
main components of the deep-sea hydrostatic pressure rock cutting experimental platform are rock cutting system, acquisition&control system and hydrostatic pressure loading system. Its
main structure is shown in Fig. 2. The rock cutting device is composed of several key elements, including the chisel pick, cutter base, cutter holder, rock, rock box, nylon strips, and
propulsion cylinder. The chisel pick is affixed to the cutter base and can be readily adjusted to the desired cutting position. The rock is securely positioned within the rock box, with the
cutting depth adjustable by adding varying thicknesses of steel plates to the rock box. The cutting motion is initiated by the propulsion cylinder, which is powered by the hydraulic pump
station. Nylon strips are placed beneath the rock box to diminish friction resistance during linear movement. The rock cutting equipment is designed with pulleys at the base, enabling rapid
entry and exit through the guide rails inside and outside the high-pressure tank. Effective sealing of the high-pressure tank is achieved through the collaboration of the hatch and arms.
When the rock cutting device is pushed into the high-pressure tank, the control system orchestrates the hatch to connect with the high-pressure tank, after which the arms close. Throughout
the rock cutting process, the data acquisition and control system gathers cutting speed and hydrostatic pressure parameters, ensuring the stable operation of the cutting process. The
operational principles underlying both the hydrostatic pressure loading and rock cutting motion are visually depicted in Fig. 3. The hydraulic pump station propels the pertinent structures
through components #2, #3, and #4 to achieve high-pressure tank sealing. The hatch incorporates multiple layers of seals, permitting hydrostatic pressures of up to 20 MPa within the
high-pressure tank. Hydrostatic pressure is generated using a high-pressure pump. During the hydrostatic pressure loading process, valves C and D are closed, and valve B is opened to fill
the tank with water before being closed, Valve E is the drain port and is also closed during the experiment. Subsequently, the high-pressure pump injects water into the high-pressure tank,
causing an increase in pressure. If the water level in the tank is low at this time, valve A is opened to ensure timely replenishment to maintain a high water level. As the high-pressure
tank’s internal hydrostatic pressure reaches the predetermined value, the system enters the pressure stabilization stage. During this phase, the control system dynamically adjusts the
pressure relief valve C based on real-time pressure readings from sensors A and C, allowing for the discharge of water from the high-pressure tank to the water tank, thus achieving dynamic
stabilization of hydrostatic pressure. Once hydrostatic pressure is stabilized, hydraulic pump station #1 connects to the rock cutting device inside the tank via the external interface of
the high-pressure tank, thereby initiating the rock cutting process. It is important to note that the extension of the hydraulic actuator occupies space, potentially causing a surge in
hydrostatic pressure within the high-pressure tank. Consequently, during the rock cutting phase, relief valve D is opened to balance the surge in hydrostatic pressure. Upon completion of the
experiment, the control system fully opens pressure relief valve C to reduce the hydrostatic pressure to a safe level. Following this, valve E is opened to drain the water from the
high-pressure tank. To ensure the stable operation of the hydrostatic pressure loading system, Table 2 provides a comprehensive summary of the technical parameters of the main components
within the hydrostatic pressure loading system. EXPERIMENTAL PROTOCOL The experiments involved varying cutting depths (3 mm, 6 mm, 9 mm, 12 mm, and 15 mm) and hydrostatic pressures (3 MPa, 6
MPa, 9 MPa, and 12 MPa). To comprehensively characterize the rock-breaking chip parameters under hydrostatic pressure, corresponding cutting depth experiments under atmospheric pressure
were also conducted. These specific experimental parameters effectively capture the variation of rock-breaking chip parameters under hydrostatic pressure in deep-sea conditions. The complete
experimental process encompasses rock breaking, chip collection, sieving, and measurement. ROCK BREAKING UNDER HYDROSTATIC AND ATMOSPHERIC PRESSURE The detailed steps of rock breaking under
different pressures are summarized as Fig. 4. ROCK BREAKING CHIP COLLECTION, SIEVING AND MEASUREMENT To ensure the accuracy of the chip analysis, we divide the chip handling process into
three steps, including collection, sieving and measurement, as shown in Fig. 5. The chips from each rock breaking experiment need to be carefully collected and placed in clear bags labeled
with serial numbers. In a hydrostatic pressure environment, all the rock chips will collect in the cutting path due to the resistance limitations of the water surrounding the rock. While
under atmospheric pressure, some of the chips will be ejected. In order to collect the chip better, we added a transparent shield around the equipment. Experiments show that the shield can
confine all the falling chips to a smaller area and improve the collection efficiency. Upon completion of all experiments, the collected chips undergo a sieving process illustrated in Fig.
6. Given the high water content of the collected rock chips, they require drying to facilitate effective sieving. When the drying temperature is too low, the chips cannot dry effectively,
increasing the drying cycle. When the temperature is too high, the high temperature will cause damage to the chips due to rapid drying, which is not conducive to the measurement of the
chips. To prevent secondary damage to the chips from high temperatures, the oven temperature is maintained at 105 °C during a 24-hour drying period, as depicted in Fig. 6(a). Subsequently,
nine sieve apertures are selected, and the rock chips are sieved for five minutes utilizing a sieving machine with a vibration frequency of 120 Hz, as shown in Fig. 6(b). The sieved chips
are then categorized into nine intervals based on the aperture of the screen mesh, as evidenced in Fig. 6(c). Figure 6(d) provides insight into the distribution of chips within the nine
intervals under each experimental scenario post-sieving, effectively reflecting chip variations under different hydrostatic pressures. For the final chip measurement, an electronic scale is
employed to weigh and record chips in each interval. Following this, the three-dimensional size (long, intermediate, short) of the chips are measured using digital calipers, as indicated in
Fig. 6(e). Weighing of chips is conducted for all chip size intervals, while the measurement of the three-dimensional size is specifically carried out for 3064 pieces of chip with particle
sizes exceeding 4.75 mm. This selection criterion is attributed to the fact that excessively small chips cannot be accurately measured and do not sufficiently represent the morphological
changes of rock chips under hydrostatic pressure. CHIP ANALYSIS Analysis of chip size and shape has been widely used in many scientific and engineering studies to determine the fundamental
properties of chip and their effects on specific processes. Common methods for analyzing chip parameters are described below. COARSENESS INDEX The coarseness index (_CI_) is a convenient
test method for analyzing the distribution of chips and their size. _CI_ was utilized by Barker28 in engineering techniques. In his earlier comparative study, he found that a higher _CI_
value indicates a larger block of chip. It is calculated by summing the cumulative weight percentage of rock chip retained on each sieve through the sieve mesh. The _CI_ value is calculated
by Eq. (1) and is a dimensionless parameter. $$CI=100\mathop{\sum }\limits_{{\rm{i}}=1}^{{N}_{c}}\frac{{M}_{i}}{{M}_{T}}$$ (1) where _M__i_ is the weight of rock chip whose size is larger
than sieve aperture _r__i_, _M__T_ is the total weight of chip for this sieving, _N__c_ is the number of sieve type used. ROSIN-RAMMLER FUNCTION The Rosin-Rammler method is often used to
analyze the generation of rock breaking & cutting in the tunneling and mineral processing industries29. The distribution of rock chips can also be examined by using the function.The
Rosin-Rammler function describes the mass distribution function as an equation in exponential form. The Rosin-Rammler equation is stated as Eq. (2). $$\log
\left[ln\left(\frac{100}{R}\right)\right]=n\,\log \,r-n\,\log \,{d}_{e}$$ (2) Where, _R_ (%) is the cumulative mass retained on the sieve aperture _r__i_, _d_e (mm) is the chip size
parameter defined as the chip size when _R_ = 36.79% (by weight). _n_ is the chip size distribution parameter defined as rock chip size uniformity. Therefore _n_ represents the degree of
size difference between chips, the larger _n_, the more uniform size between the debris. The calculation of _n_ and _d_e can be plotted in the form of a linear function of Eq. 2, the slope
is _n_ and the intercept are -_n_log_d_e. FRACTAL FUNCTION Fractal geometry was originally used to describe highly irregular and self-similar objects30. The macroscopic fragmentation of rock
materials under loading is characterized by a small group of chips, while smaller fractures consist of smaller cracks evolving and aggregating, and this similar behavior leads to
self-similarity of chip. Therefore, fractal theory have been applied to the field of rock fragmentation and a lot of researches have been carried out. The fractal theory is utilized to
calculate the fractal dimension (_D_) of the fragments demonstrated as shown in Eq. (3). $$ln\left(\frac{{M}_{{\rm{r}}}}{{M}_{{\rm{T}}}}\right)=(3-D)\,ln\left(\frac{r}{{r}_{\max }}\right)$$
(3) Where, _M__r_ is the cumulative mass of rock chip passing through a given sive aperture _r_, _M_T is the total mass of chips, and _r_max is the maximum sive aperture. It can be seen that
Eq. (3) is a linear function with a slope factor of 3-_D_. Therefore, based on the sieving results of the rock chip, the fractal dimension _D_ can be obtained. The fractal dimension
reflects the degree of rock breaking, the larger _D_, the higher proportion of small chip sizes. _Chip shape_ Particle shape is another fundamental property that can provide important
information about rock chip. As with particle size, the shape of minerals and rock chip may be determined by a variety of factors, such as an expression of the overall appearance of the
particle, the aspect ratio of the particle; roundness, the degree of roundness or angularity of the edges of the particle; and sphericity, a measure of how closely the shape of the particle
approximates that of a true sphere. However, the shape of the chip cannot be measured visually, and several formulas are commonly used to determine the shape of the particles. In the dataset
of this paper, Based on the three-dimensional dimensions (L, I and S) of the debris measured by the digital vernier calipers in Fig. 6(e), the ratios S/L, (L-I)/(L-S) and I/L were
calculated and plotted in a ternary diagram. Finally, we categorized the shape of chip into 10 categories based on Zingg31, Sneed32 and Mohammadi29, as shown in Fig. 7. DATA RECORDS The
dataset is obtained from https://doi.org/10.6084/m9.figshare.2510284733. To facilitate quick access, the data storage structure is designed as shown in Table 3. The “README” folder that
describe the structure, the information within each folder, and give information about the symbols and abbreviations used in the data tables. The “Sieving and Measuring” folder organizes the
raw rock chip data of different experimental groups, including the weight of chip retained by different sive aperture and the three-dimensional size of chip with a sive aperture larger than
4.75 mm. The “Hydrostatic pressure” folder records the rock chips displacement and hydrostatic pressure changes under different hydrostatic pressure loading environments, which will
facilitate the data users to inquire about the environmental factors of chip production. The “Chip shape” folder organizes the shape parameters of 3064 chips according to hydrostatic
pressure. The “Photo” folder contains images of rock chip from each experimental group. The picture in the folder are named “P + H”, which represent the hydrostatic pressure (MPa) and
cutting depth (mm), respectively. _CI_, _D_, _n_, and _d_e describing the parameters of the chip were stored in .xlsx file format, respectively. TECHNICAL VALIDATION The precise control of
hydrostatic pressure plays a crucial role in ensuring the validity of the experimental data. Despite stable control of the hydrostatic pressure at the designated set value (_t_0 ~ _t_1)
throughout all experiments, a minor fluctuation range was observed during the cutting process, as visually depicted in Fig. 8. Analysis of the measured hydrostatic pressure detection curves
confirms that the hydrostatic pressure loading system adeptly manages the fluctuation range of the hydrostatic pressure, thereby meeting the essential experimental criteria. A potential
source of error in the experiment could have stemmed from the collection and measurement of rock chips. The process of cutting rock at atmospheric pressure is often accompanied by acoustic
noise and the rapid ejection of large rock fragments. To mitigate this, a transparent shield was installed on the rock cutting device for containment of the generated rock chips. This method
effectively controlled the collection of rock chips at atmospheric pressure, minimizing experimental errors. However, when the rock cutting device was introduced into the high-pressure tank
for hydrostatic pressure loading, the rock chips produced were obstructed by the surrounding water and remained affixed to the rock surface. Following the conclusion of the experiment, no
chips were found inside the autoclave across all experimental groups. Furthermore, the fine powder resulting from the cutting process adhered to the rock surface and necessitated drying
before chip collection. It is plausible that a marginal amount of fine powder may have been lost during the collection process, although this was considered insignificant in comparison to
the overall chip sample. The three-dimensional size of the chips was measured using digital vernier calipers with a precision of 0.01 mm. To evaluate test reproducibility, repeated
measurements were performed, yielding differences of no more than 0.05 mm, which was deemed sufficiently accurate for three-dimensional chip size measurement. In this paper, the measurement
of the three-dimensional size of the chips (long, intermediate and short) was standardized, so the measurement error is largely due to the measurement tool. Any piece of chip collected in
the experiment was taken for 10 measurements and its three-dimensional size are shown in Fig. 9. The measuring tool used in the experiment is a digital vernier caliper with an accuracy of
0.01 mm, and the repeated measurements of the three-dimensional size of the chips using this tool show that the measurement errors of the three-dimensional size of chips are within 0.05 mm.
Considering that the smallest chip size is 4.75 mm, this equates to an error of less than 1%. Additionally, some of the chip parameter analyses were discussed in7 based on the dataset.
Examples of chip parameters are shown in Fig. 10, providing meaningful insights into rock breaking chip parameters under hydrostatic pressure. Figure 10(a,b) represents the Rosin-Rammler
function and Fractal function fitting results, respectively, which demonstrate a good linear relationship (R2 > 0.9) and can be well used for calculating chip size uniformity, absolute
chip size, and fractal dimension. Figure 10(c–e) show the chip three-dimensional size for the raw data of the chip size and shape analysis. Figure 10(f) shows the three-dimensional average
size under the influence of hydrostatic pressure, which exhibits a good relationship and further validates the data. Figure 10(g) shows the ternary plot of the chip shapes, which can well
analyze the change and distribution of the chip shape under different hydrostatic pressures based on the criterion of chip shape delineation. Consequently, the conclusions drawn from the
analyses affirmed the validity and reproducibility of the measurements. USAGE NOTES The dataset can be utilized to calculate and analyze rock chip parameters, offering valuable insights for
the design of deep-sea mining equipment such as pipes and cutterheads. Furthermore, it can contribute to a better understanding of deep-sea rock mechanics. The data can be analyzed in
diverse ways to facilitate its use and further development. While this paper presents some common methods of analyzing the data, it can also be subject to statistical analysis for
comprehensive exploration. CODE AVAILABILITY The data in this paper was organized based on Microsoft Excel 2016 and the original data record format (.xlsx) was provided, which will make it
easy for the user to import into any of the data analysis software such as Matlab, Python, and SPSS. No custom code was used in this study to organize or validate the dataset. REFERENCES *
Petersen, S. _et al_. News from the seabed–Geological characteristics and resource potential of deep-sea mineral resources. _Mar. Policy_ 70, 175–187 (2016). Article Google Scholar * Liu,
Z. _et al_. Deep-sea rock mechanics and mining technology: State of the art and perspectives. _Int. J. Min. Sci. Technol._ 33, 1083–1115 (2023). Article Google Scholar * Sha, F. _et al_. A
recent review on multi-physics coupling between deep-sea mining equipment and marine sediment. _Ocean Eng._ 276, 114229 (2023). Article Google Scholar * Sharma, R. _Deep-Sea Mining:
Resource Potential, Technical and Environmental Considerations_. (Springer, 2017). * Gilbert, N. Deep-sea mining threatens jellyfish, suggests first-of-its-kind study. _Nature_ (2023). *
Menezes, P. L., Lovell, M. R., Avdeev, I. V. & Higgs III, C. F. Studies on the formation of discontinuous rock fragments during cutting operation. _Int. J. Rock Mech. Min. Sci._ 71,
131–142 (2014). Article Google Scholar * Liu, Z., Lv, R., Kong, C., Liu, K. & Wei, C. Experimental study on rock breaking by single chisel pick under deep-sea hydrostatic pressure.
_Ocean Eng._ 285, 115262 (2023). Article Google Scholar * Grima, M. A., Miedema, S., Van de Ketterij, R., Yenigül, N. & Van Rhee, C. Effect of high hyperbaric pressure on rock cutting
process. _Eng. Geol._ 196, 24–36 (2015). Article Google Scholar * Aresh, B., Khan, F. N. & Haider, J. Experimental investigation and numerical simulation of chip formation mechanisms
in cutting rock-like materials. _J. Pet. Sci. Eng._ 209, 109869 (2022). Article CAS Google Scholar * Bejari, H. & Hamidi, J. K. An Experimental Study of Water Saturation Effect on
Chipping Efficiency of a Chisel Pick in Cutting Some Low-and Medium-Strength Rocks. _Rock Mech. Rock Eng._ 56, 4507–4533 (2023). Article ADS Google Scholar * Wang, X., Su, O. & Wang,
Q. Distribution characteristics of rock chips under relieved and unrelieved cutting conditions. _Int. J. Rock Mech. Min. Sci._ 151, 105048 (2022). Article Google Scholar * Jeong, H. &
Jeon, S. Characteristic of size distribution of rock chip produced by rock cutting with a pick cutter. _Geomech Eng_ 15, 811–822 (2018). Google Scholar * Yang, D. _et al_. The shape
parameters of coal and gangue particles derived from 3D scanning. _Sci. Data_ 10, 107 (2023). Article PubMed PubMed Central Google Scholar * Saloustros, S. _et al_. Geometrical digital
twins of the as-built microstructure of three-leaf stone masonry walls with laser scanning. _Sci. Data_ 10, 533 (2023). Article PubMed PubMed Central Google Scholar * Prakash, A.,
Murthy, V., Singh, K., Kumar, C. & Kumaraswamidhas, L. A methodology for designing cutting drum of surface miner to achieve production of desired chip size. _Sādhanā_ 45, 1–9 (2020).
Article Google Scholar * Yin, L., Miao, C., He, G., Dai, F. & Gong, Q. Study on the influence of joint spacing on rock fragmentation under TBM cutter by linear cutting test. _Tunn.
Undergr. Space Technol._ 57, 137–144 (2016). Article Google Scholar * Wang, H., Liu, S., Qu, X., Zhan, R. & Liao, Z. Field investigations on rock fragmentation under deep water through
fractal theory. _Measurement_ 199, 111521 (2022). Article Google Scholar * Yajuan, K. & Liu, S. Summary of Research on Lifting System of Deep Sea Mining. _J. Mech. Eng._ 57, 232–243
(2021). Article Google Scholar * Kawano, S. & Furuya, H. Mining and processing of seafloor massive sulfides: Experiences and challenges. _Perspect. Deep-Sea Min. Sustain. Technol.
Environ. Policy Manag_. 167–197 (2022). * Yamaji, N., Okamoto, N., Shiokawa, S., Kawano, S. & Sakurai, H. Achievement for pilot test of excavating and ore lifting conducted for seafloor
polymetallic sulphides-world’s first success in continuous ore lifting test for seafloor polymetallic sulphides. _J. MMIJ Web_ 135, 42–51 (2019). Article Google Scholar * Hashiba, K.,
Fukui, K., Miyazaki, K. & Watanabe, K. Mechanical and cutting characteristics of cobalt-rich ferromanganese crusts. _Rock Mech. Rock Eng._ 53, 2929–2934 (2020). Article ADS Google
Scholar * Ouyang, Y., Chen, X., Yang, Q., Xu, Y. & Qiu, Y. Experimental study on sandstone rock cutting with chisel picks. _Rock Mech. Rock Eng._ 54, 1609–1619 (2021). Article ADS
Google Scholar * Su, O. Numerical modeling of cuttability and shear behavior of chisel picks. _Rock Mech. Rock Eng._ 52, 1803–1817 (2019). Article ADS Google Scholar * Hood, M. &
Alehossein, H. A development in rock cutting technology. _Int. J. Rock Mech. Min. Sci._ 37, 297–305 (2000). Article Google Scholar * Astm, D. 4543-08. Standard Practices for Preparing Rock
Core as Cylindrical Test Specimens and Verifying Conformance to Dimensional and Shape Tolerances. _ASTM Int. West Conshohocken PA USA_ (2008). * Schweitzer, P. A. _Metallic Materials:
Physical, Mechanical, and Corrosion Properties_. vol. 19 (CRC press, 2003). * McKeighan, P. C. Testing of Metallic Materials. _Handb. Mater. Sel_. 517–543 (2002). * Barker, J. A laboratory
investigation of rock cutting using large picks. in vol. 1 519–534 (Elsevier, 1964). * Mohammadi, M., Khademi Hamidi, J., Rostami, J. & Goshtasbi, K. A closer look into chip shape/size
and efficiency of rock cutting with a simple chisel pick: a laboratory scale investigation. _Rock Mech. Rock Eng._ 53, 1375–1392 (2020). Article ADS Google Scholar * Mandelbrot, B. B.
& Mandelbrot, B. B. _The Fractal Geometry of Nature_. (WH freeman New York, 1982). * Zingg, T. Beitrag zur schotteranalyse. (1935). * Sneed, E. D. & Folk, R. L. Pebbles in the lower
Colorado River, Texas a study in particle morphogenesis. _J. Geol._ 66, 114–150 (1958). Article ADS Google Scholar * Liu, Z. _et al_. A dataset describing chip parameters for rock
breaking by chisel pick under deep-sea hydrostatic pressure. _Figshare_ https://doi.org/10.6084/m9.figshare.25102847.v1 (2024). Download references ACKNOWLEDGEMENTS This study is supported
by the China Postdoctoral Science Foundation (2021M690879), the National Natural Science Foundation (52371275), the Chinese Fundamental Research Funds for the Central Universities
(B230203007), and the Changzhou Applied Basic Research Program (CJ20230044). AUTHOR INFORMATION AUTHORS AND AFFILIATIONS * Engineering Research Center of Dredging Technology, Hohai
University, Changzhou, 213022, Jiangsu, China Zenghui Liu, Rui Lv, Xinlei Chen & Changyun Wei * College of Mechanical and Electrical Engineering, Hohai University, Changzhou, 213022,
Jiangsu, China Zenghui Liu, Rui Lv, Xinlei Chen & Changyun Wei * Department of Engineering Science, University of Oxford, Parks Road, Oxford, OX1 3PJ, UK Kai Liu * Changjiang Nanjing
Waterway Engineering Bureau, Nanjing, China Peng Wu Authors * Zenghui Liu View author publications You can also search for this author inPubMed Google Scholar * Rui Lv View author
publications You can also search for this author inPubMed Google Scholar * Xinlei Chen View author publications You can also search for this author inPubMed Google Scholar * Kai Liu View
author publications You can also search for this author inPubMed Google Scholar * Peng Wu View author publications You can also search for this author inPubMed Google Scholar * Changyun Wei
View author publications You can also search for this author inPubMed Google Scholar CONTRIBUTIONS H.Z. conceptualized the study, overall publication design and review. H.Z. acquisition
system design, project management. R.L. data set creation, validation and uploading. R.L. and H.Z. wrote the manuscript. R.L. designed and planned the experiments. R.L. and X.L. performed
the experiments and measured the data. K.L. and W.Y. supervised the experiments and revised the manuscript. P.W. provided the experimental materials and measured the mechanical properties.
All authors read and approved the manuscript. Also, thanks to Wang Xiao for taking and processing photos of the chips in the database. CORRESPONDING AUTHOR Correspondence to Rui Lv. ETHICS
DECLARATIONS COMPETING INTERESTS The authors declare that they have no known competing fnancial interests or personal relationships that could have appeared to infuence the work reported in
this paper. ADDITIONAL INFORMATION PUBLISHER’S NOTE Springer Nature remains neutral with regard to jurisdictional claims in published maps and institutional affiliations. RIGHTS AND
PERMISSIONS OPEN ACCESS This article is licensed under a Creative Commons Attribution 4.0 International License, which permits use, sharing, adaptation, distribution and reproduction in any
medium or format, as long as you give appropriate credit to the original author(s) and the source, provide a link to the Creative Commons licence, and indicate if changes were made. The
images or other third party material in this article are included in the article’s Creative Commons licence, unless indicated otherwise in a credit line to the material. If material is not
included in the article’s Creative Commons licence and your intended use is not permitted by statutory regulation or exceeds the permitted use, you will need to obtain permission directly
from the copyright holder. To view a copy of this licence, visit http://creativecommons.org/licenses/by/4.0/. Reprints and permissions ABOUT THIS ARTICLE CITE THIS ARTICLE Liu, Z., Lv, R.,
Chen, X. _et al._ A dataset describing chip parameters for rock breaking by chisel pick under deep-sea hydrostatic pressure. _Sci Data_ 11, 571 (2024).
https://doi.org/10.1038/s41597-024-03419-5 Download citation * Received: 30 January 2024 * Accepted: 24 May 2024 * Published: 04 June 2024 * DOI: https://doi.org/10.1038/s41597-024-03419-5
SHARE THIS ARTICLE Anyone you share the following link with will be able to read this content: Get shareable link Sorry, a shareable link is not currently available for this article. Copy to
clipboard Provided by the Springer Nature SharedIt content-sharing initiative