Play all audios:
ABSTRACT The three major anatomic regions of the human kidney include the cortex, medulla and papilla, with different functions and vulnerabilities to kidney diseases. Epigenetic mechanisms
underlying these anatomic structures are incompletely understood. Here, we performed chromatin conformation capture with Hi-C and histone modification H3K4me3/H3K27me3 Cleavage Under Targets
and Release Using Nuclease (CUT&RUN) sequencing on the kidney cortex, medulla and papilla dissected from one individual donor. Nuclear suspensions were generated from each region and
split subjected to paired Hi-C and CUT&RUN sequencing. We evaluated the quality of next-generation sequencing data, Hi-C chromatin contact matrices and CUT&RUN peak calling. H3K4me3
and H3K27me3 histone modifications represent active and repressive gene transcription, respectively, and differences in chromatin conformation between kidney regions can be analyzed with
this dataset. All raw and processed data files are publicly available, allowing researchers to survey the epigenetic landscape across regional human kidney anatomy. SIMILAR CONTENT BEING
VIEWED BY OTHERS THE CHROMATIN LANDSCAPE OF HEALTHY AND INJURED CELL TYPES IN THE HUMAN KIDNEY Article Open access 10 January 2024 SINGLE CELL TRANSCRIPTIONAL AND CHROMATIN ACCESSIBILITY
PROFILING REDEFINE CELLULAR HETEROGENEITY IN THE ADULT HUMAN KIDNEY Article Open access 13 April 2021 UNRAVELING THE EPIGENETIC CODE: HUMAN KIDNEY DNA METHYLATION AND CHROMATIN DYNAMICS IN
RENAL DISEASE DEVELOPMENT Article Open access 29 January 2024 BACKGROUND & SUMMARY The human kidneys play an essential role in waste removal, fluid balance, blood pressure regulation and
multiple endocrine functions. Chronic kidney disease is characterized by kidney function decline and affects over 800 million individuals worldwide1,2,3,4. The cortex, medulla and papilla
are three major anatomic structures of the human kidney. The three regions contain different populations of kidney cell types and present distinct vulnerability to various kidney diseases.
For example, proximal tubular cell, predominantly present in the kidney cortex, is the major target of diabetic kidney disease and drug responses5,6,7,8. The kidney medulla and papilla, on
the other hand, are more susceptible to cystic kidney disease, autosomal-dominant tubulointerstitial kidney disease and renal hypodysplasia9. Therefore, understanding the multiomic
signatures of these different kidney anatomic regions is crucial to identify new therapeutic targets. Gene expression in mammalian cells is precisely controlled by epigenetic mechanisms such
as chromatin modifications and regulation of 3-dimensional (3D) chromatin architectures10,11,12,13,14,15. We recently profiled transcriptomics, open chromatin accessibility and metabolomics
profiles from cells of cortex, medulla and papilla in human kidneys16,17, but other epigenomic modalities, including chromatin conformation18 and histone modification19 profiles, across
these kidney anatomic regions, remain unexplored. Although the 3D chromatin architecture or histone modifications such as H3K4me3 and H3K27Ac have been profiled in primary human kidney
tissues20,21,22,23,24, these studies only included the cortex in their sample cohorts. A recent study successfully performed Hi-C (a technology of chromatin conformation capture) on human
kidney cortex and medulla samples25, but histone modification profiling was still lacking. A major challenge in profiling both chromatin conformation and histone modifications from the same
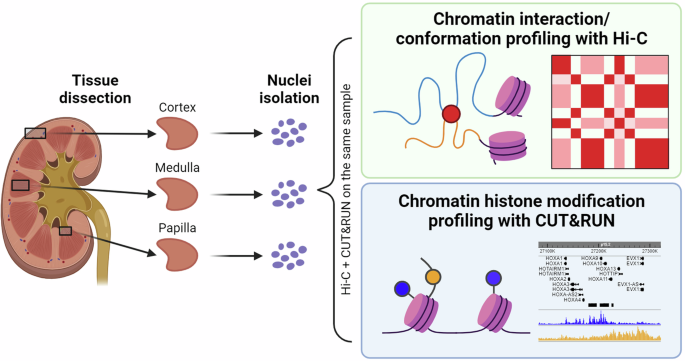
sample is that sequencing each modality requires a large number of cells or nuclei as input in library preparation. Here, we leveraged our recently described high-yield nuclei extraction
method26,27 and performed Hi-C and Cleavage Under Targets and Release Using Nuclease (CUT&RUN) sequencing of histone modifications (H3K4me3 and H3K27me3) in parallel on the kidney
cortex, medulla and papilla samples dissected from one individual donor (Fig. 1). This dataset of simultaneous profiling of chromatin conformation and histone modifications is publicly
available28,29, allowing investigation of the epigenetic landscape across regional human kidney anatomy. METHODS DONOR DESCRIPTION This research complies with all relevant ethical
regulations and has been approved by the Washington University Institutional Review Board. Human kidney cortex, medulla and papilla tissue samples were obtained from the Washington
University Kidney Translational Research Core Biobank with consent managed by the core. The kidney sample was discarded for transplantation and was from a deceased organ donor (67-year-old
female). These studies were approved by the Washington University in St. Louis Institutional Review Board, protocol #201601020. This approval included consent to publish genomic data. The
donor has a normal kidney function, with creatinine level at sampling as 0.6 mg/dL and with mild interstitial fibrosis. All tissues samples were frozen with liquid nitrogen and stored at −80
°C before use. To be noted, the aim of this study is to provide a high-quality paired Hi-C and CUT&RUN sequencing dataset on a healthy human control, instead of including a large cohort
of samples to generate new biological hypotheses. NUCLEAR SUSPENSION GENERATION Generation of nuclear suspension from frozen kidney samples was performed as previously described with minor
modifications26,27. Briefly, Nuclei EZ Lysis Buffer (NUC101, Sigma) was supplemented with EDTA-free protease inhibitor tablets (5892791001, Roche). Tissues were exposed to the ice-cold lysis
buffer, minced with a razor blade and homogenized with Dounce Tissue Grinders (885303-0002, Kimble) with the large pestle. The homogenate was filtered through a 200-µm Mini Strainer
(43-10200-60, pluriSelect) and cell homogenization was performed with the Dounce Tissue Grinder again with the small pestle. The homogenate was incubated in the buffer for 3 minutes and then
filtered through a 40-µm Mini Strainer (43-10040-60, pluriSelect). The homogenate was centrifuged at 500 × g for 4 minutes at 4 °C and the pellet was resuspended with the lysis buffer.
After 5-minute incubation, the suspension was centrifuged at 500 × g for 4 minutes at 4 °C and the nuclei pellet was resuspended with 2 mL nuclei buffer (10 mM Tris-HCl pH 7.5, 10 mM NaCl, 3
mM MgCl2) supplemented with 3% BSA (B9000S, NEB) by pipetting 10 times. The concentration of nuclear suspension was counted with a Countess Automated Cell Counter. HI-C LIBRARY GENERATION
Hi-C was performed with the Arima-HiC kit (A510008, Arima Genomics) following the manufacture’s manual with minor changes. Briefly, we transferred 5–7 million fresh nuclei and reconstituted
the volume to 5 mL with nuclei buffer (10 mM Tris-HCl pH 7.5, 10 mM NaCl, 3 mM MgCl2) supplemented with 3% BSA (B9000S, NEB). Then, crosslinking was performed according to the manufacture’s
protocol (“Crosslinking – Standard Input” section in A160134 v01) by adding 286 µL 37% formaldehyde (final concentration 2%). The BSA-supplemented nuclei buffer was consistently used during
nuclei washes. Nuclei were aliquoted with 1 million nuclei per aliquot and stored at −80 °C for subsequent reactions. Each aliquot containing 1 million nuclei is considered as a replicate
and we included two replicates for each kidney anatomic region in this study. The 1-million nuclei pellet was resuspended with 25 µL nuclease-free water and 20 µL was proceeded with the
manufacture’s protocol (“Arima-HiC Protocol” section in A160134 v01) for restriction enzyme digestion, end filling, ligation and purification. Hi-C library preparation was performed with the
Arima Library Prep Kit v2 (A303011, Arima Genomics) with minor changes. Briefly, DNA fragmentation was performed with a Diagenode Bioruptor Pico device (6-7 cycles of 15 seconds’ on and 90
seconds’ off on 100 µL DNA products). DNA size selection, biotin enrichment and library amplification were performed according to the manufacture’s protocol (A160432 v02). A total of 8
cycles were used for library amplification and the final library was eluted with 25 µL nuclease-free water. The final libraries were visualized and quantified with a TapeStation instrument,
with a representative Hi-C library trace shown in Fig. 2a. The i7 and i5 index sequences of each library are presented in Table 1. CUT&RUN LIBRARY GENERATION CUT&RUN was performed
with the CUTANA™ ChIC / CUT&RUN Kit v3 (Cat# 14-1048, EpiCypher) with minor modifications. Briefly, after counting the concentration of the nuclear suspension, the suspension was spined
down at 600 × g for 4 minutes at 4 °C and reconstituted to 5 million/mL with nuclei buffer (10 mM Tris-HCl pH 7.5, 10 mM NaCl, 3 mM MgCl2). Then, 100 µL suspension containing 500,000 nuclei
was mixed with 10 µL activated EpiCypher ConA Beads. Each 100 µL aliquot containing 500,000 nuclei is considered as a replicate and we included two replicates for each reaction in this
study. For antibody binding, 0.5 µg H3K4me3 (Cat # 13-0041k, EpiCypher) and H3K27me3 (Cat # 13-0055, EpiCypher) antibodies were used and 0.5 µg rabbit IgG antibody (Cat # 13-0042k,
EpiCypher) was used as a negative control. As recommended by the manufacture’s manual, a SNAP-CUTANA™ K-MetStat Panel (Cat # 19-1002k, EpiCypher), which contains 16 different DNA-barcoded
histone modifications, was added into the H3K4me3 and IgG samples as spike-in controls before antibody binding. pAG-MNase binding, chromatin digestion and DNA purification were performed
following the manufacture’s protocol (User Manual v3.3). 0.5 ng E. coli Spike-in DNA (Cat# 18-1401, EpiCypher) was added to each reaction for downstream data normalization. Library
preparation was performed with the NEBNext® Ultra™ II DNA Library Prep Kit (E7645S, NEB), with PCR amplification parameters as [98 °C for 45 seconds, 13 cycles of (98 °C for 15 seconds, 60
°C for 10 seconds), 72 °C for 60 seconds and 4 °C hold]. NEBNext® Multiplex Oligos (E6440S, NEB) were used for library indexing, with the i7 and i5 index sequences of each library presented
in Table 2. The final libraries were visualized and quantified with a TapeStation instrument, with a representative library trace shown in Fig. 2b, which successfully indicates the
periodicity of chromatin structures. NEXT-GENERATION SEQUENCING All 6 dual-indexed Hi-C libraries and 18 dual-indexed CUT&RUN libraries were sequenced on a 300-cycle NovaSeq X Plus
platform (Illumina). Sequencing depths of all Hi-C and CUT&RUN libraries are summarized in Tables 3 and 4, respectively. Hi-C libraries were sequenced with an average depth of 578
million reads and CUT&RUN libraries were sequenced with an average depth of 19 million reads. HI-C DATA PROCESSING AND ANALYSIS Preprocessing of paired-end raw .fastq files of Hi-C
sequencing data were performed with Juicer v1.630, including genome alignment, read sorting, duplicate removal and generation of .hic contact matrices, with resolutions of 5 K, 10 K, 25 K,
50 K, 100 K, 250 K, 500 K, 1000 K and 2500 K bases. Human hg19 (primary assembly of GRCh37) was used as the reference genome. The hg19 .fasta file was used to create an Arima Hi-C
restriction enzyme site position file with the generate_site_positions.py script provided by Juicer. All other data preprocessing procedures were performed following the Arima-HiC
bioinformatics manual (A160600 version 07/19/2021). Only .hic files with mapping quality over 30 (MAPQ >= 30) were used for downstream analysis in this study. Finding chromatin contact
domains was performed with Arrowhead (implemented in Juicer tools v1.6.2) as previously described at a resolution of 5000 bp31. This analytical pipeline was first performed on individual
replicate .fastq files, and after quality check, was performed again on .fastq files merged from two replicates of the same kidney anatomic region. Data visualization was performed with
Juicebox v1.8.8 and WashU Epigenome Browser32. Data files generated through hg38 alignment are also available at https://doi.org/10.5281/zenodo.1195517529. CUT&RUN DATA PROCESSING AND
ANALYSIS The paired-end raw.fastq files of CUT&RUN sequencing data were first trimmed with TrimGalore v0.6.4_dev (https://github.com/FelixKrueger/TrimGalore). The reads were aligned to
the human hg19 (primary assembly of GRCh37) genome or the E. coli genome (E. coli strain K12, MG1655; available at https://support.illumina.com/sequencing/sequencing_software/igenome.html)
for .sam file generation with Bowtie2 v2.3.5.133. The number of E. coli reads of each CUT&RUN library is summarized in Table 4. The .sam files post hg19 genome alignment were sorted and
indexed with samtools v1.1034 to generate sorted.bam files. For each library, bigwig file were subsequently generated with bamCoverage v3.5.435. This analytical pipeline was first performed
on individual replicate .fastq files, and after quality check, was performed again on .fastq files merged from two replicates of the same kidney anatomic region. Evaluation of the
SNAP-CUTANA™ K-MetStat Panel was performed on H3K4me3 and IgG libraries with scripts provided by the EpiCypher manufacture. The peak calling step was performed using the Sparse Enrichment
Analysis for CUT&RUN (SEACR) workflow developed by Meers _et al_.36 Previously sorted .bam files were first converted to .bed files using the bamtobed function of bedtools. Then, the 5′
and 3′ coordinates of the read pairs were selected to generate a new .bed file, which was subsequently converted to .bedgraph format using the genomecov function of bedtools. The scale
factor used in this step followed the Epicypher CUTANA manual, which measures the ratio of mapped reads between each histone marker and its corresponding E. coli Spike-in DNA. After
generating the .bedgraph files, SEACR was used to call peaks between each histone modification marker and its region-specific IgG control. The called peaks were exported as
.peaks.stringent.bed files for downstream analysis using R v4.2.2. R packages circlize37 and karyoploteR38 were utilized to generate the density and coverage plots of peaks on each
chromosome. The R package ChIPseeker was employed for annotating and visualizing the genomic locations of each peak39,40. Data files generated through hg38 alignment are also available at
https://doi.org/10.5281/zenodo.1195517529. DATA RECORDS All primary data have been deposited in NCBI’s Gene Expression Omnibus and are available through GEO Series accession number
GSE25363428, including (1) raw fastq files of Hi-C sequencing data, (2) processed Hi-C contact matrices for all Hi-C libraries, (3) raw fastq files of CUT&RUN sequencing data and (4)
processed bigwig files for all CUT&RUN libraries. Supporting data files, including donor clinical information and intermediate data that are not compliant with the GEO requirement, are
available at https://doi.org/10.5281/zenodo.1195517529. TECHNICAL VALIDATION HI-C SEQUENCING DATA EVALUATION We analyzed the quality control metrics generated by Juicer30 during Hi-C data
preprocessing. A total of 687, 797, 625, 675, 269, 740 and 808,998,165 Hi-C contacts were identified in the human kidney cortex, medulla and papilla, respectively. As indicated by the Arima
Hi-C manual, high-quality Hi-C libraries are typically characterized by a ratio of alignable reads to total reads over 80% and a ratio of Hi-C contact reads to alignable reads over 60%, and
we found the values of all 6 libraries generated in this work are above these thresholds (Fig. 3a,b). Our library quality was also validated by fraction of chimeric ambiguous reads and
fraction of unmapped reads lower than their corresponding thresholds for all libraries (Fig. 3c,d). Since the Hi-C technology mostly captures long-range 3D interactions within chromosomes18,
we examined ratios of long-cis interactions with a distance greater than 20kb to total Hi-C contact numbers, and identified that for all 6 libraries, over half of the Hi-C contacts present
long-cis interactions, with ratios higher than the quality threshold (Fig. 3e). Over 70% of Hi-C contacts are enriched for intra-chromosomal interactions for all libraries (Fig. 3f),
consistent with expectation. EVALUATION OF HI-C CONTACT MATRICES We projected all Hi-C contacts onto the hg19 genome for all kidney anatomic regions. As mentioned above, most Hi-C contacts
are enriched for intra-chromosomal interactions (Fig. 4a) for all autosomes and the X chromosome. The Hi-C contact maps of kidney cortex, medulla and papilla share a similar pattern when we
examined them across all chromosomes (Fig. 4a), as a result of conserved chromatin conformation in mammalian cells. On the other hand, distinct Hi-C contact profiles can be observed when
examined within a chromosome or specific genomic regions (Fig. 4b), indicating different chromatin interaction networks across kidney anatomic regions. For example, chromatin contact domain
calling analysis with Arrowhead31 identified a domain located nearby _BIN1_ promoter region in the kidney cortex, but not in kidney medulla and papilla, and we observed more Hi-C contacts
within this region in the kidney cortex (Fig. 5a). This observation is concordant with the identification of high _BIN1_ gene expression in proximal tubular cells in recent single-cell
studies6,41,42. We recently described increased _RUNX1_ gene expression and chromatin accessibility along the human kidney corticopapillary axis16, and consistently, our Hi-C sequencing data
revealed a domain covering _RUNX1_ with more chromatin interactions in medulla and papilla than that in the kidney cortex (Fig. 5b). CUT&RUN SEQUENCING DATA EVALUATION For all 16
CUT&RUN libraries, an average of 97.8% of the total reads (from 97.09% to 98.62%) were mapped to the hg19 genome. As mentioned in Methods, E. coli Spike-in DNA was added to each library
(Table 4) and we found an average of 0.8% of the total reads (from 0.26% to 1.39%) were mapped to the E. coli genome during Bowtie2 alignment, consistent with expectation. For H3K4me3 and
IgG libraries in which the SNAP-CUTANA K-MetStat Panel was added as spike-in controls (see Methods), the ratio of reads containing exogenous histone modification barcodes to the total reads
is consistently <0.6%. Analyzing the composition of the K-MetStat Panel revealed an enrichment for H3K4me3 barcodes in the H3K4me3 CUT&RUN libraries, indicating a strong on-target
effect (Fig. 6a). Since H3K4me3 typically marks the transcription start sites (TSSs) and indicates active transcription, and H3K27me3 is a regressive histone marker20,43,44,45, we examined
CUT&RUN signals of the two histone modification markers, and identified sharp H3K4me3 peaks localized to TSSs at gene promoter regions, as well as broad H3K27me3 peaks over repressive
genomic regions, suggesting successful chromatin modification profiling (Fig. 6b). CUT&RUN DATA PEAK CALLING EVALUATION To evaluate the efficacy of our CUT&RUN dataset in downstream
analysis, we performed peak calling analysis to identify genome-wide CUT&RUN signal-enriched regions for each library with a computational pipeline previously described36, where the IgG
CUT&RUN profile of each kidney region was subtracted as a negative control to eliminate background noise. A total of 8726, 2153 and 4955 H3K4me3 peaks, and a total of 10864, 5125 and
24184 H3K27me3 peaks, were identified in the human kidney cortex, medulla and papilla, respectively. Many genomic regions show different relative abundances of H3K4me3 and H3K27me3 peaks.
For example, a chromosome 19 region exhibits low presence of H3K4me3 peaks while high abundance of H3K27me3 peaks across the three kidney anatomic regions (Fig. 7a,b; highlighted with
arrows; Fig. 7c for a zoom-in view). Differences in peak distribution across three kidney regions are evident, with coverage plots of representative chromosomes shown in Fig. 7d,e. As
another example, for kidney cortical genome-wide H3K4me3 peaks, there are 97.3% of medullary H3K4me3 peaks exhibiting genomic overlaps with them, while only 16.0% of cortical H3K27me3 peaks
coincide with them, supporting existing knowledge that the two histone modifications typically mark distinct genomic regions. Furthermore, annotation of genomic locations for the called
peaks revealed that over 75% of the H3K4me3 peaks reside within the promoter regions, being less than or equal to 1 kb from the TSSs, for all three kidney regions (Fig. 8). Conversely,
34%–51% of the H3K27me3 peaks are located in distal intergenic regions, indicative of a preference for a cis-regulatory role. These observations are consistent with previous reports46,47.
CODE AVAILABILITY Scripts for Hi-C sequencing data preprocessing, CUT&RUN sequencing data preprocessing and analysis relevant to figures in this study are available at
https://github.com/TheHumphreysLab/kidney_anatomy_chromatin. Versions of all required packages are described in the scripts and Methods. REFERENCES * Kovesdy, C. P. Epidemiology of chronic
kidney disease: an update 2022. _Kidney International Supplements_ vol. 12, https://doi.org/10.1016/j.kisu.2021.11.003 (2022). * Kalantar-Zadeh, K., Jafar, T. H., Nitsch, D., Neuen, B. L.
& Perkovic, V. Chronic kidney disease. _Lancet_ 398, 786–802 (2021). Article CAS PubMed Google Scholar * Coresh, J. _et al_. Prevalence of chronic kidney disease in the United
States. _J. Am. Med. Assoc._ 298, 2038–2047 (2007). Article CAS Google Scholar * Li, H. & Humphreys, B. D. Targeting de novo lipogenesis to mitigate kidney disease. _J. Clin. Invest_.
134, (2024). * Wu, H. _et al_. Mapping the single-cell transcriptomic response of murine diabetic kidney disease to therapies. _Cell Metab._ 34, 1064–1078.e6 (2022). Article CAS PubMed
PubMed Central Google Scholar * Wilson, P. C. _et al_. Multimodal single cell sequencing implicates chromatin accessibility and genetic background in diabetic kidney disease progression.
_Nat. Commun._ 13, 1–20 (2022). Article ADS Google Scholar * Wilson, P. C. _et al_. The single-cell transcriptomic landscape of early human diabetic nephropathy. _Proc. Natl. Acad. Sci.
USA_ 116, 19619–19625 (2019). Article ADS CAS PubMed PubMed Central Google Scholar * Li, H., Dixon, E. E., Wu, H. & Humphreys, B. D. Comprehensive single-cell transcriptional
profiling defines shared and unique epithelial injury responses during kidney fibrosis. _Cell Metab._ 34, 1977–1998.e9 (2022). Article CAS PubMed PubMed Central Google Scholar * Song,
R. & Yosypiv, I. V. Development of the kidney medulla. _Organogenesis_ 8, 10–17 (2012). Article PubMed PubMed Central Google Scholar * Jaenisch, R. & Bird, A. Epigenetic
regulation of gene expression: How the genome integrates intrinsic and environmental signals. _Nature Genetics_ vol. 33, https://doi.org/10.1038/ng1089 (2003). * Ding, H., Zhang, L., Yang,
Q., Zhang, X. & Li, X. Epigenetics in kidney diseases. _Adv. Clin. Chem._ 104, 233–297 (2021). Article CAS PubMed Google Scholar * Gibney, E. R. & Nolan, C. M. Epigenetics and
gene expression. _Hered._ 105, 4–13 (2010). _2010 1051_. Article CAS Google Scholar * Dai, Z., Ramesh, V. & Locasale, J. W. The evolving metabolic landscape of chromatin biology and
epigenetics. _Nat. Rev. Genet._ 21, 737–753 (2020). _2020 2112_. Article CAS PubMed PubMed Central Google Scholar * Li, H. & Humphreys, B. D. Single Cell Technologies: Beyond
Microfluidics. _Kidney360_ 2, 1196–1204 (2021). Article PubMed PubMed Central Google Scholar * Muto, Y., Li, H. & Humphreys, B. D. Single Cell Transcriptomics. in _Innovations in
Nephrology: Breakthrough Technologies in Kidney Disease Care_ 87–102, https://doi.org/10.1007/978-3-031-11570-7_5 (Springer, Cham, 2022). * Li, H. _et al_. Transcriptomic, epigenomic, and
spatial metabolomic cell profiling redefines regional human kidney anatomy. _Cell Metab._ 36, 1105–1125.e10 (2024). Article CAS PubMed Google Scholar * Li, H. & Humphreys, B. D.
Spatially resolved metabolomic dataset of distinct human kidney anatomic regions. _Data Br._ 54, 110431 (2024). Article CAS Google Scholar * McCord, R. P., Kaplan, N. & Giorgetti, L.
Chromosome Conformation Capture and Beyond: Toward an Integrative View of Chromosome Structure and Function. _Mol. Cell_ 77, 688–708 (2020). Article CAS PubMed Google Scholar * Stillman,
B. Histone Modifications: Insights into Their Influence on Gene Expression. _Cell_ 175, 6–9 (2018). Article CAS PubMed Google Scholar * Yoshimura, Y. _et al_. A single-cell multiomic
analysis of kidney organoid differentiation. _Proc. Natl. Acad. Sci._ 120, e2219699120 (2023). Article CAS PubMed PubMed Central Google Scholar * Eun, M. _et al_. Chromatin
accessibility analysis and architectural profiling of human kidneys reveal key cell types and a regulator of diabetic kidney disease. _Kidney Int_. 0, (2023). * Mimura, I., Kanki, Y.,
Kodama, T. & Nangaku, M. Revolution of nephrology research by deep sequencing: ChIP-seq and RNA-seq. _Kidney Int._ 85, 31–38 (2014). Article CAS PubMed Google Scholar * Luo, Y. _et
al_. New developments on the Encyclopedia of DNA Elements (ENCODE) data portal. _Nucleic Acids Res._ 48, D882–D889 (2020). Article CAS PubMed Google Scholar * Gisch, D. L. _et al_. The
chromatin landscape of healthy and injured cell types in the human kidney. _Nat. Commun._ 15, 1–21 (2024). _2024 151_. Article Google Scholar * Haug, S. _et al_. Multi-omic analysis of
human kidney tissue identified medulla-specific gene expression patterns. _Kidney Int_. 0, (2023). * Li, H. & Humphreys, B. D. Mouse kidney nuclear isolation and library preparation for
single-cell combinatorial indexing RNA sequencing. _STAR Protoc._ 3, 101904 (2022). Article CAS PubMed PubMed Central Google Scholar * Li, H. & Humphreys, B. D. Protocol for
multimodal profiling of human kidneys with simultaneous high-throughput ATAC and RNA expression with sequencing. _STAR Protoc._ 5, 103049 (2024). Article CAS PubMed PubMed Central Google
Scholar * Li, H. & Humphreys, B. D. _GEO_. https://identifiers.org/geo/GSE253634 (2024). * Li, H. Supporting data for ‘Chromatin conformation and histone modification profiling across
human kidney anatomic regions’. _Zenodo._ https://doi.org/10.5281/zenodo.11955175 (2024). * Durand, N. C. _et al_. Juicer Provides a One-Click System for Analyzing Loop-Resolution Hi-C
Experiments. _Cell Syst._ 3, 95–98 (2016). Article CAS PubMed PubMed Central Google Scholar * Rao, S. S. P. _et al_. A 3D map of the human genome at kilobase resolution reveals
principles of chromatin looping. _Cell_ 159, 1665–1680 (2014). Article CAS PubMed PubMed Central Google Scholar * Li, D., Hsu, S., Purushotham, D., Sears, R. L. & Wang, T. WashU
Epigenome Browser update 2019. _Nucleic Acids Res._ 47, W158–W165 (2019). Article CAS PubMed PubMed Central Google Scholar * Langmead, B. & Salzberg, S. L. Fast gapped-read
alignment with Bowtie 2. _Nat. Methods_ 9, 357–359 (2012). Article CAS PubMed PubMed Central Google Scholar * Li, H. _et al_. The Sequence Alignment/Map format and SAMtools.
_Bioinformatics_ 25, 2078–2079 (2009). Article PubMed PubMed Central Google Scholar * Ramírez, F. _et al_. deepTools2: a next generation web server for deep-sequencing data analysis.
_Nucleic Acids Res._ 44, W160–W165 (2016). Article PubMed PubMed Central Google Scholar * Meers, M. P., Tenenbaum, D. & Henikoff, S. Peak calling by Sparse Enrichment Analysis for
CUT&RUN chromatin profiling. _Epigenetics and Chromatin_ 12, 1–11 (2019). Article CAS Google Scholar * Gu, Z., Gu, L., Eils, R., Schlesner, M. & Brors, B. circlize Implements and
enhances circular visualization in R. _Bioinformatics_ 30, 2811–2812 (2014). Article CAS PubMed Google Scholar * Gel, B. & Serra, E. karyoploteR: an R/Bioconductor package to plot
customizable genomes displaying arbitrary data. _Bioinformatics_ 33, 3088–3090 (2017). Article CAS PubMed PubMed Central Google Scholar * Wang, Q. _et al_. Exploring Epigenomic Datasets
by ChIPseeker. _Curr. Protoc._ 2, e585 (2022). Article CAS PubMed Google Scholar * Yu, G., Wang, L. G. & He, Q. Y. ChIPseeker: an R/Bioconductor package for ChIP peak annotation,
comparison and visualization. _Bioinformatics_ 31, 2382–2383 (2015). Article CAS PubMed Google Scholar * Lake, B. B. _et al_. An atlas of healthy and injured cell states and niches in
the human kidney. _Nature_ 2021.07.28.454201, https://doi.org/10.1038/s41586-023-05769-3 (2023). * Abedini, A. _et al_. Spatially resolved human kidney multi-omics single cell atlas
highlights the key role of the fibrotic microenvironment in kidney disease progression. _bioRxiv_ 2022.10.24.513598, https://doi.org/10.1101/2022.10.24.513598 (2022). * Benayoun, B. A. _et
al_. H3K4me3 breadth is linked to cell identity and transcriptional consistency. _Cell_ 158, 673 (2014). Article CAS PubMed PubMed Central Google Scholar * Liu, X. _et al_. Distinct
features of H3K4me3 and H3K27me3 chromatin domains in pre-implantation embryos. _Nat._ 537, 558–562 (2016). _2016 5377621_. Article ADS CAS Google Scholar * Bogliotti, Y. S. & Ross,
P. J. Mechanisms of histone H3 lysine 27 trimethylation remodeling during early mammalian development. _Epigenetics_ 7, 976 (2012). Article CAS PubMed PubMed Central Google Scholar *
Wei, G. _et al_. Global mapping of H3K4me3 and H3K27me3 reveals specificity and plasticity in lineage fate determination of differentiating CD4+ T cells. _Immunity_ 30, 155–167 (2009).
Article PubMed PubMed Central Google Scholar * Zhang, Y. _et al_. Canonical nucleosome organization at promoters forms during genome activation. _Genome Res._ 24, 260–266 (2014). Article
PubMed PubMed Central Google Scholar Download references ACKNOWLEDGEMENTS These experiments were funded by NIH grants DK103740, UC2DK126024 and U54DK137332 to BDH. The other authors
declare no funding support related to this work. The authors acknowledge Washington University Genome Technology Access Center for next-generation sequencing support. The authors also
appreciate suggestions from personnel in Ting Wang’s laboratory at Washington University in St. Louis in Hi-C library preparation. AUTHOR INFORMATION Author notes * These authors contributed
equally: Haikuo Li, Dian Li. AUTHORS AND AFFILIATIONS * Division of Nephrology, Department of Medicine, Washington University in St. Louis, St. Louis, MO, USA Haikuo Li, Dian Li &
Benjamin D. Humphreys * Department of Developmental Biology, Washington University in St. Louis, St. Louis, MO, USA Benjamin D. Humphreys Authors * Haikuo Li View author publications You can
also search for this author inPubMed Google Scholar * Dian Li View author publications You can also search for this author inPubMed Google Scholar * Benjamin D. Humphreys View author
publications You can also search for this author inPubMed Google Scholar CONTRIBUTIONS Haikuo Li: Conceptualization, Methodology, Data curation, Writing, Original draft preparation. Dian Li:
Conceptualization, Methodology, Data curation, Writing, Original draft preparation. Benjamin D. Humphreys: Supervision, Writing – Reviewing and Editing. CORRESPONDING AUTHOR Correspondence
to Benjamin D. Humphreys. ETHICS DECLARATIONS COMPETING INTERESTS The authors declare that they have no known competing financial or non-financial interests or personal relationships that
could have appeared to influence the work reported in this paper. ADDITIONAL INFORMATION PUBLISHER’S NOTE Springer Nature remains neutral with regard to jurisdictional claims in published
maps and institutional affiliations. RIGHTS AND PERMISSIONS OPEN ACCESS This article is licensed under a Creative Commons Attribution 4.0 International License, which permits use, sharing,
adaptation, distribution and reproduction in any medium or format, as long as you give appropriate credit to the original author(s) and the source, provide a link to the Creative Commons
licence, and indicate if changes were made. The images or other third party material in this article are included in the article’s Creative Commons licence, unless indicated otherwise in a
credit line to the material. If material is not included in the article’s Creative Commons licence and your intended use is not permitted by statutory regulation or exceeds the permitted
use, you will need to obtain permission directly from the copyright holder. To view a copy of this licence, visit http://creativecommons.org/licenses/by/4.0/. Reprints and permissions ABOUT
THIS ARTICLE CITE THIS ARTICLE Li, H., Li, D. & Humphreys, B.D. Chromatin conformation and histone modification profiling across human kidney anatomic regions. _Sci Data_ 11, 797 (2024).
https://doi.org/10.1038/s41597-024-03648-8 Download citation * Received: 18 March 2024 * Accepted: 11 July 2024 * Published: 18 July 2024 * DOI: https://doi.org/10.1038/s41597-024-03648-8
SHARE THIS ARTICLE Anyone you share the following link with will be able to read this content: Get shareable link Sorry, a shareable link is not currently available for this article. Copy to
clipboard Provided by the Springer Nature SharedIt content-sharing initiative