Play all audios:
ABSTRACT Satellite temperature measurements do not support the recent claim of a “leveling off of warming” over the past two decades. Tropospheric warming trends over recent 20-year periods
are always significantly larger (at the 10% level or better) than model estimates of 20-year trends arising from natural internal variability. Over the full 38-year period of the satellite
record, the separation between observed warming and internal variability estimates is even clearer. In two out of three recent satellite datasets, the tropospheric warming from 1979 to 2016
is unprecedented relative to internally generated temperature trends on the 38-year timescale. SIMILAR CONTENT BEING VIEWED BY OTHERS GLOBAL WARMING AT NEAR-CONSTANT TROPOSPHERIC RELATIVE
HUMIDITY IS SUPPORTED BY OBSERVATIONS Article Open access 10 October 2022 LARGE-SCALE EMERGENCE OF REGIONAL CHANGES IN YEAR-TO-YEAR TEMPERATURE VARIABILITY BY THE END OF THE 21ST CENTURY
Article Open access 13 December 2021 MULTI-DECADAL CLIMATE VARIABILITY AND SATELLITE BIASES HAVE AMPLIFIED MODEL-OBSERVATION DISCREPANCIES IN TROPICAL TROPOSPHERE WARMING ESTIMATES Article
Open access 21 June 2024 INTRODUCTION After a recent Senate confirmation hearing, Scott Pruitt – the new Administrator of the U.S. Environmental Protection Agency – received a written
question regarding observed warming estimates. In response, Mr. Pruitt claimed that “over the past two decades satellite data indicates there has been a leveling off of warming”1. We test
this claim here. In the following, we assume the satellite data referred to by Mr. Pruitt are measurements of the temperature of the lowest layer of the atmosphere (the troposphere). These
measurements were the focus of recent Congressional testimony2. We update and extend the analysis in ref. 3 using satellite temperature data spanning the period from January 1979 to December
2016. Since late 1978, satellite microwave sounders have monitored the microwave emissions of oxygen molecules. Emissions are proportional to the temperature of different atmospheric
layers, and require adjustments for known problems associated with satellite orbital drift and instrument calibration4,5,6. Satellite estimates of global changes in the temperature of the
mid- to upper troposphere (TMT) are currently available from Remote Sensing Systems (RSS), the Center for Satellite Applications and Research (STAR), and the University of Alabama at
Huntsville (UAH). All three groups provide older and more recent TMT datasets4, 5, 7. The newer, more reliable datasets are the primary focus here. Satellite TMT measurements include a
contribution from the cooling stratosphere. To study warming of the troposphere, we used a standard regression method8,9,10,11 to remove the stratospheric cooling contribution to TMT (see
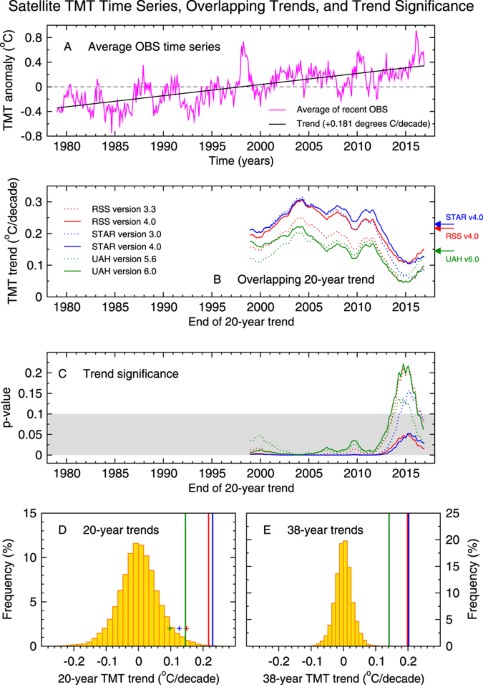
Methods). The corrected TMT data show pronounced tropospheric warming (Fig. 1A). In the most recent versions of the RSS, STAR, and UAH datasets, the TMT trend over the full 38-year period of
the satellite record is 0.199 °C, 0.202 °C, and 0.142 °C per decade (respectively). To evaluate the claim that satellite data show “leveling off” of warming over the past two decades, we
examine all possible 20-year periods of satellite TMT records. We calculate linear temperature trends for each 20-year period, and then determine whether the observed TMT trends are
significantly larger than the 20-year trends arising from natural processes internal to the climate system3. Estimates of natural internal variability are based on results from 36 different
climate models (see Methods and Supplementary Information). RESULTS In each of the six satellite datasets, all 20-year TMT trends are positive, irrespective of the trend start date (Fig.
1B). The specific period of “the past two decades” yields 20-year TMT trends that have not “leveled off”. As expected, there are multi-decadal changes in trend size12, 13. Recent 20-year
trends are smaller than most of the earlier 20-year trend values. This is due to the combined effects of multiple factors: the anomalous warmth at the beginning of the last 20 years (arising
from a large El Niño event in 1997/98), the shift from a warm phase to a cold phase of the Interdecadal Pacific Oscillation in the late 1990s14,15,16,17, changes in other modes of internal
variability18,19,20, a succession of moderate volcanic eruptions in the early 21st century21,22,23, a long and low minimum in solar output during the last solar cycle24, and an increase in
anthropogenic sulphate pollution25, 26. Figure 1C provides information on whether observed TMT trends show unusually large warming relative to the estimated warming trends caused by natural
internal climate variability. Two features are noteworthy. First, we find that significant 20-year tropospheric warming trends are a commonplace occurrence during the satellite era. Second,
despite their smaller size, warming trends over the last 20 years (January 1997 to December 2016) are significantly larger, at the 10% level or better, than estimates of 20-year trends
arising from natural internal variability (Fig. 1C,D). This holds for all six satellite datasets. In the latest versions of the RSS, STAR, and UAH TMT data, the probability that internal
variability could produce warming exceeding that observed over the last 20 years is only 1.6%, 3.1%, and 6.3% (respectively). These probabilities decrease markedly if the averages of all
individual 20-year trends are considered (see vertical lines in Fig. 1D). The unusual size of observed tropospheric warming becomes even clearer for the full 38-year period of TMT
measurements. Over 1979 to 2016, global warming of the troposphere far exceeds current estimates of natural internal climate variability (Fig. 1E). TMT trends in the latest versions of the
RSS, STAR, and UAH datasets are (respectively) 7.50, 7.64, and 5.35 standard deviations removed from the mean of the distribution of unforced 38-year TMT trends. The probabilities associated
with these numbers are miniscule. In fact, the tropospheric warming trends in versions 4.0 of the RSS and STAR data are unprecedented – they are not exceeded by any of the 212,808 unforced
TMT trends in the distribution shown in Fig. 1E. In version 6.0 of the UAH data, only 16 of the 212,808 unforced trends are larger than the observed TMT trend. To plausibly explain the
observed tropospheric warming by natural internal variability would require that the model results in Fig. 1E underestimate real-world internal variability by a factor of 2.5 or more. There
is no evidence of a systematic model error of this size12, 27, 28 (see Methods). SUMMARY Satellite temperature measurements do not support the claim of a “leveling off of warming” over the
past two decades1. They are also inconsistent with a similar claim2 (see Supplementary Figure S1). Trend assessments over short, 1–2 decade-long periods of time are often sensitive to small
changes in the trend start date3. More reliable estimates of underlying temperature changes are obtained by averaging over all possible short-term trends or by considering longer analysis
periods. When examined over the full period of record, long-term tropospheric warming far exceeds current estimates of natural internal climate variability (Fig. 1E). Our results support and
strengthen previous findings of a large human-caused contribution to warming29,30,31,32. Studies involving patterns of tropospheric temperature change (rather than the global averages
considered here) yield even stronger evidence of a human fingerprint in the thermal structure of the atmosphere27, 33,34,35. The recent focus on satellite temperature data in political
discourse1, 2 provides an opportunity to highlight this fingerprint evidence, and underscores the importance of continued satellite-based monitoring of Earth’s climate. METHODS SATELLITE
ATMOSPHERIC TEMPERATURE DATA We used satellite estimates of atmospheric temperature produced by RSS4, STAR5, and UAH7. All three groups provide satellite measurements of the temperatures of
the mid- to upper troposphere (TMT) and the lower stratosphere (TLS). Our focus here is on assessing the significance of observed trends in TMT. TLS is required for correcting TMT for the
influence it receives from stratospheric cooling. Each group provides the most recent version and the previous version of their datasets. The versions available are: 3.3 and 4.0 (RSS), 3.0
and 4.0 (STAR), and 5.6 and 6.0 (UAH). Satellite datasets are in the form of monthly means on 2.5° × 2.5° latitude/longitude grids. At the time this analysis was performed, temperature data
were available for the 456-month period from January 1979 to December 2016. There are differences in the spatial coverage of the satellite temperature data produced by the three groups.
While UAH TLS and TMT datasets have global coverage, areas poleward of 87.5° (82.5°) are excluded from STAR (RSS). To avoid any impact of spatial coverage differences on trend comparisons,
we calculated all near-global averages of actual and synthetic satellite temperatures over the area of common coverage in the RSS, UAH, and STAR datasets (82.5°N to 82.5°S). METHOD USED FOR
CORRECTING TMT DATA Trends in TMT estimated from microwave sounders receive a substantial contribution from the cooling of the lower stratosphere8,9,10,11. In ref. 8, a regression-based
approach was developed for removing the bulk of this stratospheric cooling component of TMT. This method has been validated with both observed and model atmospheric temperature data9, 36,
37. Correction was performed at each observational and model grid-point. Corrected grid-point data were then spatially averaged over 82.5°N–82.5°S. Further details of the correction method
are provided in the Supplementary Information. DETAILS OF MODEL OUTPUT We used model output from phase 5 of the Coupled Model Intercomparison Project38 (CMIP5). The simulations analyzed here
were contributed by 18 different research groups (see Supplementary Table S1). Our focus was on pre-industrial control runs with no changes in external influences on climate, which provide
estimates of the natural internal variability of the climate system (see Supplementary Table S2). To compare satellite-derived atmospheric temperature trends with model estimates of trends
arising from natural internal variability, we calculate synthetic TMT and TLS from CMIP5 control runs. This calculation relies on a local weighting function method developed at RSS. At each
model grid-point, simulated temperature profiles were convolved with local weighting functions. Local weights depend on the grid-point surface pressure, the surface type (land or ocean), and
the selected layer-average temperature (TMT or TLS). STATISTICAL ANALYSIS We use model estimates of natural internal variability to evaluate the statistical significance of trends in the
observed temperature time series _T_ _o_ (_k_, _t_), where _k_ and _t_ are (respectively) indices over the number of satellite TMT datasets and the time in months. Internal variability
estimates are obtained from CMIP5 control runs. Rather than focusing on one specific period, we analyze maximally overlapping 20-year trends in _T_ _o_ (_k_, _t_). “Maximally overlapping”
indicates that an 20-year sliding window is being used for trend calculations. This window advances in increments of one month until the end of the current window reaches the final month of
the satellite or control run TMT time series. Anomalies in the satellite observations are defined relative to climatological monthly means calculated over the 38-year period from January
1979 to December 2016. Control run anomalies are with respect to climatological monthly means over the full length of each model’s control integration. We assess trend significance using
weighted _p_-values, which account for inter-model differences in control run length3. The weighted _p_-value, \(\overline{{p}_{c}}(i,k)^{\prime} \), is defined as:
$$\overline{{p}_{c}}(i,k)^{\prime} =\sum _{j=1}^{{N}_{model}}{p}_{c}(i,j,k)/{N}_{model}$$ (1) $$i=\mathrm{1,}\ldots ,{N}_{o};j=\mathrm{1,}\ldots ,{N}_{model};k=\mathrm{1,}\ldots ,{N}_{sat}$$
where the index _i_ is over _N_ _o_ , the number of maximally overlapping 20-year trends in _T_ _o_ (_k_, _t_), and the index _j_ spans _N_ _model_ , the number of model control runs (which
is 36 here). The sample size _N_ _sat_ is the total number of satellite datasets. Here, _N_ _sat_ = 6, and _N_ _o_ = 217 for 20-year trends. The individual _p_ _c_ (_i_, _j_, _k_) values
for each model pre-industrial control run are calculated as follows: $${p}_{c}(i,j,k)={K}_{c}(i,j,k)\,/{N}_{c}(j)$$ (2) $$i=\mathrm{1,}\ldots ,{N}_{o};j=\mathrm{1,}\ldots
,{N}_{model};k=\mathrm{1,}\ldots ,{N}_{sat}$$ where the summation variable _K_ _c_ (_i_, _j_, _k_) is the number of 20-year trends in each model control run that are larger than _b_ _o_
(_i_, _k_), the current 20-year trend in _T_ _o_ (_k_, _t_). The sample size _N_ c(_j_) is the number of maximally overlapping 20-year trends in the _j_ _th_ control run. Further information
on the statistical notation and analysis is given in the Supplementary Information. SENSITIVITY OF RESULTS TO MODEL VARIABILITY ERRORS The credibility of our trend significance results
rests on the assumption that model control runs yield reliable estimates of internal variability on the timescales considered here (20 years in Fig. 1C and D, 38 years in Fig. 1E, and 18
years in Supplementary Fig. 1C and D). On these multi-decadal timescales, it is not feasible to use the single realization of the observed 38-year satellite TMT record to evaluate how
reliably models capture “observed” internal variability. The primary difficulty is that observed temperature records are simultaneously influenced by both internal variability (operating on
a wide range of different space and timescales) and multiple external forcings. Unambiguous partitioning of observational temperature records into internally generated and externally forced
components is an aspirational goal, but not attainable in practice. All model-versus-observed internal variability comparisons are affected by the uncertainties involved in isolating
multi-decadal internal variability from observational climate records27. Other approaches must therefore be employed to enhance confidence in the reliability of model variability on 18- to
38-year timescales, such as variability comparisons involving longer SST and land + ocean surface temperature records12, 28. The latter work shows no evidence that models systematically
underestimate observed variability on multi-decadal timescales – see, _e.g_., Fig. 4 in ref. 28. The same applies to model-versus-data variability comparisons on shorter timescales of
roughly 10 years27. REFERENCES * U. S. Senate. Available online at:
https://www.epw.senate.gov/public/_cache/files/6d95005c-bd1a-4779-af7e-be831db6866a/scott-pruitt-qfr-responses-01.18.2017.pdf U. S. Senate Environment and Public Works Committee Hearing,
“Nomination of Attorney General Scott Pruitt to be Administrator of the U. S. Environmental Protection Agency”, January 18, 2017 (Date of access: 28/03/2017) (2017). * U. S. Senate,
Available online at: http://www.commerce.senate.gov/public/index.cfm/2015/12/data-or-dogma-promoting-open-inquiry-in-the-debate-over-the-magnitude-of-human-impact-on-earth-s-climate. “Data
or Dogma? Promoting open inquiry in the debate over the magnitude of human impact on Earth’s climate”. Archived webcast of Hearing before the U. S. Senate Committee on Commerce, Science, and
Transportation, Subcommittee on Space, Science, and Competitiveness, December 8, 2015 (Date of access: 28/03/2017) (2015). * Santer, B. D. _et al_. Comparing tropospheric warming in climate
models and satellite data. _J. Clim._ 30, 373–392, doi:10.1175/JCLI-D-16-0333.1 (2017). Article ADS Google Scholar * Mears, C. & Wentz, F. J. Sensitivity of satellite-derived
tropospheric temperature trends to the diurnal cycle adjustment. _J. Clim._ 29, 3629–3646, doi:10.1175/JCLI-D-15-0744.1 (2016). Article ADS Google Scholar * Zou, C.-Z. & Wang. W.
Inter-satellite calibration of AMSU-A observations for weather and climate applications _J. Geophys. Res_. 116, doi:10.1029/2011JD016205 (2011). * Po-Chedley, S., Thorsen, T. J. & Fu, Q.
Removing diurnal cycle contamination in satellite-derived tropospheric temperatures: Understanding tropical tropospheric trend discrepancies. _J. Clim._ 28, 2274–2290,
doi:10.1175/JCLI-D-13-00767.1 (2015). Article ADS Google Scholar * Christy, J. R., Norris, W. B., Spencer, R. W. & Hnilo, J. J. Tropospheric temperature change since 1979 from
tropical radiosonde and satellite measurements. _J. Geophys. Res_. 112, D06102, doi:10.1029/2005JD006881 (2007). * Fu, Q., Johanson, C. M., Warren, S. G. & Seidel, D. J. Contribution of
stratospheric cooling to satellite-inferred tropospheric temperature trends. _Nature_ 429, 55–58, doi:10.1038/nature02524 (2004). Article ADS CAS PubMed Google Scholar * Fu, Q. &
Johanson, C. M. Stratospheric influences on MSU-derived tropospheric temperature trends: A direct error analysis. _J. Clim._ 17, 4636–4640, doi:10.1175/JCLI-3267.1 (2004b). Article ADS
Google Scholar * Fu, Q. & Johanson, C. M. Satellite-derived vertical dependence of tropical tropospheric temperature trends. _Geophys. Res. Lett_. 32, doi:10.1029/2004GL022266 22266
(2005). * Johanson, C. M. & Fu, Q. Robustness of tropospheric temperature trends from MSU Channels 2 and 4. _J. Clim._ 19, 4234–4242, doi:10.1175/JCLI3866.1 (2006). Article ADS Google
Scholar * Santer, B. D. _et al_. Separating signal and noise in atmospheric temperature changes: The importance of timescale. _J. Geophys. Res_. 116, doi:10.1029/2011JD016263 (2011). *
Easterling, D. R. & Wehner, M. F. Is the climate warming or cooling? _Geophys. Res. Lett_. 36, doi:10.1029/2009GL037810 (2009). * Meehl, G. A., Arblaster, J. M., Fasullo, J. T., Hu, A.
& Trenberth, K. E. Model-based evidence of deep-ocean heat uptake during surface-temperature hiatus periods. _Nat. Cli. Change_ 1, 360–364, doi:10.1038/nclimate1229 (2011). Article ADS
Google Scholar * Fyfe, J. C. _et al_. Making sense of the early-2000s warming slowdown. _Nat. Clim. Change_ 6, 224–228, doi:10.1038/nclimate2938 (2016). Article ADS Google Scholar *
England, M. H. _et al_. Recent intensification of wind-driven circulation in the Pacific and the ongoing warming hiatus. _Nat. Clim. Change_ 4, 222–227, doi:10.1038/nclimate2106 (2014).
Article ADS Google Scholar * Trenberth, K. E. Has there been a hiatus? _Science_ 349, 791–792, doi:10.1126/science.aac9225 (2015). Article Google Scholar * Kosaka, Y. & Xie, S.-P.
Recent global-warming hiatus tied to equatorial Pacific surface cooling. _Nature_ 501, 403–407, doi:10.1038/nature12534 (2013). Article ADS CAS PubMed Google Scholar * Risbey, J. S. _et
al_. Well-estimated global surface warming in climate projections selected for ENSO phase. _Nat. Clim. Change_ 4, 835–840, doi:10.1038/nclimate2310 (2014). Article ADS Google Scholar *
Steinman, B. A., Mann, M. E. & Miller, S. K. Atlantic and Pacific multidecadal oscillations and Northern Hemisphere temperatures. _Science_ 347, 988–991, doi:10.1126/science.1257856
(2015). Article ADS MathSciNet CAS PubMed MATH Google Scholar * Solomon, S. _et al_. The persistently variable “background” stratospheric aerosol layer and global climate change.
_Science_ 333, 866–870, doi:10.1126/science.1206027 (2011). Article ADS CAS PubMed Google Scholar * Vernier, J.-P. _et al_. Major influence of tropical volcanic eruptions on the
stratospheric aerosol layer during the last decade. _Geophys. Res. Lett_. 38, doi:10.1029/2011GL047563 (2011). * Ridley, D. A. _et al_. Total volcanic stratospheric aerosol optical depths
and implications for global climate change. _Geophys. Res. Lett._ 41, 7763–7769, doi:10.1002/2014GL061541 (2014). Article ADS CAS Google Scholar * Kopp, G. & Lean, J. L. A new, lower
value of total solar irradiance: Evidence and climate significance. _Geophys. Res. Lett_. 38, L01706, doi:10.1029/2010GL045777 (2011). * Smith, D. M. _et al_. Role of volcanic and
anthropogenic aerosols in the recent global surface warming slowdown. _Nat. Clim. Change_ 6, 936–940, doi:10.1038/nclimate3058 (2016). Article ADS CAS Google Scholar * Schmidt, G. A.,
Shindell, D. T. & Tsigaridis, K. Reconciling warming trends. _Nat. Geosci._ 7, 1–3, doi:10.1038/ngeo2105 (2014). Article Google Scholar * Santer, B. D. _et al_. Identifying human
influences on atmospheric temperature. _Proc. Nat. Acad. Sci._ 110, 26–33, doi:10.1073/pnas.1210514109 (2013a). Article ADS CAS PubMed Google Scholar * Imbers, J., Lopez, A.,
Huntingford, C. & Allen, M. R. Testing the robustness of anthropogenic climate change detection statements using different empirical models. _J. Geophys. Res._ 118, 3192–3199,
doi:10.1002/jgrd.50296 (2013). Google Scholar * Summary for Policymakers. In Climate Change 2007: The Physical Science Basis. Contribution of Working Group I to the Fourth Assessment Report
of the Intergovernmental Panel on Climate Change. Solomon, S. _et al_. (eds.), Cambridge University Press (2007). * Hegerl, G. C. _et al_. Understanding and attributing climate change. In
Climate Change 2007: The Physical Science Basis. Contribution of Working Group I to the Fourth Assessment Report of the Intergovernmental Panel on Climate Change. Solomon, S. _et al_. (eds),
Cambridge University Press, Cambridge, UK (2007). * Summary for Policymakers. In Climate Change 2013: The Physical Science Basis. Contribution of Working Group I to the Fifth Assessment
Report of the Intergovernmental Panel on Climate Change. Stocker, T. F. _et al_. (eds.), Cambridge University Press (2013). * Bindoff, N. _et al_. Detection and attribution of climate
change: from global to regional. In Climate Change 2013: The Physical Science Basis. Contribution of Working Group I to the Fifth Assessment Report of the Intergovernmental Panel on Climate
Change. Stocker, T. F. _et al_. (eds.), Cambridge University Press (2013). * Santer, B. D. _et al_. Human and natural influences on the changing thermal structure of the atmosphere. _Proc.
Nat. Acad. Sci._ 110, 17235–17240, doi:10.1073/pnas.1305332110 (2013b). Article ADS CAS PubMed PubMed Central Google Scholar * Thorne, P. W. _et al_. Probable causes of late twentieth
century tropospheric temperature trends. _Cli. Dyn._ 21, 573–591, doi:10.1007/s00382-003-0353-1 (2003). Article Google Scholar * Lott, F. C. _et al_. Models versus radiosondes in the free
atmosphere: A new detection and attribution analysis of temperature. _J. Geophys. Res._ 118, 2609–2619 (2013). CAS Google Scholar * Gillett, N. P., Santer, B. D. & Weaver, A. J.
Quantifying the influence of stratospheric cooling on satellite-derived tropospheric temperature trends. _Nature_ 432, doi:10.1038/nature03209 (2004). * Kiehl, J. T., Caron, J. & Hack,
J. J. On using global climate model simulations to assess the accuracy of MSU retrieval methods for tropospheric warming trends. _J. Clim._ 18, 2533–2539, doi:10.1175/JCLI3492.1 (2005).
Article ADS Google Scholar * Taylor, K. E., Stouffer, R. J. & Meehl, G. A. An overview of CMIP5 and the experiment design. _Bull. Amer. Meteor. Soc._ 93, 485–498,
doi:10.1175/BAMS-D-11-00094.1 (2012). Article Google Scholar Download references ACKNOWLEDGEMENTS We acknowledge the World Climate Research Programme’s Working Group on Coupled Modelling,
which is responsible for CMIP, and we thank the climate modelling groups for producing and making available their model output. For CMIP, the U.S. Department of Energy’s Program for Climate
Model Diagnosis and Intercomparison (PCMDI) provides coordinating support and led development of software infrastructure in partnership with the Global Organization for Earth System Science
Portals. We thank Cheng-Zhi Zou (Center for Satellite Applications and Research, NOAA/NESDIS) for kindly providing STAR TMT data, Ivana Cvijanovic (PCMDI) for assistance with processing
CMIP5 control run data, and Mike MacCracken (the Climate Institute) for helpful comments. Work by B.D.S., J.F.P., and C.B. was performed under the auspices of the U.S. Department of Energy
under contract DE-AC52-07NA27344. Support was also provided by the Ellen Swallow Richards Professorship at MIT (S.S.), NASA Grant NNH12CF05C (F.J.W. and C.M.), NASA Grant NNX13AN49G (Q.F.),
and NSF Grant AGS-1624881 (S.P.-C). The views, opinions, and findings contained in this report are those of the authors and should not be construed as a position, policy, or decision of the
U.S. Government or the U.S. Department of Energy. AUTHOR INFORMATION AUTHORS AND AFFILIATIONS * Program for Climate Model Diagnosis and Intercomparison (PCMDI), Lawrence Livermore National
Laboratory, Livermore, CA, 94550, USA Benjamin D. Santer, Stephen Po-Chedley, Jeffrey F. Painter & Céline Bonfils * Massachusetts Institute of Technology, Earth, Atmospheric, and
Planetary Sciences, Cambridge, MA, 02139, USA Susan Solomon * Remote Sensing Systems, Santa Rosa, CA, 95401, USA Frank J. Wentz & Carl Mears * Dept. of Atmospheric Sciences, University
of Washington, Seattle, WA, 98195, USA Qiang Fu Authors * Benjamin D. Santer View author publications You can also search for this author inPubMed Google Scholar * Susan Solomon View author
publications You can also search for this author inPubMed Google Scholar * Frank J. Wentz View author publications You can also search for this author inPubMed Google Scholar * Qiang Fu View
author publications You can also search for this author inPubMed Google Scholar * Stephen Po-Chedley View author publications You can also search for this author inPubMed Google Scholar *
Carl Mears View author publications You can also search for this author inPubMed Google Scholar * Jeffrey F. Painter View author publications You can also search for this author inPubMed
Google Scholar * Céline Bonfils View author publications You can also search for this author inPubMed Google Scholar CONTRIBUTIONS B.D.S. and J.F.P. analyzed model and satellite data. F.J.W.
and C.M. contributed satellite data. B.D.S., S.S., F.J.W., Q.F., S.P.-C., C.M., J.F.P., and C.B. wrote and reviewed the manuscript. CORRESPONDING AUTHOR Correspondence to Benjamin D.
Santer. ETHICS DECLARATIONS COMPETING INTERESTS The authors declare that they have no competing interests. ADDITIONAL INFORMATION PUBLISHER'S NOTE: Springer Nature remains neutral with
regard to jurisdictional claims in published maps and institutional affiliations. ELECTRONIC SUPPLEMENTARY MATERIAL SUPPLEMENTARY INFORMATION RIGHTS AND PERMISSIONS OPEN ACCESS This article
is licensed under a Creative Commons Attribution 4.0 International License, which permits use, sharing, adaptation, distribution and reproduction in any medium or format, as long as you give
appropriate credit to the original author(s) and the source, provide a link to the Creative Commons license, and indicate if changes were made. The images or other third party material in
this article are included in the article’s Creative Commons license, unless indicated otherwise in a credit line to the material. If material is not included in the article’s Creative
Commons license and your intended use is not permitted by statutory regulation or exceeds the permitted use, you will need to obtain permission directly from the copyright holder. To view a
copy of this license, visit http://creativecommons.org/licenses/by/4.0/. Reprints and permissions ABOUT THIS ARTICLE CITE THIS ARTICLE Santer, B.D., Solomon, S., Wentz, F.J. _et al._
Tropospheric Warming Over The Past Two Decades. _Sci Rep_ 7, 2336 (2017). https://doi.org/10.1038/s41598-017-02520-7 Download citation * Received: 06 March 2017 * Accepted: 04 April 2017 *
Published: 24 May 2017 * DOI: https://doi.org/10.1038/s41598-017-02520-7 SHARE THIS ARTICLE Anyone you share the following link with will be able to read this content: Get shareable link
Sorry, a shareable link is not currently available for this article. Copy to clipboard Provided by the Springer Nature SharedIt content-sharing initiative