Play all audios:
ABSTRACT Lipidomics have a great potential as clinical tool for monitoring metabolic changes in health and disease. Nevertheless hardly anything is known about the heritability of lipids.
Therefore, it is necessary to clarify how and how much we can affect these progresses in individuals. In our interventional twin study (46 healthy, non-obese twin pairs) we investigated the
lipid profile in plasma samples after switching from a low fat diet to an isocaloric high fat diet (HFD) to characterize the metabolic adaptation. Additionally we used the ACE model for
Additive genetics, Common and unique Environment as well as linear mixed modelling to analyse the heritability of lipids. The heritability of lipids varied between 0–62% and applied to lipid
species rather than to lipid classes. Phospholipids showed the highest inheritance. In addition, sex, body mass index (BMI) and age were important modifiers. The lipid profile changed
already after one week of HFD and diverged further after 5 weeks of additional HFD. Basal concentrations of specific lipids within phospholipids are strongly inherited and are likely to be
associated with heritable disease risks. BMI, sex and age were major modifiers. Nutrition strongly alters specific lipid classes, and has to be controlled in clinical association studies.
SIMILAR CONTENT BEING VIEWED BY OTHERS GENOME-WIDE ASSOCIATION ANALYSIS OF PLASMA LIPIDOME IDENTIFIES 495 GENETIC ASSOCIATIONS Article Open access 31 October 2023 THE POWER OF GENETIC
DIVERSITY IN GENOME-WIDE ASSOCIATION STUDIES OF LIPIDS Article 09 December 2021 PLEIOTROPIC AND SEX-SPECIFIC GENETIC MECHANISMS OF CIRCULATING METABOLIC MARKERS Article Open access 28 May
2025 INTRODUCTION Not only does the analysis of the lipidome reveal a remarkable diversity of lipids, but its composition can also be linked directly to health and disease status1.
Previously, researchers associated reduced concentrations of specific ether lipids in the brain with Alzheimer’s disease and Down syndrome2, 3. Metabolic disorders such as obesity, metabolic
syndrome and diabetes as well as atherosclerosis and cardiovascular diseases were related to changes in the lipid profile of affected patients1, 4, 5. Previous approaches were based on
determination of major lipids such as cholesterol and triglycerides. The much higher resolution of modern lipidomics technologies allows for more detailed insights into metabolic changes.
Apart from the opportunity to use lipidomics for monitoring diseases and prediction of metabolic disease risks, lipidomics may elucidate the effect and interplay of the different lipids and
allow new insights into mechanisms underlying metabolic changes. Important properties of lipids relate to their content of saturated, mono-, and polyunsaturated fatty acids, since their
biological effects and physical properties differ6 as well as their head groups or backbones. Several studies show that lysophosholipids (like lysophosphatidic acid) are able to evoke and
modulate immune responses7. Heimerl _et al_.8 revealed also a pro-inflammatory effect of lower lysophosholipid concentrations and Sigruener _et al_.9 demonstrated a beneficial role of
specific lysophosphatidylcholines. Nevertheless individual responses to higher fat intake may vary considerably, possibly reflecting nutrigenetic differences between individuals. Several
studies already investigated the heritability of classical clinical markers such as total cholesterol, HDL and LDL and found high proportions of heritability10, 11, but – in contrast to
lipoproteins - hardly anything is known about the heritability of molecular lipid species in humans. Scheitz _et al_.12 suggested that the lipid profile of _D_. _melanogaster_ is influenced
to a large extent by genetic factors, whereas proportions of odd and even numbered fatty acids were more environmentally influenced. Similar results were reported for the San Antonio Family
Heart Study for the human plasma lipidome in Mexican American families13. High fat diets enriched in saturated fatty acids are thought to be unhealthy by inducing dyslipidemia and insulin
resistance, increasing vascular inflammation and promoting obesity14,15,16. We postulate that individuals may be able to compensate the unfavourable effects of high fat diets (HFD) and that
the changes in a comprehensive lipid profile are not only part of this regulation but are also heritable. We therefore undertook a study in mono- and dizygotic twins to characterize the
metabolic adaptation after switching from a low fat to a high fat Western-style diet based on intakes, which are compatible with current food patterns. The study was performed under
isocaloric, weight stable conditions in healthy subjects without changes of physical activity to avoid confounding by weight change effects. RESULTS SUBJECT CHARACTERISTICS All 46 twin pairs
shown in Table 1 completed the study. The physiological characteristics of the cohort with respect to the study are summarized in Table 2. The slight, but significant increase in body
weight did not impair the success of the isocaloric study design and seemed to be sex specific. The significant difference between the first two clinical investigation days LF/HF1 (LF –
after six weeks low-fat diet; HF1 – after one week high-fat diet) and the clinical investigation day after six weeks of high-fat diet (HF6) averaged 0.5 kg, which is within a range of
natural fluctuation. Apart from this neither the waist-to-hip ratio (WHR) nor the unadjusted or age and sex adjusted body composition changed significantly. Therefore the effects of weight
gain or loss were reduced to a minimum in our results. Apart from this the total cholesterol as well as its LDL- and HDL-fraction increased as expected under a high fat diet, which also
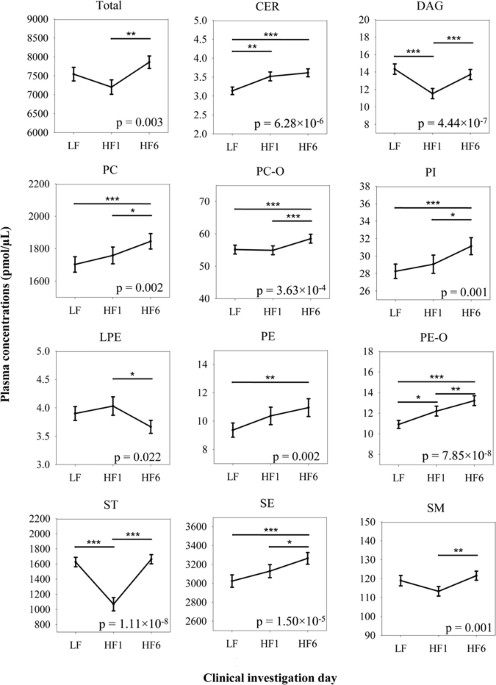
indicated a high adherence to the dietary targets. CHANGES OF LIPIDS UNDER HFD The majority of lipid classes, except LPCs and TAGs (Supplementary Figure S1), changed significantly during the
study. The total lipid concentration in plasma increasing between HF1 and HF6 (p = 0.003, rep.M. ANOVA). After LF we observed five different types of reactions: * 1. A monotonous increase
(PE-Os, PEs, pPE-Os = 7.85 × 10⁻⁸, pPEs = 0.002), * 2. An acute accumulation within one week HFD with a statistically stable plateau afterwards (CERs, pCERs = 6.28 × 10⁻⁶), * 3. A stable
concentration to HF1 with a delayed reaction in both directions afterwards (increase: PCs, PC-Os, PIs, SEs and SMs, pPCs = 0.002, pPC-Os = 3.63 × 10⁻⁴, pPIs = 0.001, pSEs = 1.50 × 10⁻⁵, pSMs
= 0.001; decrease: LPEs, pLPEs = 0.022), * 4. A counter regulation of the change occurring after 1 week after additional 5 weeks (STs and DAGs, pSTs = 1.11 × 10⁻⁸, pDAGs = 4.44 × 10−7) and
* 5. No reaction at all with statistically stable concentrations during the HFD (LPCs and TAGs, pLPCs = 0.348, pTAGs = 0.119) (Fig. 1). Although the classes as an entirety showed a specific
response pattern in their total concentrations, changes in the composition of individual lipid species occurred, too. The concentrations of 102 of the 150 lipid species (68%) changed
significantly during the study (0.044 ≥ p ≥ 5.63 × 10⁻¹⁵, rep.M. ANOVA; Supplementary Figure S2). 13 of them reacted thereby monotonously (3 decreased, 10 increased), whereas the majority of
species responded acutely between LF and HF1 (n = 45; 23 increased, 22 decreased) or in a delayed-fashion from HF1 to HF6 (n = 31; 30 increased, 1 decreased). The remaining 13 species
responded more adaptively with a counter regulation, with 11 decreasing at first and then increasing again. The 42 species, which did not change their concentrations at all, belonged to 8
different classes and consisted of more than half of the measured TAGs as well as half of the LPEs and nearly a third of the measured PCs and PC-Os. Our attempts to classify or cluster the
different changing lipid species were not successful. Neither the head groups nor the degree of saturation seemed to determine the reaction pattern of the species. This is also true for the
length or the presence of specific fatty acids. The degrees of saturation in the different lipid species did not show global response patterns despite of the high fat diet. Nevertheless, the
lipidome showed a significant change in flexibility (n = 150; p = 1.72 × 10⁻⁷, rep. M. ANOVA; Supplementary Figure S3). After a significant increase during the first week of HFD the median
flexibility of the lipid species decreased again and reached the initial value (LF: 0.22 [0.18, 0.28] vs. HF1: 0.24 [0.19, 0.33] vs. HF6: 0.23 [0.19, 0.30]). IMPACTS ON LIPID CONCENTRATIONS
We next analysed the impact of sex, BMI and age (linear and quadratic) by the fixed factors of linear mixed modelling on lipid concentration for the cumulative lipid classes as well as for
the lipid species. The latter enabled us to look for deviations of specific species concentrations compared with their class. 6 of the 13 classes as well as the total concentration of lipids
were sex dependent, with a decrease in five classes in male (SEs, pSEs = 4.00 × 10⁻⁴ and PCs, PEs, PIs, SMs, all p < 1 × 10⁻¹⁶) and a single class in female (LPCs, p < 1 × 10⁻¹⁶)
participants, respectively. Total concentration was also lower in male participants (pTotal = 0.002). In contrast BMI seemed to only affect the phosphatidylcholine ethers at class level by
increased concentrations in leaner participants (PC-Os: βBMI = −1.44, pBMI = 0.002; Fig. 2). CERs, SMs and STs (pCERs = 6.00 × 10⁻⁴, pSMs = 0.009, pSTs = 0.008) showed also significantly
lower concentrations in younger participants, whereas PIs seemed to decrease with higher age (all pPIs = 0.011). In addition to their linear age dependency PC-Os, SEs and TAGs had quadratic
effects of age with opposite direction (PC-Os: βage = 2.16, page < 1 × 10⁻¹⁶ vs. \({{\rm{\beta }}}_{{{\rm{age}}}^{2}}\) = −0.03, \({{\rm{p}}}_{{{\rm{age}}}^{2}}\) < 1 × 10⁻¹⁶; SEs:
βage = 65.36, page = 0.001 vs. \({{\rm{\beta }}}_{{{\rm{age}}}^{2}}\) = −0.64, \({{\rm{p}}}_{{{\rm{age}}}^{2}}\) = 0.011; TAGs: βage = −33.78, page = 0.026 vs. \({{\rm{\beta
}}}_{{{\rm{age}}}^{2}}\) = 0.41, \({{\rm{p}}}_{{{\rm{age}}}^{2}}\) = 0.029) indicating that the classes reacted differently in younger and older participants. The TAGs were negatively
age-dependent until an age of 40 to 41 and then increased with increasing age again, whereas the PC-Os and SEs had their highest concentrations at an age of 40 to 41 and 51, respectively.
The total concentration showed also a linear and quadratic effect of age, with the concentrations increasing until an age of 47 and decreasing again afterwards (Total: βage = 137.61, page =
0.012 vs. \({{\rm{\beta }}}_{{{\rm{age}}}^{2}}\) = −1.45, \({{\rm{p}}}_{{{\rm{age}}}^{2}}\) = 0.033). Surprisingly the polynomial effect of age for the classes of PC-Os and SEs seemed to be
driven by only a very small number of species or might be a synergetic effect. PC-O [36:5], SE [45:3, (27:1, 18:2)] and SE [47:5, (27:1, 20:4)] were the only species with significant age and
age2 effects (PC-O[36:5]: βage = 0.45, page < 1 × 10⁻¹⁶ vs. \({{\rm{\beta }}}_{{{\rm{age}}}^{2}}\) = −0.01, \({{\rm{p}}}_{{{\rm{age}}}^{2}}\) < 1 × 10⁻¹⁶; SE[45:3, (27:1, 18:2)]: βage
= 41.18, page = 8.00 × 10⁻⁴ vs. \({{\rm{\beta }}}_{{{\rm{age}}}^{2}}\) = −0.41, \({{\rm{p}}}_{{{\rm{age}}}^{2}}\) = 0.008; SE[47:5, (27:1, 20:4)]: βage = 8.88, page = 4.00 × 10⁻⁴ vs.
\({{\rm{\beta }}}_{{{\rm{age}}}^{2}}\) = −0.10, \({{\rm{p}}}_{{{\rm{age}}}^{2}}\) = 0.001) with the turning point at the age of 42, 51 and 44, respectively. In contrast none of the TAG
species had a significant quadratic age effect and only two of them were age dependent (TAG[52:4]: βage = −0.69, page = 0.017, TAG[54:4]: βage = −0.39, page = 0.016), which indicates a
synergetic effect. When the data was analysed at species level (Fig. 3), 25 of the 150 lipid species showed a significant age dependency (p < 0.04 to p < 1 × 10⁻¹⁶), with 24 being
members of also age dependent classes including four CERs and ten SEs. Thereby, the species effects always mirrored the class effect without exception. PC [36:5, (16:0, 20:5)] was the only
age affected species (βage = 0.14, page = 3.00 × 10⁻⁴) belonging to an age independent class and increased in older participants. In conclusion, age played a minor role in contrast to BMI
effects and sex differences. Although only PC-Os seemed to be BMI dependent on class level, 44 of the 150 species were significantly affected by the participants’ BMI (p < 0.042 to p <
1 × 10⁻¹⁶), with 22 decreasing and 22 increasing by increased BMI. Interestingly, all negatively associated lipid species belonged to classes of phospholipids and _vice versa_ only two
phosphatidylcholines with higher carbon atom amount (nC atoms ≥ 38) were positively associated with BMI. The 20 remaining increased lipid species were members of SE (3 of 14) and TAG (17 of
32). 75 of the 150 lipid species were significantly sex dependent (p < 0.05 to p < 1 × 10⁻¹⁶). 8 of the 75 species showed an unexpected sexual dimorphism, as their class overall did
not have a significant sex dependency. These 8 species belonged to LPE and PC-O, and a single TAG, with concentrations of the LPEs as well as one of the PC-Os being higher in male
participants and the concentrations of the remaining two PC-Os and the TAG being higher in female participants. The other 67 species mirrored the sex dependency of their class concentration
and were decreased in men. Nevertheless, the intercept, which was significant for all classes and 80% of the species, suggests that there are more influencing factors, which we have not
considered in our model, yet. HERITABILITY OF LIPID CONCENTRATIONS The twin design of the NUGAT study enabled us to estimate the heritability of the different lipid classes and species. The
linear mixed model added a fourth component representing unknown effects, which could not be described by the classic ACE model. In this way the model reveals a wide range of heritability in
lipid classes and single species up to 65% and 62% respectively (Fig. 4). Following our definition of a high heritability (A-value > 0.4), only the class of SM were mainly determined by
additive genetic effects (ASM = 0.650), with the remainder of the variance mainly driven by individual environment (ESM = 0.282) (Table S1). LPC and PE had a moderate heritability between 25
and 35%, respectively. The remaining classes seemed to be more environmentally determined, with SE, CER, and PC-O showing no heritability at all. Nevertheless, three of the classes also
showed very high proportions of unknown effects (ULPC = 0.449, UPE = 0.562, ULPE = 0.574), containing all lysophosholipid classes. The analysis on lipid species level again reveals a
remarkably more complex pattern than the analysis on class level (Table S2). 19 of the 150 lipid species had high A-values (>0.4) and were therefore highly heritable. Surprisingly, the
lipid with the highest A-value (PI [34:2, (18:2, 16:0)]; API [34:2, (18:2, 16:0)] = 0.621) did not belong to a heritable class (API = 0.007). Additionally, 16 of the 19 highly heritable
lipid species were phospholipids, including both measured phosphatidylethanolamines. In contrast 38 lipid species did not show any heritability, including 7 (50%) of the SEs as well as 15
(47%) TAGs. 33 of the 150 species (22%) showed also a high impact of the unknown effects up to almost 83% of the observed variance (UPC-O [32:0, (18:0, 14:0)] = 0.827). HERITABILITY OF
CHANGES IN LIPID CONCENTRATIONS After using the ACE model to calculate A,C and E for the changes from LF to HF1, HF1 to HF6 and LF to HF6, we could detect changes, which were highly
heritable across all three measurements, for only one species – PE [38:4, (20:4, 18:0)] (increased significantly between LF and HF6; cLF = 6.23 ± 0.34 vs. cHF6 = 6.78 ± 0.41 and cHF1 = 6.59
± 0.37 pm/µL, p = 0.026; AΔLF,HF1 = 0.54, AΔHF1,HF6 = 0.48, AΔLF,HF6 = 0.53). In contrast to this 113 of the 150 species did not have any notable heritability at all in their concentration
changes. The remaining 36 lipids showed only unsteady heritability without class or fatty acid dependency. DISCUSSION Our NUGAT study provides new insights into the relationship of the
lipidome and nutritional challenges in humans. Via high throughput quantitative mass spectrometry we were able to depict the variability of the human plasma lipidome on a molecular species
level. In addition, we present the first twin study that addresses the heritability of concentrations of human lipid species in blood. Our major finding was the high heritability of basal
concentrations of specific lipid species rather than lipid classes and their strong dependence on sex, BMI and age. This underlined the importance of reliable mass spectrometry-based
lipidomics to define their specific roles in predicting disease risks and disease progression. The high heritability resulted most likely from genetic variance in biosynthetic pathways. Our
data therefore provide guidance for targeted searches for genetic variants involved and require further studies. Lipid species are increasingly linked to specific pathologies and the more
heritable ones are likely to affect disease risk and progression in specific disease phenotypes. This opens a wide field of investigation to define the predictive and pathophysiological role
of lipids in medicine. We observed strong effects of sex in our rather young population. Sex effects may relate to genetic differences in the Y-chromosome, to imprinting or to sex steroid
dependent effects. The latter moreover vary in females with the ovarian cycle and most of our female twins were premenopausal. Lipid metabolism differs extensively between males and females
including the whole body lipid content, anthropometric lipid distribution particularly in the visceral and subcutaneous compartments, and turnover17,18,19. We were able to demonstrate a
strong sensitivity of changes in specific lipid concentrations already after a single week after the switch to a Western-style high fat diet, confirming the strong impact of diet on the
lipidome. Studies relating the lipidome to diseases therefore need detailed dietary information and, if possible, standardized diets. Unexpectedly, we observed limited heritability of the
diet induced changes in lipids despite – or rather because of - the significant effects of the diet. This implies that the reactions of lipid classes to nutrition may be rather conserved
among all subjects with little individual variation which would then result in low heritability estimates. An interesting aspect resulted from the observation that our healthy and mostly
young participants were partly able to adapt and deal with the nutritional challenge after additional five weeks. This applied to initial changes after 1 week, which induced an opposite
change after 6 weeks suggesting an adaptive response. The increasing and then decreasing flexibility of the lipidome, which indicates a synchronization of the mostly young cohorts’ lipidome
after the initial challenge, also supported this observation. This may reflect an important ability to compensate nutritional challenges of an unhealthy diet and may be a reason why high fat
diets show relatively modest associations with cardiovascular disease6. It is likely, that this flexibility decreases in the presence of metabolic diseases such as obesity, dyslipidaemia or
impaired glucose metabolism. In addition, age is likely to play a major role in metabolic flexibility and future studies should address this aspect in more detail. Moreover, the ability or
inability to adapt may determine future risks of diet related diseases. Therefore dietary tests may be devised based on the ability to regulate disease related lipid species and these tests
should include short term and longer term lipidomic responses. Importantly, the changes in species not only seemed to be much more complex than the changes in their overall classes; it was
impossible to classify the differently reacting species according to their head group, degree of saturation or related chemical properties. A similar diversity was found for the heritability
of lipid concentrations. Especially the most heritable lipid species (PI [34:2, (18:2, 16:0)]) belonged to a non-heritable class (A = 0.007), whose other members only reached mostly low or
moderate A-values (<0.39). This might be a hint to a central role of this specific species in its lipid class. However, additive genetic effects must be considered for sex, BMI and age.
Limitations of our study apply to the ethnicities since only Caucasian subjects were studied. Furthermore, we included a variance component for unknown effects (U) in our linear mixed
models. Possible explanations for this unknown variance might be short-term fluctuations and also technical variability. Also dominant genetic effects, which were set equal to zero in the
ACE model, might influence this component as well as other life style factors (e.g. smoking [25 smoker, 12 ex-smoker] or drinking), which we did not regard. Further investigations to clarify
this proportion of variance are needed. Lipidomics requires more characterization and understanding of its complexity, interactions and functions12, 13 in particular, with regard to
specific and minor lipid classes. For example, a study in Finish twins4 described associations between obesity and increasing concentrations of lysophosphatidylcholines, whereas Barber _et
al_.20 observed the opposite with decreased concentrations of LPCs in obesity and Type II diabetes. Our data suggest that it is necessary to distinguish between different species as the
overall concentrations of lipid classes were not informative. Additionally, Ishikawa _et al_.17 showed, that not only age and sex altered the lipid profile, but also the interaction of both
factors. There is a scientific consensus that concentrations of lipoproteins such as HDL and LDL are highly heritable in humans and associated with disease risks21,22,23. However there are
only few studies addressing the heritability of the lipid profile itself. Scheitz _et al_.12 could detect that most lipid classes were highly heritable in 92 inbred lines of _D_.
_melanogaster_, although especially PEs and PCs had species with a greater variability in the proportions of additive genetic effects. Apart from the degree of saturation, the ratio of PCs
to PEs – as main structural membrane components - is a crucial regulator for membrane fluidity and therefore equally important for homeoviscous and thermal adaptation in poikilothermic
organisms12, 24, 25. Homoeothermic organisms, like humans, do also alter their membrane fluidity to control e.g. permeability and activity of membrane proteins, which might be an explanation
for the great variability of heritable and non-heritable species of PCs and PEs, which we could confirm. Interestingly, the great variability of heritable and non-heritable species seemed
to occur also in other subsets of human plasma metabolomics. Liu _et al_.26 observed a heritability pattern for 342 plasma proteins in their twin population with apolipoprotein (a) having
the highest heritability, which looks quite similar to our heritability pattern of the plasma lipidomics. Obviously, it is of importance to control for confounders such as weight/BMI, age
and life style factors, particularly nutrition. Only the understanding of the characteristics of a healthy lipid profile will lead to the ability to investigate lipidomics in diseases.
Therefore, the next steps in the NUGAT study will be to clarify the function and interaction of lipid species and interdependencies with genomic and metabolic data in our healthy
participants. MATERIAL AND METHODS PARTICIPANTS The _NutriGenomic Analysis in Twins_ (NUGAT) study involved a cohort of 92 participants (46 pairs of twins – 34 monozygotic and 12 dizygotic),
58 female and 34 male. The age ranged from 18 to 70 with a median of 25. Only twins with a Body Mass Index (BMI = weight [kg]/height [m] × height [m]) between 18 and 30 kg/m2 were included.
Physiological data of the participants at Screening are summarized in Table 1. STUDY DESIGN The NUGAT study was registered at www.clinicaltrials.gov (June 1, 2012, NCT01631123). The study
protocol was approved by the local Ethical Committee of the Charité University of Medicine, Berlin, Germany, and was in accordance with the Declaration of Helsinki of 1975, as revised in
1983. All participants gave written informed consent prior to the study. Aim of the study was to investigate the metabolic response to a nutritional intervention consisting of an isocaloric
shift from a low fat to a high fat diet. Additionally, the study was designed as a twin study to examine different (nutri-) genetic factors e.g. the heritability of selected biomarkers in
this context. A time line of the study is shown in Fig. 5. The pairs of twins, recruited from a twin register (HealthTwiSt GmbH, Berlin, Germany) and by public advertisements from the
general population of Berlin and Brandenburg in Germany, arrived at the metabolic research unit at the German Institute for Human Nutrition for a baseline measurement (screening). The
participants started the study with a six weeks period of carbohydrate-rich, low fat diet (30E% fat, 55E% carbohydrates, 15E% protein), which we used to standardize the nutritional behaviour
of our participants. After the standardization they switched to six weeks of a low carbohydrate, high fat diet (45E% fat, 40E% carbohydrates, 15E% protein). Both diets were adjusted in
accordance with the individual energy requirements of the participants and were composed isocaloric. During the last week of the carbohydrate-rich low fat diet as well as the first and sixth
week of the low carbohydrate high fat diet approximately 70% of the food was provided and the participants received detailed meal plans for each day to ensure a standardized dietary
pattern. The investigation was carried out over three different days as follows: The first clinical investigation day (LF) was performed directly at the end of the normalization period. The
second investigation day (HF1) was set after one week on the high fat diet and the third (HF6) after additional five weeks on the HFD, to assess not only the short-term but also the
long-term effects of the higher fat intake. MASS SPECTROMETRY LIPIDOMICS Mass spectrometry-based lipid analysis was performed at Lipotype GmbH (Dresden, Germany) as described elsewhere27.
Plasma lipids were extracted with methyl tert-butyl ether/methanol (7:2, V:V) as in Matyash _et al_.28. Plasma was diluted 50× with 150 mM ammonium bicarbonate (in water). For lipid
extraction an equivalent of 1 µL of undiluted plasma was used. Internal standards were pre-mixed with the organic solvents mixture. The internal standard mixture contained (per one extracted
sample): 1 nmol cholesterol D6, 100 pmol cholesterol ester 20:0 (SE), 50 pmol ceramide 18:1;2/17:0 (CER), 100 pmol diacylglycerol 17:0/17:0 (DAG),500 pmol phosphatidylcholine 17:0/17:0
(PC), 50 pmol phosphatidylethanolamine 17:0/17:0 (PE), 50 pmol phosphatidylinositol 16:0/16:0 (PI), 50 pmol lysophosphatidylcholine 12:0, (LPC) 30 pmol lysophosphatidylethanolamine 17:1
(LPE), 50 pmol triacylglycerol 17:0/17:0/17:0 (TAG) and 200 pmol sphingomyelin 18:1;2/12:0 (SM). After extraction, the organic phase was transferred to an infusion plate and dried in a speed
vacuum concentrator. Dried extract was re-suspended in 7.5 mM ammonium acetate in chloroform/methanol/propanol (1:2:4, V:V:V). All liquid handling steps were performed using Hamilton
Robotics STARlet robotic platform with the Anti Droplet Control feature for organic solvents pipetting. Samples were analysed by direct infusion in a QExactive mass spectrometer (Thermo
Scientific) equipped with a TriVersa NanoMate ion source (Advion Biosciences). Samples were analysed in both positive and negative ion modes with a resolution of Rm/z = 200 = 280000 for MS
and Rm/z = 200 = 17500 for MSMS experiments, in a single acquisition. MSMS was triggered by an inclusion list encompassing corresponding MS mass ranges scanned in 1 Da increments. Both MS
and MSMS data were combined to monitor CE, DAG and TAG ions as ammonium adducts; PC, PC O-, as acetate adducts; and PE, PE O- and PI as deprotonated anions. MS only was used to monitor LPE
as deprotonated anion; CER, SM and LPC as acetate adducts and cholesterol as ammonium adduct. Data were analysed with in-house developed lipid identification software based on
LipidXplorer29, 30. Data post-processing and normalization were performed using an in-house developed data management system. Only lipid identifications with measured mass deviations below 3
ppm from the theoretical mass for MS and 8 ppm for MSMS peaks, a signal-to-noise ratio >5, and a signal intensity 5-fold higher than in corresponding blank samples were considered for
further data analysis. With this method 150 lipid species from 13 classes (Supplementary Figure S4) were measured in 246 fasted blood samples on each clinical investigation day. The batch
corrected dataset spanned all major lipid classes including the information on fatty acids of different degrees of saturation and various odd and even carbon chain lengths (Table 3). The
lipidomic data is open accessible as Supplementary Material. OTHER MEASUREMENTS Routine serum and fasted blood parameters were measured using standard techniques (ABX Pentra 4000, HORIBA ABX
SAS, Montpellier, France). Low density lipoprotein cholesterol concentrations were calculated using the Friedewald formula31. STATISTICAL ANALYSIS Before the data was released for analysis,
an analysis of plausibility was performed. Unusual values that were outside of 3-fold interquartile range (IQR) were declared as extreme outliers and were not considered in further
analysis. For the study of heritability, the ACE model for _A_dditive genetics, _C_ommon and unique _E_nvironment was applied for every clinical investigation day. This is a model based on a
covariance analysis of the mono- and dizygotic twin pairs, in which the variance is determined that can be traced back to additive genetics (a2), common environment (c2) and individual
environment (e2) of the twins32. A more detailed description of the structural equation models (including ACE model) can be found in the Supplementary Material. The ACE model was also
checked against the simpler AE model based on a likelihood ratio test and replaced if necessary. For each lipid class and for each lipid species, we fitted the linear mixed-effects model33:
$$\begin{array}{rcl}{{\rm{y}}}_{{\rm{ij}}} & = & {{\rm{\beta }}}_{0}+{{\rm{\beta }}}_{{\rm{sex}}}{{\rm{x}}}_{{\rm{ij}}}^{({\rm{sex}})}+{{\rm{\beta
}}}_{{\rm{BMI}}}{{\rm{x}}}_{{\rm{ij}}}^{({\rm{BMI}})}+{{\rm{\beta }}}_{{\rm{age}}}{{\rm{x}}}_{{\rm{ij}}}^{({\rm{age}})}+{{\rm{\beta
}}}_{{{\rm{age}}}^{2}}{{\rm{x}}}_{{\rm{ij}}}^{({{\rm{age}}}^{2})}\\ & & +{{\rm{\beta
}}}_{{\rm{CID}}}{{\rm{x}}}_{{\rm{ij}}}^{({\rm{CID}})}\,+{{\rm{u}}}_{{{\rm{a}}}^{2}{\rm{j}}}{{\rm{z}}}_{{\rm{ij}}}^{({{\rm{a}}}^{2})}+{{\rm{u}}}_{{{\rm{c}}}^{2}{\rm{j}}}{{\rm{z}}}_{{\rm{ij}}}^{({{\rm{c}}}^{2})}+{{\rm{u}}}_{{{\rm{e}}}^{2}{\rm{j}}}{{\rm{z}}}_{{\rm{ij}}}^{({{\rm{e}}}^{2})}+{\epsilon
}_{{\rm{ij}}}\end{array}$$ with fixed factors for sex, BMI, age, age2 and clinical investigation day (CID, representing the diet) and random effects for the repeated measured ACE model,
with j ∈ (1, …, 92) as subject index and i ∈ (0, …, 3) as CID index. On this occasion the age effect was considered with two factors, a linear and a quadratic, because it is well known, that
age effects were not linear in most cases. Both terms allowed describing parabolic interactions between age and the dependent variable and identifying the turning point. Akaike’s
information criterion (AIC) was used to find the best fitted model. Heritability was defined as \({\rm{A}}={{\rm{\sigma }}}_{{{\rm{a}}}^{2}}^{2}/{{\rm{\sigma }}}_{{\rm{total}}}^{2}\) with
\({{\rm{\sigma }}}_{{\rm{total}}}^{2}={{\rm{\sigma }}}_{{{\rm{a}}}^{2}}^{2}+{{\rm{\sigma }}}_{{{\rm{c}}}^{2}}^{2}+{{\rm{\sigma }}}_{{{\rm{e}}}^{2}}^{2}+{{\rm{\sigma }}}_{\varepsilon }^{2}\),
and the rest of the variance components were defined in the same way with C for the common environment, E for the individual environment and U for the variance, we could not explain in the
model represented by the residuals. An A-value greater than 0.40 was defined as high heritability and used as threshold. To investigate the changes of the lipids a single factor univariate
analysis of variance (ANOVA) with repeated measures (rep.M.) and Bonferroni adjustment was used. The requirements for the ANOVA were tested by the Shapiro-Wilk-test and Mauchly’s
sphericity-test with ln- and/or Greenhouse-Geisser transformation if necessary. The flexibility of a lipid was defined as the quartiles dispersion coefficient (QDC) of the CID dependent
lipid concentrations, which is calculated as:
$${{\rm{QDC}}}_{{\rm{Lipid}},{\rm{CID}}}={[\frac{0.5({{\rm{Quartile}}}_{0.75}-{{\rm{Quartile}}}_{0.25})}{0.5({{\rm{Quartile}}}_{0.75}+{{\rm{Quartile}}}_{0.25})}]}_{{\rm{Lipid}},{\rm{CID}}}.$$
Unless otherwise stated, a significance level of α = 0.05 was used. If the global significance level had to be adjusted due to multiple testing, the Benjamini-Hochberg method was used. All
mean values are given as mean ± SEM, all median values as median, [Q0.25, Q0.75] (=IQR0.25, 0.75). The calculations were performed with IBM SPSS Statistics (version 20) and the integrated
development environment RStudio (version 0.98.1091), which is based on R (and 3.1.2). The ACE model was executed in an older version of R (version 2.1.5), since the necessary package OpenMX
was not upward compatible. Graphs were designed in Sigma Plot (version 11). REFERENCES * Jove, M. _et al_. Plasma lipidomics discloses metabolic syndrome with a specific HDL phenotype.
_FASEB journal: official publication of the Federation of American Societies for Experimental Biology_ 28, 5163–5171, doi:10.1096/fj.14-253187 (2014). Article CAS Google Scholar *
Farooqui, A. A., Rapoport, S. I. & Horrocks, L. A. Membrane phospholipid alterations in Alzheimer’s disease: deficiency of ethanolamine plasmalogens. _Neurochemical research_ 22, 523–527
(1997). Article CAS PubMed Google Scholar * Murphy, E. J., Schapiro, M. B., Rapoport, S. I. & Shetty, H. U. Phospholipid composition and levels are altered in Down syndrome brain.
_Brain research_ 867, 9–18 (2000). Article CAS PubMed Google Scholar * Pietilainen, K. H. _et al_. Acquired obesity is associated with changes in the serum lipidomic profile independent
of genetic effects–a monozygotic twin study. _PloS one_ 2, e218, doi:10.1371/journal.pone.0000218 (2007). Article ADS PubMed PubMed Central Google Scholar * Yang, J. _et al_.
Discrimination of Type 2 diabetic patients from healthy controls by using metabonomics method based on their serum fatty acid profiles. _Journal of chromatography. B, Analytical technologies
in the biomedical and life sciences_ 813, 53–58, doi:10.1016/j.jchromb.2004.09.023 (2004). Article CAS PubMed Google Scholar * Chowdhury, R. _et al_. Association of dietary,
circulating, and supplement fatty acids with coronary risk: a systematic review and meta-analysis. _Annals of internal medicine_ 160, 398–406, doi:10.7326/M13-1788 (2014). Article PubMed
Google Scholar * Graler, M. H. & Goetzl, E. J. Lysophospholipids and their G protein-coupled receptors in inflammation and immunity. _Biochimica et biophysica acta_ 1582, 168–174
(2002). Article CAS PubMed Google Scholar * Heimerl, S. _et al_. Alterations of plasma lysophosphatidylcholine species in obesity and weight loss. _PloS one_ 9, e111348,
doi:10.1371/journal.pone.0111348 (2014). Article ADS PubMed PubMed Central Google Scholar * Sigruener, A. _et al_. Glycerophospholipid and sphingolipid species and mortality: the
Ludwigshafen Risk and Cardiovascular Health (LURIC) study. _PloS one_ 9, e85724, doi:10.1371/journal.pone.0085724 (2014). Article ADS PubMed PubMed Central Google Scholar * Despres, J.
P. _et al_. Heredity and changes in plasma lipids and lipoproteins after short-term exercise training in men. _Arteriosclerosis_ 8, 402–409 (1988). Article CAS PubMed Google Scholar *
Beekman, M. _et al_. Heritabilities of apolipoprotein and lipid levels in three countries. _Twin research: the official journal of the International Society for Twin Studies_ 5, 87–97,
doi:10.1375/1369052022956 (2002). Article Google Scholar * Scheitz, C. J., Guo, Y., Early, A. M., Harshman, L. G. & Clark, A. G. Heritability and inter-population differences in lipid
profiles of Drosophila melanogaster. _PloS one_ 8, e72726, doi:10.1371/journal.pone.0072726 (2013). Article ADS CAS PubMed PubMed Central Google Scholar * Bellis, C. _et al_. Human
plasma lipidome is pleiotropically associated with cardiovascular risk factors and death. _Circulation. Cardiovascular genetics_ 7, 854–863, doi:10.1161/CIRCGENETICS.114.000600 (2014).
Article CAS PubMed PubMed Central Google Scholar * McGuire, S. U. S. Department of Agriculture and U.S. Department of Health and Human Services, Dietary Guidelines for Americans, 2010.
7th Edition, Washington, DC: U.S. Government Printing Office, January 2011. _Advances in nutrition_ 2, 293–294, doi:10.3945/an.111.000430 (2011). Article PubMed PubMed Central Google
Scholar * Gregor, M. F. & Hotamisligil, G. S. Inflammatory mechanisms in obesity. _Annual review of immunology_ 29, 415–445, doi:10.1146/annurev-immunol-031210-101322 (2011). Article
CAS PubMed Google Scholar * Haslam, D. W. & James, W. P. Obesity. _Lancet_ 366, 1197–1209, doi:10.1016/S0140-6736(05)67483-1 (2005). Article PubMed Google Scholar * Ishikawa, M.
_et al_. Plasma and serum lipidomics of healthy white adults shows characteristic profiles by subjects’ gender and age. _PloS one_ 9, e91806, doi:10.1371/journal.pone.0091806 (2014). Article
ADS PubMed PubMed Central Google Scholar * Lappas, M. _et al_. The prediction of type 2 diabetes in women with previous gestational diabetes mellitus using lipidomics. _Diabetologia_
58, 1436–1442, doi:10.1007/s00125-015-3587-7 (2015). Article CAS PubMed Google Scholar * Miao, H. _et al_. Plasma lipidomics reveal profound perturbation of glycerophospholipids, fatty
acids, and sphingolipids in diet-induced hyperlipidemia. _Chemico-biological interactions_ 228, 79–87, doi:10.1016/j.cbi.2015.01.023 (2015). Article CAS PubMed Google Scholar * Barber,
M. N. _et al_. Plasma lysophosphatidylcholine levels are reduced in obesity and type 2 diabetes. _PloS one_ 7, e41456, doi:10.1371/journal.pone.0041456 (2012). Article ADS CAS PubMed
PubMed Central Google Scholar * Pietilainen, K. H. _et al_. HDL subspecies in young adult twins: heritability and impact of overweight. _Obesity_ 17, 1208–1214, doi:10.1038/oby.2008.675
(2009). PubMed Google Scholar * Kaess, B. _et al_. The lipoprotein subfraction profile: heritability and identification of quantitative trait loci. _Journal of lipid research_ 49, 715–723,
doi:10.1194/jlr.M700338-JLR200 (2008). Article CAS PubMed Google Scholar * Heller, D. A., de Faire, U., Pedersen, N. L., Dahlen, G. & McClearn, G. E. Genetic and environmental
influences on serum lipid levels in twins. _The New England journal of medicine_ 328, 1150–1156, doi:10.1056/NEJM199304223281603 (1993). Article CAS PubMed Google Scholar * Overgaard, J.
_et al_. Effects of acclimation temperature on thermal tolerance and membrane phospholipid composition in the fruit fly Drosophila melanogaster. _Journal of insect physiology_ 54, 619–629,
doi:10.1016/j.jinsphys.2007.12.011 (2008). Article CAS PubMed Google Scholar * Cooper, B. S., Hammad, L. A., Fisher, N. P., Karty, J. A. & Montooth, K. L. In a variable thermal
environment selection favors greater plasticity of cell membranes in Drosophila melanogaster. _Evolution; international journal of organic evolution_ 66, 1976–1984,
doi:10.1111/j.1558-5646.2011.01566.x (2012). Article PubMed Google Scholar * Liu, Y. _et al_. Quantitative variability of 342 plasma proteins in a human twin population. _Molecular
systems biology_ 11, 786, doi:10.15252/msb.20145728 (2015). Article PubMed PubMed Central Google Scholar * Surma, M. A. _et al_. An automated shotgun lipidomics platform for high
throughput, comprehensive, and quantitative analysis of blood plasma intact lipids. _Eur J Lipid Sci Technol_ 117, 1540–1549, doi:10.1002/ejlt.201500145 (2015). Article CAS PubMed PubMed
Central Google Scholar * Matyash, V., Liebisch, G., Kurzchalia, T. V., Shevchenko, A. & Schwudke, D. Lipid extraction by methyl-tert-butyl ether for high-throughput lipidomics. _J
Lipid Res_ 49, 1137–1146, doi:10.1194/jlr.D700041-JLR200 (2008). Article CAS PubMed PubMed Central Google Scholar * Herzog, R. _et al_. A novel informatics concept for high-throughput
shotgun lipidomics based on the molecular fragmentation query language. _Genome Biol_ 12, R8, doi:10.1186/gb-2011-12-1-r8 (2011). Article CAS PubMed PubMed Central Google Scholar *
Herzog, R. _et al_. LipidXplorer: a software for consensual cross-platform lipidomics. _PLoS One_ 7, e29851, doi:10.1371/journal.pone.0029851 (2012). Article ADS CAS PubMed PubMed
Central Google Scholar * Friedewald, W. T., Levy, R. I. & Fredrickson, D. S. Estimation of the concentration of low-density lipoprotein cholesterol in plasma, without use of the
preparative ultracentrifuge. _Clinical chemistry_ 18, 499–502 (1972). CAS PubMed Google Scholar * Maes, H. H. In _Encyclopedia of Statistics in Behavioral Science_ (John Wiley & Sons,
Ltd 2005). * Oberg, A. L. & Mahoney, D. W. Linear mixed effects models. _Methods in molecular biology_ 404, 213–234, doi:10.1007/978-1-59745-530-5_11 (2007). Article PubMed Google
Scholar Download references ACKNOWLEDGEMENTS We thank the staff of our research ambulance, Melanie Hannemann, Alexandra Ullrich, Dominique Zschau, as well as our technical assistance Katrin
Sprengel and Tanja Ahrens for their excellent support. We would also like to thank Daniela Hoffmann for additional dietary advice, Anne-Cathrin Seltmann for carrying out the study, and of
course all participants for their cooperation. This work was supported by the German Federal Ministry of Education and Research (BMBF, No. 0315424). The publication of this article was
funded by the Open Access Fund of the Leibniz Association. AUTHOR INFORMATION AUTHORS AND AFFILIATIONS * Department of Clinical Nutrition, German Institute of Human Nutrition
Potsdam-Rehbruecke, Nuthetal, Germany Turid Frahnow, Martin A. Osterhoff, Silke Hornemann, Michael Kruse & Andreas F. H. Pfeiffer * German Center for Diabetes Research (DZD), Nuthetal,
Germany Turid Frahnow, Martin A. Osterhoff & Andreas F. H. Pfeiffer * Department of Endocrinology, Diabetes and Nutrition, Charité – University of Medicine, Berlin, Germany Michael Kruse
& Andreas F. H. Pfeiffer * Lipotype GmbH, Dresden, Germany Michal A. Surma, Christian Klose & Kai Simons Authors * Turid Frahnow View author publications You can also search for
this author inPubMed Google Scholar * Martin A. Osterhoff View author publications You can also search for this author inPubMed Google Scholar * Silke Hornemann View author publications You
can also search for this author inPubMed Google Scholar * Michael Kruse View author publications You can also search for this author inPubMed Google Scholar * Michal A. Surma View author
publications You can also search for this author inPubMed Google Scholar * Christian Klose View author publications You can also search for this author inPubMed Google Scholar * Kai Simons
View author publications You can also search for this author inPubMed Google Scholar * Andreas F. H. Pfeiffer View author publications You can also search for this author inPubMed Google
Scholar CONTRIBUTIONS A.F.H.P. had full access to all of the data in the study and takes responsibility for the integrity of the data and the accuracy of the data analysis. T.F. and M.A.O.
were responsible for the data analysis and statistical evaluation. A.F.H.P. was responsible for the design of the study and grant acquisition. S.H. conducted the study and M.K. initiate the
lipidomic analysis. K.S., M.A.S., C.K. were responsible for the laboratory data collection. A.F.H.P., T.F. were responsible for the drafting of the manuscript. The final content was T.F.’s
primary responsibility. All authors read, critically reviewed and approved the final manuscript. CORRESPONDING AUTHOR Correspondence to Turid Frahnow. ETHICS DECLARATIONS COMPETING INTERESTS
K.S., M.A.S. and C.K. have paid employment at Lipotype GmbH. This does not alter the authors’ adherence to all policies on sharing data and materials. T.F., M.A.O., S.H., M.K., A.F.H.P. had
no conflicts of interests. The funding organization had no influence in the study design; in the collection, analysis, interpretation of data; in the writing of the report; and in the
decision to submit the paper for publication. ADDITIONAL INFORMATION PUBLISHER'S NOTE: Springer Nature remains neutral with regard to jurisdictional claims in published maps and
institutional affiliations. ELECTRONIC SUPPLEMENTARY MATERIAL SUPPLEMENTARY MATERIAL MEDIA S1 DATASET 1 RIGHTS AND PERMISSIONS OPEN ACCESS This article is licensed under a Creative Commons
Attribution 4.0 International License, which permits use, sharing, adaptation, distribution and reproduction in any medium or format, as long as you give appropriate credit to the original
author(s) and the source, provide a link to the Creative Commons license, and indicate if changes were made. The images or other third party material in this article are included in the
article’s Creative Commons license, unless indicated otherwise in a credit line to the material. If material is not included in the article’s Creative Commons license and your intended use
is not permitted by statutory regulation or exceeds the permitted use, you will need to obtain permission directly from the copyright holder. To view a copy of this license, visit
http://creativecommons.org/licenses/by/4.0/. Reprints and permissions ABOUT THIS ARTICLE CITE THIS ARTICLE Frahnow, T., Osterhoff, M.A., Hornemann, S. _et al._ Heritability and responses to
high fat diet of plasma lipidomics in a twin study. _Sci Rep_ 7, 3750 (2017). https://doi.org/10.1038/s41598-017-03965-6 Download citation * Received: 06 September 2016 * Accepted: 08 May
2017 * Published: 16 June 2017 * DOI: https://doi.org/10.1038/s41598-017-03965-6 SHARE THIS ARTICLE Anyone you share the following link with will be able to read this content: Get shareable
link Sorry, a shareable link is not currently available for this article. Copy to clipboard Provided by the Springer Nature SharedIt content-sharing initiative