Play all audios:
Magnetism in graphene has stimulated extensive studies to search for novel metal-free magnetic device. In this paper, we use a synthesis method far from equilibrium state named
self-propagating high temperature synthesis (SHS) to produce few-layer graphene with different defect contents and then use a heat treatment process (vacuum-annealing and air-cooling) to
further control the defects in graphene. We find that the type and content of defects in graphene can be controlled by adjusting the mole ratio of reactants (Mg: CaCO3) for SHS reaction and
the temperature of the subsequent heat treatment. The deviation of the ratio of reactants from stoichiometric ratio benefits the production of graphene with higher concentration of defects.
It is indicated that the temperature of the heat treatment has remarkable influences on the structure of graphene, Raman-sensitive defects can be recovered partly by heat treatment while
IR-sensitive defects are closely related with the oxidation and decomposition of the oxygen-containing groups at elevated temperature. This work indicates that SHS is a promising method to
produce graphene with special magnetism, and the heat treatment is an effective way to further adjust the magnetism of graphene. This work sheds light on the study to develop carbon
materials with controlled ferromagnetism.
Graphene has generated a lot of activity in the area of material science due to its exceptional electronic and mechanical properties1, 2. Compared with other properties, magnetism in
graphene3,4,5,6,7,8 has stimulated extensive studies to search for novel metal-free magnetic device. The emergence of magnetism in versatile natured graphene and the ability to control its
properties can lead graphene to be an excellent material for spintronics and other memory based device applications which promise information storing, processing and communicating at faster
speed with lower energy consumption. Research on the origin of magnetism in graphene oxide9, graphene nanoflakes10,11,12, hydrogenated graphene13 and graphene nanoribbons14 suggested that
the magnetic behavior of graphene based materials is to a large part governed by their structures. Although the mechanism of graphene magnetism is complicated, extensive theoretical and
experimental studies indicated that defects15, disordering4, covalent-adsorption16 and magnetic edge state in graphene nanoribbons17 and partially hydrogenated epitaxial graphene13 are the
potential carriers for the magnetism in graphene.
Ferromagnetism has also been observed in graphene materials prepared by different methods like thermal exfoliation of graphitic oxide, conversion of nano diamonds, arc evaporation of
graphite in hydrogen and graphene oxide partially reduced by hydrazine and further completely reduced by thermal annealing, since graphene obtained by different methods has different types
and quantity of defects13. Recently, we have developed a facile and cost-effective method named as self-propagating high temperature synthesis (SHS) to produce few-layer graphene18. The SHS
process utilizes the heat generated by the exothermic reaction of Mg and CaCO3 to sustain itself in the form of a combustion wave after external ignition. The process is of high reaction
temperature, fast heating and cooling speed and far from equilibrium state, so the defect in graphene made by this method is special. We have found that few-layer graphene samples both
non-doped and doped with nitrogen produced by SHS method exhibit ferromagnetic properties and have high Curie temperatures (>600 K), and the saturation magnetization and coercive field
increase with the increasing of nitrogen contents in the samples19. Taking advantage of the far-from-equilibrium-state SHS process, people are expected to produce graphene with different
kinds and contents of defects, which helps further clarify the relationship between defects and the ferromagnetic properties of graphene. However, few works have been done on these issues.
In the present study, firstly, we explored the method to produce few-layer graphene with different defect concentrations by changing the ratio of reactants (Mg: CaCO3) in SHS process.
Secondly, in order to further improve the magnetic property of SHS graphene, we proposed a heat treatment method (vacuum-annealing and air-cooling), which is heating the sample in vacuum
environment at a certain high temperature and then cooling down to room temperature in atmospheric environment. Our works indicated that the deviation of stoichiometric ratio of the
reactants under far from equilibrium state is a promising method to produce graphene with special magnetism, and that the designed heat treatment is an effective way to further adjust the
ferromagnetism of graphene.
Here, we used the SHS method to synthesize graphene with different content of defects by changing the ratio of reactants: magnesium, (99.5% purity) and calcium carbonate (CaCO3, 99.5%
purity); these materials were purchased from Sinopharm Chemical Reagent Co., Ltd.
The SHS experiments were conducted in a stainless-steel combustion chamber under an atmosphere of carbon dioxide (99.9%)19. In order to investigate the effect of reactant composition on the
chemical and ferromagnetic properties of graphene, the molar ratios of Mg and CaCO3 were chosen as 2:1 and 4:1; the ratio (2:1) is a stoichiometric ratio according to the reaction: 2Mg +
CaCO3 = 2MgO + CaO + C (graphene), while the ratio (4:1) was designed to deviate from the stoichiometric ratio. The products were expressed as M2C1 and M4C1, respectively, according to the
ratios of Mg and CaCO3. 16 grams of Mg for M2C1 and 32 grams for M4C1 were added to 33.3 grams of calcium carbonate and then milled in a mortar for 20 minutes, respectively. Each sample was
ignited by an electric ignition device composed by a direct current (DC) power source and a resistance-based wire heater. The ignition current was 22 A. The coarse product was placed in
dilute hydrochloric acid (10 v/v %) containing ethanol (20 wt %) and sonicated for 1 h, then washed with deionized water and absolute ethanol in that order. The obtained sample was dried in
a vacuum oven at 120 °C for 24 h.
Every graphene sample (M2C1 or M4C1) was divided into 4 parts and three of them were heated at 500 K, 650 K and 800 K, and named as M2C1-500 or M4C1-500, M2C1-650 or M4C1-650 and M2C1-800 or
M4C1-800, respectively. As a contrast, the initial M2C1 and M4C1 sample without heat treatment was named as M2C1-G and M4C1-G (G stands for the generated graphene). The heating rate from
room temperature to the desired temperature was 5 K·min−1 and kept for 5 min in vacuum (10−4 Pa), then cooled down to room temperature within 5 minutes in air by opening the valve.
The phase composition of the as-prepared powders was analyzed by powder X-ray diffraction (XRD) analyses (Philips X’Pert diffractometer) with CuKα radiation. Environmental scanning electron
microscopy (ESEM, Helios Nanolab 600i) and high-resolution transmission electron microscopy (HRTEM JEM-2100) were used to observe the morphology of the graphene sheets. The TEM specimens
were prepared by dropping ethanol/water (38 v/v %) solution containing 1 wt % graphene onto a copper grid and drying at 100 °C. Raman spectra was obtained using a Raman Station (B & WTEK,
BWS435-532SY) with a 532 nm wavelength laser corresponding to 2.34 eV. X-ray photoelectron spectroscopy (XPS, Thermo Fisher) was utilized to determine the bonding characteristics of the
samples. All XPS peaks were calibrated according to the C 1 s peak (284.6 eV). The magnetic properties were measured using a Quantum Design MPMS magnetometer based on a superconducting
quantum interference device (SQUID). Thermogravimetric analysis (TGA) was performed on a Netzsch STA 449 F3 under a heating rate of 10 K·min−1 in air atmosphere form 300 K to 1200 K. The
nitrogen adsorption/desorption measurements were carried out on Belsorp mini II (Japan) at 77 K to obtain the specific surface area of M2C1-G and M4C1-G. Before adsorption/desorption tests,
the samples were degassed at 150 °C for 4 hours with vacuum pumping.
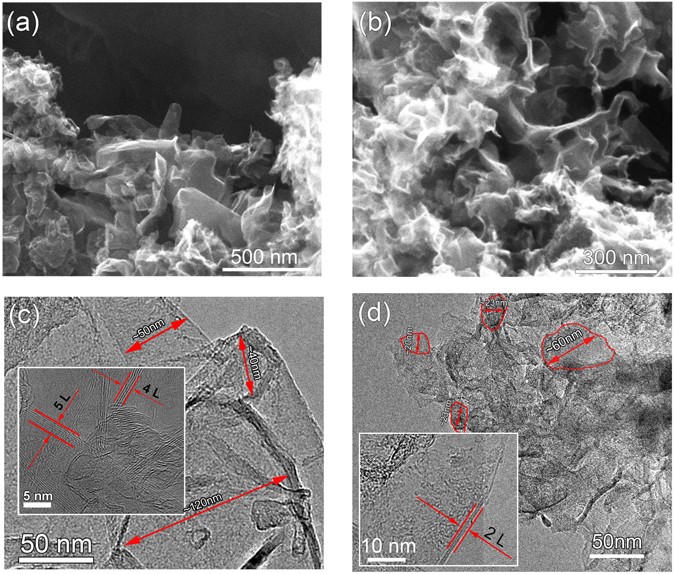
Figure 1 shows the typical SEM and TEM images of the SHS products. Figure 1(a) and (b) are the SEM images of M2C1-G and M4C1-G, respectively. In the images, thin corrugated sheets can be
found assembled together, showing a three dimensional porous structure. In addition, the EDX of both samples have been provided in the Supplementary Information Fig. S1 and Table S1. It
reveals that both M2C1-G and M4C1-G are mainly composed of C and O, and a small amount of Ca and Mg. The components of their composition have been list in Table S1. In the sample of M4C1-G,
the contents of magnesium and calcium are less than those in M2C1-G, which are consistent with the results of XPS. Figure 1(c) and (d) show the TEM images of M2C1-G and M4C1-G, respectively.
The typical diameters of flakes have been marked as shown in the Fig. 1(c) and (d). The diameters of flakes in M2C1-G are in the range of 40–120 nm, while those in M4C1-G are in the range
of 20–60 nm, which reveals that the diameters for M2C1-G sheets are mostly larger than those for M4C1-G sheets. In addition, the number of the layers of these edges in Fig. 1(c)
approximately ranges 2–10, while that for M4C1-G ranges 2–4 which are obviously thinner as shown in the inset of Fig. 1(d). The adjacent layer spacing in the insets of Fig. 1(c) and (d)
thickness is about 0.34 nm which is the characteristic of few-layer graphene. The specific surface area (SSA) of the generated graphene was investigated by Brunauer–Emmmett–Teller (BET)
measurement. The SSA of M2C1-G is up to 358 m2 g−1 according to the BET method. Then we can evaluate the layer of M2C1-G is about 7 through the SSA of monolayer graphene is 2630 m2 g−1.
According to the above analysis and the Raman analyses in the following section, we conclude that the products synthesized by SHS method are few-layers graphene.
The morphologies of few-layer graphene: (a) and (b) SEM of M2C1-G and M4C1-G, (c) and (d) TEM of M2C1-G and M4C1-G.
The difference of the morphology between M2C1-G and M4C1-G can be understood by considering the mole ratios of reactants (Mg: CaCO3) for SHS reaction. The stoichiometric mole ratio of the
reaction between Mg and CaCO3 is 2:1, which is just the ratio for M2C1-G, while the ratio for M4C1-G is 4:1, much higher than the stoichiometric ratio. The deviation of the stoichiometric
ratio for M4C1 means that Mg is excessive for the reaction, and the excessive Mg may play multiple roles in the SHS reaction. Firstly, the excessive Mg may melt at 648 °C and volatilize at
1107 °C, which can absorb large amount of heat produced by the exothermic SHS reaction (ΔH = −632 kJ/mol) and decrease the maximum temperature of the reaction. Secondly, the gaseous Mg in
the enclosed space of reaction container may affect the growth process of graphene since they may decrease the collision probability of the reactive carbon atoms produced during the SHS
reaction process. As a result, we can deduce that the reaction temperature for M4C1-G is lower than that of M2C1-G which benefits the production of smaller and thinner sheets for M4C1-G as
shown in Fig. 1. Of course, this is only the basic discussion on the phenomenon, to further understand the roles of the excessive Mg, more work should be done to clarify the mechanism of the
SHS reaction.
Figure 2 shows the FTIR spectra of M2C1-G, −800 and M4C1-G, −800. The absorption peak around 1575 cm−1 is ascribed to the skeletal vibration of aromatic ring (C=C stretching vibration); the
peaks at 1141 cm−1, 1717 cm−1, 2850–2920 cm−1 and 3200–3600 cm−1 are attributed to the C-O-C, C=O, C-H and O-H vibration, respectively. On the one hand, from Fig. 2(a) it can be found that
the peaks corresponding to H2O (1624 cm−1) and O-H vibration (3200–3600 cm−1) with the increase of heat treatment temperature, suggesting the remove of hydroxyl and water on graphene; the
peaks corresponding to oxygen-containing groups are not clear for M2C1-G, suggesting that M2C1-G has good chemical stability. On the other hand, it is interesting to see that the FTIR
spectra of M4C1-G is quite different from that of M2C1-G. The peaks corresponding to epoxy, hydroxyl, carbonyl and carboxyl groups can be both found for M4C1-G and M4C1-800; however, the
relative intensities of peaks corresponding to epoxy, carbonyl and carboxyl groups for M4C1-800 increase obviously, while the peaks corresponding to O-H vibration almost disappear, compared
with those for M4C1-G. Consequently, it can be concluded that M2C1-G has less oxygen-containing groups and is more stable for the heat treatment than M4C1-G and that the oxidization of
graphene happens for M4C1-G heat-treated at high temperature.
FTIR spectra of M2C1 (a) and M4C1 (b) at the heat treated temperature of 300 K and 800 K.
To better study this behavior, we performed the Thermogravimetric Analysis (TGA) and the differential scanning calorimetry (DSC) of M2C1-G and M4C1-G in air environment at the heating rate
of 10 K·min−1 and the result has been added in Fig. S2 (Supporting Information). From the curves of DSC, two exothermic peaks can be seen, corresponding to the two weight loss stages from
the curves of TG. The first exothermic peak is located at 776 K for M2C1-G and 740 K for M4C1-G, while the second exothermic peak is at 906 K and 884 K for M2C1-G and M4C1-G, respectively.
The first exothermic peak is small compared with the second one for M2C1-G, while they are almost equal for M4C1-G. Accordingly, there are two weight loss steps for the SHS graphene. The
first step of weight loss occurs at the temperature range of 300–830 K for M2C1-G and 300–670 K for M4C1-G, corresponding to the removal of adsorbed water and the labile oxygen-containing
groups. The second mass loss range is from 830 K to 950 K for M2C1-G and 670 K to 950 K for M4C1-G, which is assigned to the combustion of the carbon skeleton of graphene, releasing CO and
CO2. From the results of DSC and TG analysis, we conclude that the SHS graphene had two types of structure. One is easily oxidized at low temperature, corresponding to the oxygen-containing
groups and carbon defects; the other is more thermally stable, oxidized at higher temperature, assigning to the defect-free parts in SHS graphene20. But the ratio of the two exothermic peaks
in the curves of DSC for the two samples is different. The relatively intensity of the first peak to the second peak in M4C1-G is much higher than that in M2C1-G, indicating that M4C1-G
contained more oxygen-containing groups and its thermal stability is lower than that of M2C1-G, which are consistent with the results from FTIR and XPS.
XPS characterizations are further performed to analyze the elemental composition and C/O configuration in the samples. The XPS survey spectra of the samples in Fig. 3(a) show the presence of
carbon, oxygen, magnesium and calcium elements, which is in agreement with the result of XRD. The high resolution C 1 s spectra of M2C1 and M4C1 heat-treated at different temperatures are
shown in Fig. S3 and S4, respectively. The spectra are analyzed by XPSpeak41 software and corrected for the background signals using the Shirley algorithm prior to curve resolution21.
Gaussian decomposition and Lorentz decomposition are employed in this fitting. The C1s component can be deconvolved into six components: sp2 C=C (284.4 ± 0.1 eV), sp3 C-C (285.4 ± 0.1 eV),
C-O (286.4 ± 0.1 eV), C=O (287.5 ± 0.2 eV), O=C-O (288.6 ± 0.2 eV) and π-π* satellite peak (290.5 ± 0.1 eV)22,23,24. In order to obtain more detailed information, the contents of components
in C 1 s of M2C1 and M4C1 treated at different temperatures are analyzed according to the fitting and the results are shown in the Fig. 3(b,c,d and e).
(a) XPS survey spectra of M2C1-G and M4C1-G; (b–e) The compositions of components from C 1 s in M2C1 ((b) and (d)) and M4C1 ((c) and (e)).
Figure 3(b) and (c) demonstrate the effect of heat treatment temperature on the XPS areas for C=C and C-C bonds. For M2C1 sample, the content of XPS area for C=C has a small fluctuation in
the treatment temperature range 300 to 650 K and then decreases for 800 K. Interestingly, it is clear to find that the content of XPS area for C-C has an opposite trend. Since C=C and C-C
bonds are related with sp2 and sp3 C in graphene, the well opposite trend suggests that the oxidized sp2 carbons are mostly changed to sp3 carbons and vice versa. Similar trend can also be
found in M4C1 sample.
XPS results in Fig. 3(d and e) give us information about the effect of heat treatment temperature on the contents of oxygen functional groups. Firstly, it can be found that the contents of
carboxyl group in both M2C1 and M4C1 have an increasing trend with the increase of the heat-treatment temperature. The content increase (2.4%) of carboxyl group from M4C1-G to M4C1-800 is
higher than that (1.45%) of M2C1 samples. Secondly, for the content of C-O group, it changes relatively small for M2C1 with the increase of heat treatment temperature but fluctuates largely
for M4C1 heat-treated at 500 K, suggesting that M4C1 is easier to be oxidized at 500 K to produce C-O group (hydroxyl or epoxy group) and then the group decomposed at higher temperature.
Thirdly, the contents of C=O and their fluctuation for M2C1 and M4C1 are relatively small. As a result, the content of groups in M2C1 is relative stable compared with those in M4C1, the
results also give us valuable information for the explanation of the ferromagnetic properties of SHS graphene.
Raman spectroscopy is considered to be an effective tool for characterization of mono-, few-, or multil-layer graphene25,26,27,28. The Raman spectra of the M2C1 and M4C1 samples treated at
different temperatures are shown in Fig. 4(a and b). The Raman spectra of M2C1 and M4C1 show three peaks. The G band at 1570 cm−1 represents the in-plane bond-stretching motion of the pairs
of sp2 hybridized C atoms (the E2g phonons); the D band at 1341 cm−1 corresponds to breathing mode of rings or K-point phonons of A1g symmetry; and the second-order D (2D) band at 2678 cm−1
originates from a two phonon double resonance process28, 29. The 2D peaks of the M2C1 and M4C1 samples around 2678 cm−1,which shift greatly to lower wavenumber compared with that of graphite
(2714 cm−1), can identify the samples as few-layer graphene30, 31.
As mentioned in the research of J. T. L. Thong37, the FWHM of the 2D band in graphene could be a quantitative guide to distinguish the layer number (single- to five-layers) of few- layer
graphene. However, it is based on graphene produced by mechanical exfoliation which has less defects, and the research about the relationship between defective graphene and FWHM of 2D peak
has not yet been reported. In addition, the size of laser light spot for Raman spectra we used is about 100 μm and laser light may penetrate many graphene sheets in its light path, so the 2D
peak we got reflects the information of many graphene sheets, which is composed of many overlaid 2D peaks. So the FWHM of 2D peak may not provide us with exact information about the number
of SHS graphene layer.
Powder X-ray diffraction is used to analyze the phases in M2C1 and M4C1 samples as shown in Fig. 4(d). It can be found that the most intense peaks in the two XRD spectra are the peaks near
26.0° corresponding to the (002) plane of graphite. The XRD spectra are similar with the FLG in refs 30, 36. The peaks belonging to CaO (JCPDS No. 48–1467) and MgO (JCPDS No. 45–0946) can
also be found for M2C1, which are the by-products of SHS reaction.
It is well known that Raman measurement is sensitive to symmetric structures while FTIR spectra is sensitive to asymmetric structures. We divide the defects of the SHS graphene into
Raman-sensitive and FTIR-sensitive defects. Edges (zigzag and armchair), vacancies (including single vacancy, hydrogen partially saturated vacancy and vacancy cluster) and disordering are
the defects originating from the broken of the C-C bonds which make graphene sheets distorted. These defects can be measured by Raman spectrum and mentioned as Raman-sensitive. The defects
corresponding to the oxygen-containing groups include carboxyl group, carbonyl group and hydroxyl group, etc., which are connected to the graphene layers by covalent bonds and also introduce
various edges and defect sites. They are FTIR sensitive and mentioned as FTIR-sensitive.
The authors gratefully acknowledge the support from the Program of Qinghai Science and Technology Department (No. 2016-ZJ-701).
Qinghua Miao, Lidong Wang and Zhaoyuan Liu contributed equally to this work.
School of Materials Science and Engineering, Harbin Institute of Technology, Harbin, 150001, China
Qinghua Miao, Lidong Wang, Zhaoyuan Liu, Bing Wei & Weidong Fei
School of Mechanical Engineering, Qinghai University, Xining, 810016, China
Department of Materials Science and Engineering, Shenzhen Graduated School, Harbin Institute of Technology, Shenzhen, 518055, P.R. China
Qinghua Miao, Zhaoyuan Liu and Bing Wei produced the samples by SHS method; Qinghua Miao, Lidong Wang, Xiangli Liu and Weidong Fei analyzed the results and wrote the main manuscript text;
Jinhui Wang and Zhaoyuan Liu prepared the figures. All authors reviewed the manuscript.
Anyone you share the following link with will be able to read this content: