Play all audios:
ABSTRACT A low cost, non-explosive process for the synthesis of graphene oxide (GO) is demonstrated. Using suitable choice of reaction parameters including temperature and time, this recipe
does not require expensive membranes for filtration of carbonaceous and metallic residues. A pre-cooling protocol is introduced to control the explosive nature of the highly exothermic
reactions during the oxidation process. This alleviates the requirement for expensive membranes and completely eliminates the explosive nature of intermediate reaction steps when compared to
existing methods. High quality of the synthesized GO is corroborated using a host of characterization techniques including X-ray diffraction, optical spectroscopy, X-ray photoemission
spectroscopy and current-voltage characteristics. Simple reduction protocol using ultra-violet light is demonstrated for potential application in the area of photovoltaics. Using different
reduction protocols together with the proposed inexpensive method, reduced GO samples with tunable conductance over a wide range of values is demonstrated. Density functional theory is
employed to understand the structure of GO. We anticipate that this scalable approach will catalyze large scale applications of GO. SIMILAR CONTENT BEING VIEWED BY OTHERS STEPWISE REDUCTION
OF GRAPHENE OXIDE AND STUDIES ON DEFECT-CONTROLLED PHYSICAL PROPERTIES Article Open access 02 January 2024 N-DOPED GRAPHENE FOAM OBTAINED BY MICROWAVE-ASSISTED EXFOLIATION OF GRAPHITE
Article Open access 21 January 2021 DEVELOPMENT OF A ONE-POT SYNTHESIS OF RGO IN WATER BY OPTIMIZING TOUR’S METHOD PARAMETERS Article Open access 27 September 2024 INTRODUCTION Graphene
oxide (GO), a monolayer sheet of graphite oxide, is by no means a less wonderful material than
graphene1,2,3,4,5,6,7,8,9,10,11,12,13,14,15,16,17,18,19,20,21,22,23,24,25,26,27,28,29,30,31,32,33. It not only serves as a precursor for making reduced graphene oxide (rGO) but also itself
has remarkable physical and chemical properties which makes it a sought after material for applications in areas which include electronics, biomedicine, energy and
environment1,2,3,4,5,6,7,8,9,10,11,12,13,14,15,16,17,18,19,20,21,22,23,24,25. GO has promising biological applications demonstrated at laboratory scale which include, drug delivery1,2,
antibacterial coatings3,4,5, photo-thermal cancer therapy6,7 and selective differentiation of mesenchymal8 and neural9,10 stem cells. Key environmental applications of GO include contaminant
adsorption11,12, water decontamination13,14,15, solar desalination16 and environmental sensing17,18. GO also finds niche applications in areas including tribology19,20 and energy
storage21,22,28. GO has been shown to be a highly flexible nanomaterial with a high stiffness23. Furthermore, the recent demonstration of high quality graphene prepared using microwave
reduction of GO24 has the potential to open the flood-gates for real world electronic applications of GO. However, realizing all this in practice hinges on developing a safe, economic and
scalable method for making GO. Chemical routes based on oxidative-exfoliation methods have been developed over the years for the synthesis of
GO34,35,36,37,38,39,40,41,42,43,44,45,46,47,48,49,50,51,52,53,54,55,56. Table S1 provides a summary of these synthesis protocols along with their environmental impact and cost. Historically,
the first report on GO is credited to Brodie who in 1859 treated graphite with a strong oxidizing mixture of potassium chlorate (KClO3) and fuming nitric acid (HNO3) to obtain a derivative
which he named ‘oxide de graphite’34. In a series of efforts that followed, Gottschalk35 confirmed Brodie’s findings and Staundenmaier worked on improving the yield and safety of the
reactions involved36 with limited success. Staundenmaier primarily attempted replacing fuming HNO3 by a mixture of sulphuric acid (H2SO4) and fuming HNO336. Other significant early reports
include those by Berthelot37, Luzi38, Charpy39, Hamdy40, Weinschenk41 and by Kohlschütter and Haenni42, however, with little success in controlling the explosive nature of the reactions
involved. A new era in GO research was unleashed with the usage of powder X-ray diffraction for a better understanding of the structure43,44,45,46,48 and magic angle spinning nuclear
magnetic resonance (MAS-NMR) for investigating the nature of functional groups49. Hummers and Offeman50 got rid of the requirement for KClO3 and HNO3 using a reaction which involved gradual
addition of potassium permanganate (KMnO4) to a suspension of powdered graphite and sodium nitrate (NaNO3) in H2SO4 (Hummers’ method). This considerably reduces the explosive nature of the
reaction but a major issue remains due to the emission of toxic gases including NO2 and N2O4. Furthermore, contamination due to Mn residues has also been a major hurdle in getting high
quality GO. Several groups used various modifications to the Hummers’ approach however, the issues related to contamination by Mn residues, toxic gas emission and the explosive nature of the
reactions were not completely eliminated51,52. A further modification to Hummers’ method was suggested by Marcano _et al_.53 where they claimed absence of any Mn residues and in addition
there were no toxic gas emissions. Although their synthesis starts with the use of inexpensive graphite powder, Marcano _et al_.53 recommended extensive and cumbersome washing, filtration,
centrifugation and dialysis steps. These involved the use of expensive membranes. Using simple but key modifications to synthesis parameters, we propose a method for Mn residue free GO
synthesis which does not involve the use of expensive membranes without compromising on the quality of the yield. Furthermore our synthesis technique completely eliminates the explosive
nature of reaction by following a set of fixed protocols unlike methods reported earlier in the literature50,52,53,54. To corroborate the high quality of the yield, we characterized the as
synthesized GO using a host of techniques including X-ray diffraction, Raman spectroscopy, UV-Visible spectroscopy, Fourier transform infra-red spectroscopy, electron microscopy and X-ray
photoemission spectroscopy. We show typical applications which include: (a) diodic response across the aluminum zinc oxide (AZO)-GO multi-layer, and (b) response to 1.5 AM Global sunlight of
a GO-rGO multi-layer demonstrating the the photovoltaic phenomena. The rGO film for (b) above was prepared by a simple UV-light reduction57,58 of GO film made using doctor-blade
technique59. In addition, we also utilize a host of reduction techniques24,57,58,60,61 to demonstrate the preparation of rGO using GO synthesized using our approach with tunable conductance
over a wide range of values. Furthermore, GO foam (which has a host of possible applications)1,2,3,4,6,7,8,10 can be easily prepared following our approach. We anticipate that our
inexpensive scalable synthesis approach will catalyze large scale applications of GO. RESULTS AND DISCUSSIONS It is evident from literature34,36,50,52,53,54 that the major impediments during
synthesis of GO include: (a) explosive nature of the underlying reactions, and (b) existence of graphitic and Mn-based residues in the final product. In order to tackle these problems, it
is necessary to understand the reaction intermediaries at each stage of the reaction process which comprises of steps corresponding to intercalation, exfoliation and termination of
reaction34,36,50,52,53,54. Such information bear tremendous potential for addressing the reason for presence of graphitic and Mn-based residues in GO. At the outset, we implemented a
pre-cooling protocol (PCP) to control the highly exothermic nature of the involved reactions which to us appeared as the primary reason for its explosive nature. The PCP comprises of
individually pre-cooling the initial reaction mixtures of: (a) C:KMnO4, and (b) H2SO4:H3PO4 to an initial temperature of 5 °C. This simple protocol ensures that the temperatures do not rise
beyond room temperatures irrespective of the method54 by which the acid mixture is added to C:KMnO4 mixture. Thus, PCP completely eliminates any possibility of explosions during the
reaction. For a better understanding of the reaction progress, we have truncated the reaction at each stage and looked at the washed product. In particular, we have looked at the reaction
products after: (a) mixing graphite (C) and KMnO4 (designated as step-1), (b)adding H2SO4:H3PO4 solution to the C:KMnO4 mixture (designated as step-2), and (c) addition of H2O2 post step-2
(designated as step-3). This was done without any further heating and soaking time after step-2 as well as with various soaking times (in the range of 0–24 h) at several temperatures (in the
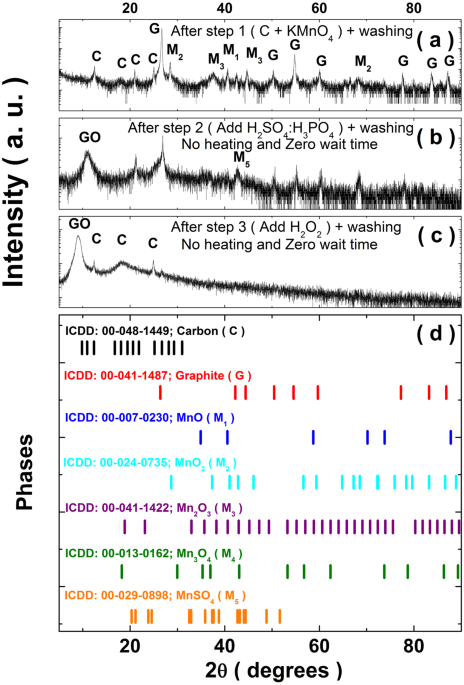
range of 20–65 °C) after step-2. XRD data was obtained for the resulting samples at the end of step-1, step-2 and step-3, respectively and the results for zero soaking time are summarized
in Fig. 1(a–c). For a comparison, the stick diagrams corresponding to the diffraction patterns for graphite, rhombohedral carbon, various oxides of Mn (MnO, MnO2, Mn2O3 and Mn3O4) and MnSO4
are provided in Fig. 1(d). After step-1, we observe the presence of XRD peaks corresponding to various oxides of Mn in addition to those for graphite and rhombohedral carbon. After step-2,
the hints for the initiation of the formation of GO is evident in the form of a broad peak centered at 11 °C. However, despite the washing step, the peaks corresponding to various Mn oxides
and MnSO4 phase are still present after step-2. There are distinct color changes at the end of each step. After step-1, the color is black and it changes to greenish black after step-2. As
mentioned earlier, the temperature of the reacting mixture does not rise beyond room temperature during steps 1 to 3. However, after step-2, there is a distinct change in color from greenish
black to dark brown if the reaction mixture is heated above room temperature. Upon addition of H2O2 in step-3 we observe a sudden change in color from dark brown to golden yellow which is a
visual marker for the formation of GO33. We observed that unlike Marcano _et al_.53, the required amount of H2O2 was considerably higher in our method (almost twice the concentration of
H2O2 in H2O:H2O2 solution). The XRD of the washed sample obtained after step-3 shows a prominent diffraction peak corresponding to GO. Here, we don’t observe any prominent peak corresponding
to Mn oxides, however, the peaks corresponding to rhombohedral carbon are still present. Next, we look at the XRD patterns for the samples prepared with different soaking times and
temperatures, as shown in Fig. S2 (see SI). From this exercise, we conclude that good quality GO samples can be synthesized following steps 1 to 3 with a soaking time of 24 hours at 65 °C.
The GO samples so prepared donot have any Mn residues and spurious carbonaceous residues without the need for any sophisticated filtration protocol. Figure 2(a) shows the Raman spectra of
the GO film obtained at room temperature in the wavenumber range 1200–2900 cm−1. The D-band corresponding to 1350 cm−1 and the G-band corresponding to 1580 cm−1 are marked. In addition, a
wide hump at the high wavenumber end corresponding to the 2D band is also observed. The G-band originates due to: (i) the bond stretching of _sp_2 hybridised _C_=_C_ in both rings and
chains, and (ii) first order scattering from the doubly generated E2_g_ phonon modes in the Brillouin zone centre. The G-band therefore contains information on the _sp_2 hybridised carbon
network. On the other hand, the D-band is associated with the breathing mode of the aromatic rings which is caused by the structural imperfections due to the attachment of oxygen based
functional groups in the carbon basal plane. Therefore, D-band is a measure of the degree of defects. The _I__D_/_I__G_ ratio of 1.1 indicates the presence of structural defects within the
as synthesized sample33,62. The presence of 2D band centered around 2680 cm−1 can be attributed to the double resonance transitions and is also an overtone of the D band. The inset in panel
(a) of Fig. 2 shows the Intensity (I) versus 2 _θ_ plot obtained from the X-ray diffraction (XRD) of the as synthesized GO sample. For a comparison, the stick diagrams for the XRD
corresponding to graphite and GO from the International crystallography diffraction database (ICDD) are shown. The interlayer spacing of GO provides crucial information on the degree of
intercalation of various oxide functional groups during oxidation. We observe a diffraction peak at 2 _θ_ = 9.11°corresponding to an interlayer spacing of 9.74 Å which indicates a very high
degree of intercalation53,56. Table S1 (see SI) compares the interlayer spacing along with details of the synthesis procedures reported by various groups. The absence of the prominent
graphitic peak at 26.5° (corresponding to the interlayer spacing of 3.35 Å) and the appearance of the graphene peak at 9.11° is a fingerprint for the formation of GO63,64. Sub inset in panel
(a) shows the optical image of the bottle marked P which contains dispersed GO sample whereas the bottle marked Q contains optical image of the reaction mixture just prior to adding H2O2.
The inset in panel (b) of Fig. 2 shows the UV-Vis spectrum of GO dispersed in water. It consists of a peak at 233 nm and a broad shoulder between 285–305 nm. The 233 nm peak corresponds to
the _π_-_π_* transition of _C_=_C_ bonds while the broad shoulder can be attributed to the _n_-_π_* transition of the _C_=_O_ bonds33,53,56,65,66. The combined information from the
methodology used in preparing the samples and the corresponding XRD data, UV-Vis spectra and the Raman shift data is hallmark for the high degree of intercalation of oxide functional groups.
The Fourier transform infra-red (FTIR) spectroscopy is capable of elucidating the nature of various functional groups in the GO sample. Figure 2(b) shows the FTIR transmittance spectra of
the as synthesized GO sample. The broad peak observed in the wavenumber range of 2900–3500 cm−1 can be attributed to the stretching mode of the _O_-_H_ groups. The _O_-_H_ groups in GO are
bonded to the parent carbon network at various locations (ranging from the center of the sheet to its borders). The corresponding shifts in the frequency of vibration of the _O_-_H_ bonds
lead to a resultant broadening of the band. Presence of residual water molecules intercalated between the GO sheets also contributes to the broadening of the _O_-_H_ band. The strong band
centered at 1725 cm−1 can be attributed to the stretching vibration of _C_=_O_ bonds in carboxyl/carbonyl groups. The band at 1616 cm−1 can be attributed to the vibration of _O_-_H_ groups
in water molecules adsorbed on GO sheets. Similarly, the bands at 1224 cm−1 and 1055 cm−1 can be attributed to the stretching vibrations of the _C_–_OH_ group and the _C_–_O_ (epoxy) group
respectively67,68,69. There is no significant band at ≈1570 cm−1 (corresponding to the stretching vibrations within graphitic domains) pointing to a high quality of the as synthesized GO
sample. The surface morphology of the synthesized GO sheets is studied using a scanning electron microscope (SEM). The SEM image of a portion of the GO sheet is shown in Fig. 3(a). We
observe uniform sheets of GO over micron scales. Certain wrinkles and folds are also observed70. Transmission electron microscopy (TEM) has the potential to elucidate the details related to
crystallinity in addition to morphology of nanomaterials and has been extensively used to study GO sheets53,56,71,72,73. We perform TEM characterization of the as synthesized GO sheets.
Panels (b) and (c) of Fig. 3 show the TEM images at different magnifications. Regions F and C are marked in Fig. 3(b) where a fold is present and absent, respectively. In particular, Fig.
3(c) shows a TEM image across a fold in the GO sheet. Absence of any visible substructure across the fold suggests the high quality GO nanosheets. Panels (d) and (e) of Fig. 3 shows the
selective area diffraction (SAED) patterns obtained in regions F and C, respectively. The six-fold spots observed in the SAED patterns obtained from both of the regions F and C points to the
underlying honeycomb graphene like skeleton. A comparison of the two SAED patterns suggests the existence of a diffuse ring like structure along with less sharp six-fold spots in the region
F. This indicates the far greater disorder in the carbon skeleton underneath the folds. In its pristine form, GO comprises a single atomic layer thick graphene-like carbon sheet (GLCS) with
oxygen containing functional groups (OCFGs) extending out of the plane at several locations on both faces. The OCFGs are covalently bonded to the carbon atoms transforming them to the sp3
hybridized state from their sp2 hybridized state in the GLCS. This leads to the existence of oxidized domains in the midst of GLCS domains. The number density of OCFGs increases with the
degree of oxidation. A pristine GO flake truly exists only in the solution phase (in water or in low molecular weight alcohols) where it is completely exfoliated into single-layer sheets.
When deposited on a substrate (say glass), a GO flake is in contact with the substrate on one side and with air on the on the other side with a significant likelihood of physisorbed water
molecules on both sides. The vacuum dried drop-casted film of GO (dispersed in water) on a glass substrate is rough on an atomic scale with thicknesses varying from single layer to several
tens of layers. Atomic force microscopy (AFM) is unable to individually resolve the GLCS domains and the OCFG containing domains and provides only an average thickness for the GO flakes. We
observe a single layer flake thickness of about 1.1 nm with a lateral extent of about 1–1.2 _μ_m (see scan 1 in Fig. 4(a,c)). Similarly, layered flake thickness ranging from 2–8 nm with
lateral dimensions of 0.6–1.2 _μ_m are shown in Fig. 4(b,d). This agrees well with the reports in literature52,53,56. On the other hand, a thick GO sheet with a spatial extent of about 10
_μ_m is also seen Fig. 4(e) and corroborates well with the SEM image of the drop-casted film of GO. Prominent wrinkles are also observed across the drop-casted sample as shown in Fig. 4(e).
It should be noted that the bulk form of GO (which can be a GO gel with enhanced water content, or, a GO foam with low water content) results from a restacking of the exfoliated
single-layered (and multi-layered) GO sheets. This is very different from the cases when GO is dispersed in a solvent. GO films were deposited on a glass substrate using spin coating. We
employed a reduction protocol where a 4 Watt, 365 nm UV lamp was used for exposure of the as synthesized GO films for different periods of time. The current-voltage (I-V) characteristics for
the GO films were measured as a function of UV exposure time. For this, we used a four-probe configuration and looked at current across the two inner terminals as a function of the source
voltage applied across the two outer terminals. The evolution of the I-V characteristics with the UV exposure time (up to 2 hours) is shown in Fig. 5(a). For a comparison, the I-V
characteristic of CVD graphene is shown in the inset of Fig. 5(a). In Fig. 5(b), we plot the increase in current as a function of UV exposure time at typical source voltages of 1 and 2
Volts. A significant increase in current is seen for exposure times beyond 90 minutes (5400 s). To corroborate the reduction of GO to rGO we obtained the Raman and X-ray photoemission (XPS)
spectra both prior to UV exposure as well as post 2 hours exposure for samples belonging to the same batch of synthesis. Figure 5(c) shows a comparison of the C1s XPS spectra of the as grown
sample, the post 2 hours UV exposed sample and the CVD grown graphene. A significant suppression of the peak(s) corresponding to the oxygen functional groups32 is observed in the 2 hour UV
exposed sample. It was found that the full width half maxima of rGO sample was 4.73 eV while that for CVD grown graphene was 3.9 eV. The difference in FWHM of the rGO and pristine graphene
suggests the presence of residual functional groups in rGO sample that require further reduction to achieve electronic properties similar to that of pristine graphene. In Fig. 5(d), we show
a comparison of the Raman spectra of the as grown sample and a corresponding sample after 2 hours exposure to UV light. The characteristic D, G and 2D peaks are labeled. There is a
significant increase in the 2D peak with the UV exposure demonstrating the enhancement in the sp2 bonded carbons akin to rGO. One can also see a slight increase in the D peak which hints
that the reduced sample has a correspondingly higher degree of disorder compared to the parent sample. This together with the used synthesis protocol for GO, demonstrates the feasibility of
an inexpensive technique for the preparation of good quality rGO thin films. Moreover, for a comparison of reduced GO Raman spectra with pristine graphene (CVD grown), graphene single layer
(I2_D_/I_G_ = 2.7), bilayer (I2_D_/I _G_ = 1.4) and multilayer Raman spectra is shown in Fig. 5(d). Based on statistical Raman mapping, Eigler _et al_.74 provided a recipe for estimating
extent of disorder in rGO. A conservative estimate of the extent of disorder based on the observed _I__D_/_I__G_ ratio of the 2 hour reduced GO sample can be made and it is estimated to be
less that 0.06%74. In order to further ascertain the quality of rGO samples made by us, we performed a careful analysis of the XPS data. Figure 6(a) shows the intensity (I) versus binding
energy (B. E.) in the full scan range for the XPS of the rGO film obtained post 2 hour exposure to a 4 Watt, 365 nm UV lamp. One can clearly observe the absence of Mn 2p peak (see inset
panel in Fig. 6(b) for further details). It should be noted that there is wide a degree of variability in the detection limits for individual elements using XPS depending on the exact
details of the host matrix75. For the detection of the presence of Mn residues in GO matrix, it would be safe to assume that the minimum detection limit is about 0.03 at.%75. The absence of
any observable Mn 2p peak corroborates the absence of Mn residues in the GO samples made using our synthesis process up to these detection limits. A multiple peak fit analysis of the C 1 s
of GO and rGO data are shown in Fig. 6(b,c), respectively. Peaks corresponding to –C–C–, –C=C–, –C–O, –C=O, –O–C–O– and –OH are marked appropriately. On comparison of the C1s XPS spectrum of
GO and rGO, a sharp decrease in hump at 286.6 eV is observed, which signify reduction (corresponding to the removal of functional groups attached to carbon skeleton). Moreover, the peak at
285.8 eV (-OH group) is not present in rGO C1s spectra and the area under the peaks corresponding to the oxygen functional groups such as –C–O– and –O–C–O– (at 286.3 eV and 288.3 eV,
respectively) decreases. Simultaneously, the area under the peak at 284.1 eV and 284.9 eV (–C=C– and –C–C–) increases in comparison to C1s spectra of GO (for details about fractional areas
under the peaks, see Table S2 in SI) after exposure of UV light (2 h). Finally larger intensity corresponding to the –C=C– peak compared to that for –C–C– peak confirms the significant sp2
character of the rGO sample. Effects of longer exposures to UV lights (with different wavelengths and intensity/power) deserves further explorations. A comparison of our method for GO
synthesis with the popular KMnO4 based methods existing in literature is summarized in Fig. S3 (see SI). Table S3 (see SI) summarizes the yields. We can observe that the yield in our method
is better than the other popular methods reported in literature. Using suitable tuning of reaction parameters including the PCP protocol, elevated reaction temperature, increased reaction
time and a reduced H2O:H2O2 ratio during reaction termination, we are able to remove the requirement for expensive filtration membranes without compromising on the quality and yield of GO.
We have also completely eliminated the explosive nature of the synthesis process, a major obstacle in scalable applications of GO (see supplementary videos)31. We made use of the dried GO
foam for film fabrications, reduction and a number of additional measurements in order to elucidate the utility of GO synthesized using our approach for certain applications. Figure 7(a)
summarizes in brief the applications of GO demonstrated in this paper which include, diode behavior of AZO-GO multi-layer and the photovoltaic response of GO-rGO multi-layer. Conventional
doctor’s blade technique59 was used to make the films of GO on ordinary glass and AZO coated glass substrates. Partial reduction of the film coated on glass was performed by following the
identical reduction protocol as used for Fig. 5(a). Here, a UV exposure time of 2 hour was used to obtain the rGO in making the GO-rGO multi-layer on glass. Current-Voltage (I-V)
characteristics across the GO-AZO and GO-rGO structures are shown in Fig. 7(b,c), respectively. A diode like I-V characteristics is observed in both the cases. As AZO is a n-type material,
the above observation suggests the p-type nature of GO. Upon illumination with a 1.5 AM Global sunlight, a photovoltaic response is observed in the GO-rGO multi-layer with an open circuit
voltage (V_OC_) of 0.6 V and a short-circuit current (I_SC_) of 3.6 _μ_A. A review of the existing literature on GO clearly demonstrates its importance as an anode buffer layer76,77 and hole
transport material78 in organic solar cell since it allows holes to effectively travel towards the electrode and also hinders the electron transport. This leads to a reduction in the
recombination of electron and hole pairs which results in improved device performance. Similarly rGO has been used as electron extraction material in perovskite solar cells79 but the
demonstration of solar cells made up of all graphene layers by making a multi-layer structure of GO and rGO films has not been reported so far. We report for the first time a solar cell made
up of all graphene based layers. More so, the solar cell demonstrated is fabricated through a cost effective technique comprising doctor blade technique for film deposition and inexpensive
UV reduction for making rGO. This paves way for further work in this area for realizing practical efficiencies in near future. We employ a host of reduction protocols to obtain rGO samples
with different degrees of reduction24,60,61. Specifically, thermal reduction was carried out at 300 °C for 10 minutes and the microwave reduction was carried out using a conventional
microwave oven operated at 800 W for 2 s. The chemical reduction protocol employed the green reduction of GO using L-ascorbic acid as proposed by Abdolhosseinzadeh _et al_.60. In Fig. 7(d),
we show the I-V characteristics of drop-casted films for these rGO samples. For a comparison, the I-V characteristics of a drop-casted film (using identical dilution and drop volume) of
commercially available graphene nanoplatelets (CAS 7782–42–5 from TCI) is shown in Fig. 7(d). The comparative Raman spectra for these different rGO samples is summarized in Fig. 7(e) along
with the Raman spectra of graphene nanoplatelets. One can clearly observe that rGO samples with tunable conductance can be very conveniently made using high quality GO samples made using our
method opening up possibility for a host of end applications. It is worth mentioning here that Abdolhosseinzadeh _et al_.60 did not perform the electrical characterization of reduced films
and the starting GO used by them was made using an extensively time consuming process to avoid any explosions. Furthermore, the GO samples reported by Abdolhosseinzadeh _et al_.60 contained
prominent amounts of Mn-based impurities. As can be observed from the inset in Fig. 6(a), we did not observe any signatures corresponding to Mn 2p1/2 and 2p3/2 peaks in the window 635–660 eV
in the XPS measurements. For a comparison, one can look at the existence of distinct Mn 2p1/2 and 2p3/2 peaks in the range 635–660 eV of binding energies in Mn-containing samples (see Fig.
2(b) of Zhang _et al_.80). An optical image of a piece of dried GO foam obtained after vacuum desiccation of the as grown GO sample can be seen as part of the schematic (see Fig. 7(a)). Such
GO foam has tremendous potential for bio-medical1,2,3,4,6,7,8,10 and energy storage applications21,22,28. Akin to the feasibility of scalability, the GO made using our method also has
tremendous potential for environmental remediation applications13,14,15. Using high-resolution solid-state 13C-NMR, Cai _et al_.81 confirmed the existence of C–O–C, sp2 C and C–OH in GO. We
also found evidence for these in our samples based on FTIR and XPS measurements. A one to one connection between removal of C–OH groups and an enhancement in conductivity is also
corroborated from our data. To gain additional understanding about the synthesized GO samples, we performed certain density functional theory (DFT) calculations. DFT techniques have been
extensively used in past to understand various aspects of GO physics82,83,84,85,86,87. For our purpose, we constructed a structural model for GO comprising of a carbon backbone in the form
of a single graphene sheet to which various functional groups were attached. A 7 × 7 chain of carbon honeycomb structure was used and we incorporated four ketonic group at the surface, seven
carboxylic group at edges, four aldehyde group at the edges and twelve hydrogen atoms at edges for creating a realistic model of GO (labeled GO-A). We considered another 7 × 7 chain of
carbon honeycomb structure with a larger number of epoxides and hydroxyl functional groups attached primarily in the basal plane and the edge was passivated using H (GO-B). For comparison,
we also constructed 7 × 7 structural models for graphene (labeled G) and rGO. In case of rGO, we removed a fraction of functional groups from the structural model of GO-A above. Mono-vacancy
defect site88 has also been introduced in the structural model of rGO (labeled rGO-A). Structural optimization using DFT was done utilizing Gaussian-16. The calculations were performed with
M062X using 6–31 G* basis set on supermicro SYS-6028R-TR server with two octa-core Intel(R) Xenon(R) CPU E5-2620 v3-2.40 GHz processors89,90. It took about 60 h for the structure
optimization of 7 × 7 GO using all the 16 CPUs of the server. On the other hand, the structure optimization for the 7 × 7 rGO and graphene took 38 h and 3 h, respectively. The stabilized
structures for graphene, GO and rGO for our starting structural configurations are shown in Fig. 8. DFT is also capable of providing useful spectroscopic information91. Here, we attempt to
reconstruct the Raman spectrum of GO for the structural model proposed above employing the technique of time-dependent density functional theory (TD-DFT) using Guassian 16. For this, we used
MO6-2X functional and 631-G* as basis set. The results indicate the presence of bands at 1385 cm−1, 1615 cm−1 and 2852 cm−1 (see SI, in particular Fig. S4 for further details), which
corresponds to D, G and 2D bands of GO, respectively (see Fig. S4 and main panel of Fig. 2(a) for comparison). Further work is desirable to establish the atomic configurations and related
electronic properties in GO92. CONCLUSIONS To conclude, we present an inexpensive route for synthesizing GO via modifications to Hummers’ approach50,51,52,53. The key modifications involve
the PCP protocol in addition to crucial changes in reaction time and temperature and the concentration of reaction terminating agent (H2O2 in this case). The proposed synthesis approach
completely eliminates the explosive nature of the underlying reactions. Using this approach we are able to obtain high yields of very good quality GO as exemplified by XRD, electron
microscopy, FTIR, Raman spectroscopy and XPS results presented in this work. Using DFT and TD-TDFT, we have looked at a simple structural model for monolayer GO and rGO and a striking
reconstruction of observed Raman data is seen. It should be noted here that our approach does not require the use of expensive filtration membranes53. A simple reduction protocol based on UV
exposure is also demonstrated to make rGO from GO. Observation of diodic behavior in an AZO-GO multi-layer attests to the p-type character of GO. The possibility of using a GO-rGO
multi-layer for energy harvesting based on photovoltaic response has not gone unnoticed. Due to inexpensive and scalable synthesis method, applications requiring GO dispersion, e.g., dye
adsorption for environmental remediation is also feasible for large scale end applications11,12,13,14,15,16. GO foam obtained using our method can be used for bio-medical1,2,3,4,6,7,8,10 and
energy storage applications21,22,28. The absence of toxic gas emission coupled with the inexpensive nature of the synthesis technique has the potential to open the flood-gates for large
scale applications of GO in domains including electronics, bio-medicine, energy and environment. METHODS All chemicals used in synthesis process were purchased from commercial source (Sigma
Aldrich and CDH) and used without further purification. In our strategy we used graphite flakes (C), sulphuric acid (H2SO4), phosphoric acid (H3PO4), hydrochloric acid (HCl), hydrogen
peroxide (HCl), deionized (DI) water and potassium permanganate (KMnO4). Our method is adapted from Marcano’s method53 with certain crucial modifications. Initially graphite flakes and
potassium permanganate (in the ratio 1:6) were mixed in a mortar and pestle for 5 minutes and kept for pre-cooling to 5 °C (the pre-cooling protocol, PCP). A separate solution of sulphuric
acid and phosphoric acid (in the ratio 9:1) was prepared and also pre-cooled to 5 °C. The acid solution was then added to the mixture of graphite flakes and potassium permanganate with
continuous stirring (using a magnetic stirrer) which makes the color of the solution as greenish black (see Fig. S1(a)). The temperature does not exceed room temperatures at this step
despite the exothermic nature of the reaction. The solution so obtained was heated at 65 °C and was left for 24 h with continuous stirring. After 24 h the solution becomes brownish in color
(see Fig. S1(b)) and was allowed to cool till room temperature is achieved. This is then added to a beaker containing 400 ml deionized water ice (see Fig. S1(c)). After this 7 ml of H2O2 was
added to it while stirring with a glass rod. The solution color changes to golden yellow (see Fig. S1(d)), marking the formation of GO. Distilled water was added to the solution after 5
minutes and then the precipitate was allowed to settle down for an hour. This is followed by successive washing with DI water (3 times), HCl (2 times), ethanol (3 times) and DI water (3
times) with intermediate centrifugation (at 10,000 rpm for 5 minutes) and decantation. The gel thus obtained was degassed for 24 hours in a desiccator leading to the formation of GO foam. GO
dispersion in a solvent (say water) can be prepared by dispersing either the as synthesized gel or the GO foam in the solvent followed by ultrasonication. Films of GO can be made from GO
dispersion using any of the conventional techniques including spin-coating, drop-casting, dip-coating, spray-painting and doctors blade technique59. For the characterization of our samples,
following equipment were utilized: (a) Rigaku TTRX-III diffractometer with 1.54 Å Cu-K_α_ X-ray source for X-ray diffraction, (b) confocal micro-Raman spectrometer from Seki Technotron
corporation, Japan with 514.5 nm Argon ion laser for Raman studies, (c) Shimadzu IrAffinity-1 for FTIR spectroscopy, (d) Perkin Elmer Lambda-35 UV-Vis spectrophotometer for UV-Vis
spectroscopy, (e) LEO 435 VP SEM for SEM imaging, (f) Jeol, JEM 2100 for obtaining TEM images and SAED patterns, (g) ESCA + Omicron Nano Technology GmbH for XPS studies, (h) Photo Emission
Tech solar simulator model SS50AAA-EM with illumination area of 50 mm × 50 mm and Air Mass Filter of AM1.5 Global, and (i) Keithley source-meter 2420 for electrical characterization. CHANGE
HISTORY * _ 26 SEPTEMBER 2018 A correction to this article has been published and is linked from the HTML and PDF versions of this paper. The error has not been fixed in the paper. _
REFERENCES * Liu, Z., Robinson, J. T., Sun, X. & Dai, H. PEGylated nanographene oxide for delivery of water-insoluble cancer drugs. _J. Am. Chem. Soc_ 130, 10876–10877 (2008). Article
CAS PubMed PubMed Central Google Scholar * Zhang, L., Xia, J., Zhao, Q., Liu, L. & Zhang, Z. Functional graphene oxide as a nanocarrier for controlled loading and targeted delivery
of mixed anticancer drugs. _Small_ 6, 537–544 (2010). Article CAS PubMed Google Scholar * Akhavan, O. & Ghaderi, E. Toxicity of graphene and graphene oxide nanowalls against
bacteria. _ACS Nano_ 4, 5731–5736 (2010). Article CAS PubMed Google Scholar * Hu, W. _et al_. Graphene-based antibacterial paper. _ACS Nano_ 4, 4317–4323 (2010). Article CAS PubMed
Google Scholar * Akhavan, O. & Ghaderi, E. Escherichia coli bacteria reduce graphene oxide to bactericidal graphene in a self-limiting manner. _Carbon_ 50, 1853–1860 (2012). Article
CAS Google Scholar * Yang, K. _et al_. The influence of surface chemistry and size of nanoscale graphene oxide on photothermal therapy of cancer using ultra-low laser power. _Biomaterials_
33, 2206–2214 (2011). Article CAS PubMed Google Scholar * Akhavan, O., Ghaderi, E., Aghayee, S., Fereydooni, Y. & Talebi, A. The use of a glucose-reduced graphene oxide suspension
for photothermal cancer therapy. _J. Mater. Chem_ 22, 13773–13781 (2012). Article CAS Google Scholar * Lee, W. C. _et al_. Origin of enhanced stem cell growth and differentiation on
graphene and graphene oxide. _ACS Nano_ 5, 7334–7341 (2011). Article CAS PubMed Google Scholar * Akhavan, O., Ghaderi, E., Abouei, E., Hatamie, S. & Ghasemi, E. Accelerated
differentiation of neural stem cells into neurons on ginseng-reduced graphene oxide sheets. _Carbon_ 66, 395–406 (2014). Article CAS Google Scholar * Akhavan, O., Ghaderi, E., Shirazian,
S. A. & Rahighi, R. Rolled graphene oxide foams as three-dimensional scaffolds for growth of neural fibers using electrical stimulation of stem cells. _Carbon_ 97, 71–77 (2016). Article
CAS Google Scholar * Bong, J. _et al_. Dynamic graphene filters for selective gas-water-oil separation. _Sci. Rep._ 5, 14321 (2015). Article ADS CAS PubMed PubMed Central Google
Scholar * Sitko, R. _et al_. Adsorption of divalent metal ions from aqueous solutions using graphene oxide. _Dalton Trans._ 42, 5682–5689 (2013). Article CAS PubMed Google Scholar * Li,
B. & Cao, H. ZnO@graphene composite with enhanced performance for the removal of dye from water. _J. Mater. Chem._ 21, 3346–3349 (2010). Article Google Scholar * Zhu, M., Chen, P.
& Liu, M. Graphene Oxide Enwrapped Ag/AgX (X = Br, Cl) Nanocomposite as a Highly Efficient Visible-Light Plasmonic Photocatalyst. _ACS Nano_ 5, 4529–4536 (2011). Article CAS PubMed
Google Scholar * Perera, S. D. _et al_. Hydrothermal synthesis of graphene-TiO2 nanotube composites with enhanced photocatalytic activity. _ACS Catal._ 2, 949–956 (2012). Article CAS
Google Scholar * Li, X. Graphene oxide-based efficient and scalable solar desalination under one sun with a confined 2D water path. _Proc. Nat. Acad. Sci._ 113(49), 13953–13958 (2016).
Article CAS PubMed PubMed Central Google Scholar * Liu, Y., Dong, X. & Chen, P. Biological and chemical sensors based on graphene materials. _Chem. Soc. Rev._ 41, 2283–2307 (2011).
Article PubMed Google Scholar * Wang, L. _et al_. A graphene-conjugated oligomer hybrid probe for light-up sensing of lectin and Escherichia coli. _Adv. Mater._ 23, 4386–4391 (2011).
Article CAS PubMed Google Scholar * Kinoshita, H., Nishina, Y., Alias, A. A. & Fujii, M. Tribological properties of monolayer graphene oxide sheets as water based lubricant
additives. _Carbon_ 66, 720–723 (2014). Article CAS Google Scholar * Sarno, M., Senatore, A., Cirillo, C., Petrone, V. & Clambelli, P. Oil lubricant tribological behavior improvement
through dispersion of few layer graphene oxide. _J. Nanosci. Nanotechnol._ 14(7), 4960–4968 (2014). Article CAS PubMed Google Scholar * Gao, X., Li, J., Xie, Y., Guan, D. & Yuan, C.
A miltilayered silicon-reduced graphene oxide electrode for high performance lithium-ion batteries. _ACS Appl. Mater. Interfaces_ 7(15), 7855–7862 (2015). Article CAS PubMed Google
Scholar * Wang, M. _et al_. All-solid-state reduced graphene oxide supercapacitor with large volumetric capacitance and ultralong stability prepared by electrophoretic deposition method.
_ACS Appl. Mater. Interfaces_ 7(2), 1348–1354 (2015). Article CAS PubMed Google Scholar * Poulin, P. Superflexibilty of graphene oxide. _Proc. Nat. Acad. Sci._ 113(40), 11088–11093
(2016). Article ADS CAS PubMed PubMed Central Google Scholar * Voiry, D. _et al_. M High-quality graphene via microwave reduction of solution-exfoliated graphene oxide. _Science_
353(6306), 1413–1416 (2016). Article ADS CAS PubMed Google Scholar * Wang, Y., Li, Z., Wang, J., Li, J. & Lin, Y. Graphene and graphene oxide: biofunctionalization and applications
in biotechnology. _Trends in Biotechnology_ 29, 5 (2011). CAS Google Scholar * Dikin, D. A. _et al_. Preparation and characterization of graphene oxide paper. _Nature_ 448, 457–460 (2007).
Article ADS CAS PubMed Google Scholar * Dua, V. _et al_. All-organic vapor sensor using inkjet-printed reduced graphene oxide. _Angewandte Chemie_ 49, 2154–2157 (2010). Article CAS
PubMed Google Scholar * Zhang, L. L. _et al_. Highly conductive and porous activated reduced graphene oxide films for high-power supercapacitors. _Nano letters_ 12(4), 1806–1812 (2012).
Article ADS CAS PubMed Google Scholar * Suk, J. W., Piner, R. D., An, J. & Ruoff, R. S. Mechanical properties of monolayer graphene oxide. _ACS Nano_ 4(11), 6557–6564 (2010).
Article CAS PubMed Google Scholar * Zhu, Y. _et al_. Graphene and graphene oxide: synthesis, properties, and applications. _Advanced Materials_ 22, 3906–3924 (2010). Article CAS PubMed
Google Scholar * Dimiev, A. M. & Eigler, S. Graphene Oxide: Fundamentals and Applications. (Wiley, 2016). * Zhao, J., Liu, L. & Li, F. Graphene Oxide: Physics and Applications.
(Springer, 2015). * Gao, W. Graphene oxide: reduction recipes. spectroscopy and applications. 9–28 (Springer Cham Heidelberg New York, 2015). * Brodie, B. C. On the atomic weight of
graphite. _Phil. Trans. R. Soc. Lond._ 149, 249–259 (1859). Article ADS Google Scholar * Gottschalk, F. Beiträge zur Kenntnis der Graphitsäure. _J. Prakt. Chem._ 95(1), 321–350 (1865).
Article Google Scholar * Staudenmaier, L. Verfahren zur Darstellung der Graphitsäure. _Ber. Dtsch. Chem. Ges._ 31, 1481–1487 (1898). Article CAS Google Scholar * Berthelot, M.
Recherches sur lesétats du carbonne. _Ann. Chim. Phys._ 19, 391–417 (1870). Google Scholar * Luzi, W. Beiträge zur Kenntnis des Graphitkohlenstoffs. _Z. Naturwiss_ 64, 224–269 (1891).
Google Scholar * Charpy, G. Sur la formation de l’oxyde graphitique et la définition du graphite. _C. R. Hebd. Séances Acad. Sci._ 148, 920–923 (1909). CAS Google Scholar * Hamdi, H. Zur
Kenntnis der Kolloidchemischen Eigenschaften des Humus. Disperscoidchemische Beobachtungen an Graphitoxid. _Kolloid Beihefte_ 54, 554–643 (1942). Google Scholar * Weinschenk, E. _Ü_ber den
Graphitkohlenstoff und die gegenseitigen Beziehungen zwischen Graphit, Graphitit and Graphitoxid. _Z. Kristallogr_ 28(3), 291–304 (1897). CAS Google Scholar * Kohlschütter, V. &
Haenni, P. Zur Kenntnis des graphitischen Kohlenstoffs und der Graphits_ä_ure. _Z. Anorg. Chem._ 105(1), 121–144 (1919). Article Google Scholar * Hofmann, U. _Ü_ber Graphits_ä_ure und die
bei ihrer Zersetzung entstehenden Kohlenstoffarten. _Ber. Dtsch. Chem. Ges._ 61(2), 435–441 (1928). Article Google Scholar * Hofmann, U. & Frenzel, A. Quellung’von Graphit und die
Bildung von Graphits_ä_ure. _Ber. Dtsch. Chem. Ges._ 63(5), 1248–1262 (1930). Article Google Scholar * Thiele, H. Graphit und Graphits_ä_ure. _Z. Anorg. Allg. Chem._ 190(1), 145–160
(1930). Article CAS Google Scholar * Hofmann, U., Frenzel, A. & Csalán, E. Die Konstitution der Graphits_ä_ure und ihre Reaktionen. _Liebigs Ann. Chem._ 510(1), 1–41 (1934). Article
CAS Google Scholar * Hofmann, U. E. K_ö_nig, Untersuchungen über Graphitoxyd. _Allg. Chem._ 243, 311–336 (1937). Article Google Scholar * Scholz, W. & Boehm, H. P. Betrachtungen zur
Struktur des Graphitoxids. _Z. Anorg. Allg. Chem._ 369(3-6), 327–340 (1969). Article CAS Google Scholar * Mermoux, M., Chabre, Y. & Rousseau, A. FTIR and 13C NMR study of graphite
oxide. _Carbon_ 29(3), 469–474 (1991). Article CAS Google Scholar * Hummers, W. S. Jr. & Offeman, R. E. Preparation of graphitic oxide. _J. Am. Chem. Soc._ 80(6), 1339–1339 (1958).
Article CAS Google Scholar * Kovtyukhova, N. I. _et al_. Layer-by-layer assembly of ultrathin composite films from micron-sized graphite oxide sheets and polycations. _Chem. Mater._ 11,
771–778 (1999). Article CAS Google Scholar * Hirata, M., Gotou, T., Horiuchi, S., Fujiwara, M. & Ohba, M. Thin-film particles of graphite oxide 1: High -Yield synthesis and
flexibility of the particles. _Carbon_ 42, 2929–2937 (2004). CAS Google Scholar * Marcano, D. C. _et al_. Improved synthesis of graphene oxide. _ACS Nano_ 4, 4806–4814 (2010). Article CAS
PubMed Google Scholar * Marcano, D. C. Correction to improved synthesis of graphene oxide. _ACS Nano_ 12(2), 2078–2078 (2018). Article CAS PubMed Google Scholar * Shen, J. _et al_.
Fast and facile preparation of Graphene Oxide and reduced graphene oxide nanoplatelets. _Chem. Mater._ 21, 3514–3520 (2009). Article CAS Google Scholar * Peng, L. An iron-based green
approach to 1-h production of single-layer graphene oxide. _Nat. Commun._ 6, 5716 (2015). Article CAS PubMed Google Scholar * Guardia, L., Villar-Rodil, S., Paredes, J. L. & Tascon,
J. M. D. UV light exposure of aqueous graphene oxide suspensions to promote their direct reduction, formation of graphene-metal nanoparticle hybrids and dye degradation. _Carbon_ 50,
1014–1024 (2012). Article CAS Google Scholar * Xue, B., Zou, Y. & Yang, Y. A UV-light induced photochemical method for graphene oxide reduction. _J. Mater. Sci._ 52, 12742 (2017).
Article ADS CAS Google Scholar * Berni, A., Mennig, M. & Schmidt, H. Sol-Gel Technologies for Glass Producers and Users. 89–92 (Springer Science + Business Media, New York,
https://doi.org/10.1007/978-0-387-88953-5) (2004). Google Scholar * Abdolhosseinzadeh, S., Asgharzadeh, H. & Kim, H. S. Fast and fully scalable synthesis of reduced graphene oxide.
_Scientific reports_ 5, 10160 (2015). Article ADS CAS PubMed PubMed Central Google Scholar * Kumar, P. V. New insights into the thermal reduction of graphene oxide: Impact of oxygen
clustering. _Carbon_ 100, 90–98 (2016). Article CAS Google Scholar * Ferrari, A. C. Raman Spectrum of Graphene and Graphene Layers. _Phys. Rev. Lett._ 97, 187401 (2006). Article ADS CAS
PubMed Google Scholar * Pham, T. A., Kim, J. S. & Jeong, Y. T. One-step reduction of graphene oxide with L-glutathione. _Colloids Surfaces A: PhysicochemEng Aspects_ 384, 543–548
(2011). Article CAS Google Scholar * Qiu, J. D., Huang, J. & Liang, R. P. Nanocomposite film based on graphene oxide for high performance flexible glucose biosensor. _Sensors and
Actuators B._ 160, 287–294 (2011). Article CAS Google Scholar * Luo, Z., Lu, Y., Somers, L. A. & Johnson, A. T. High Yield Preparation of Macroscopic Graphene Oxide Membranes. _J. Am.
Chem. Soc._ 131, 898–899 (2009). Article CAS PubMed Google Scholar * Li, D., Muller, M. B., Gilje, S., Kaner, R. B. & Wallace, G. G. Processable aqueous dispersions of graphene
nanosheets. _Nat. Nanotechnol._ 3, 101–105 (2008). Article ADS CAS PubMed Google Scholar * Lucas, C. H., Peinado, A. J. L., Gonzalez, J. D. L., Cervantes, M. L. R. & Aranda, R. M.
M. Study of oxygen-containing groups in a series of graphite oxides: Physical and chemical characterization. _Carbon_ 33, 1585–1592 (1995). Article Google Scholar * Paredes, J. I., Rodil,
S. V., Alonso, A. M. & Tascon, J. M. D. Graphene oxide dispersions in organic solvents. _Langmuir_ 24, 10560–10564 (2008). Article CAS PubMed Google Scholar * Xu, Y., Bai, H., Lu,
G., Li, C. & Shi, G. Flexible Graphene Films via the Filtration of Water-Soluble Noncovalent Functionalized Graphene Sheets. _J. Am. Chem. Soc._ 130, 5856–5857 (2008). Article CAS
PubMed Google Scholar * Abdelkader, A. M., Valles, C., Cooper, A. J., Kinloch, I. A. & Dryfe, R. A. W. Alkali Reduction of Graphene Oxide in Molten Halide Salts: Production of
Corrugated Graphene Derivatives for High-Performance Supercapacitors. _ACS Nano_ 8, 11225–11233 (2014). Article CAS PubMed Google Scholar * Navarro, C. G. _et al_. Atomic structure of
reduced graphene oxide. _Nano Lett._ 10, 1144–1148 (2010). Article ADS CAS Google Scholar * Xie, J. _et al_. _In situ_ TEM characterization of single PbSe/reduced graphen oxide nanosheet
and the correlation with its electrochemical lithium storage performance. _Nano Energy_ 5, 122–131 (2014). Article CAS Google Scholar * Chang, W. C. _et al_. Solvent-free mechanochemical
reduction of graphene oxide. _Carbon_ 77, 501–507 (2014). Article CAS Google Scholar * Eigler, S. _et al_. Statistical Raman Microscopy and Atomic Force Microscopy on Heterogeneous
Graphene obtained after Reduction of Graphene Oxide. _J Phys Chem C_ 118(14), 7698–7704 (2014). Article CAS Google Scholar * Shard, A. G. Detection limits in XPS for more than 6000 binary
systems using Al and Mg K_α_ X-rays. _Surf. Interface Anal._ 46, 175–185 (2014). Article CAS Google Scholar * Kim, H. P., Yusoff, A. R. B. M. & Jang, J. Organic solar cells using a
reduced graphene oxide anode buffer layer. _Solar Energy Materials and Solar Cells_ 110, 87–93 (2013). Article CAS Google Scholar * Kim, S. R., Parvez, M. K. & Chhowalla, M.
UV-reduction of graphene oxide and its application as an interfacial layer to reduce the back-transport reactions in dye-sensitized solar cells. _Chem. Phys. Lett._ 483, 124 (2009). Article
ADS CAS Google Scholar * Yang, Q.-D. _et al_. Graphene oxide as an efficient hole-transporting material for high-performance perovskite solar cells with enhanced stability. _J. Mater.
Chem. A_ 5, 9852–9858 (2017). Article CAS Google Scholar * Cho, K. T., Grancini, G., Lee, Y., Konios, D. & Paek, S. Beneficial Role of Reduced Graphene Oxide for Electron Extraction
in Highly Efficient Perovskite Solar Cells. _ChemSusChem_ 9, 3040–3044 (2016). Article CAS PubMed Google Scholar * Zhang, X., Sun, X., Chen, Y., Zhang, D. & Ma, Y. One-step
solvothermal synthesis of graphene/Mn3O4 nanocomposites and their electrochemical properties for supercapacitors. _Materials Letters_ 68, 336–339 (2012). Article CAS Google Scholar * Cai,
W. _et al_. Synthesis and Solid-State NMR Structural Characterization of 13C-Labeled Graphite Oxide. _Science_ 321, 1815–1817 (2008). Article ADS CAS PubMed Google Scholar *
Boukhvalov, D. W. Modeling of epitaxial grapheme functionalization. _Nanotechnology_ 22, 20–25 (2011). Article CAS Google Scholar * Xiang, H. J., Wei, S.-H. & Gong, X. G. Structural
motifs in oxidized graphene: A genetic algorithm study based on density functional theory. _Phys. Rev. B._ 82, 35416 (2010). Article ADS CAS Google Scholar * Saxena, S. _et al_.
Investigation of structural and electronic properties of graphene oxide. _Appl. Phys. Lett._ 99, 1–4 (2011). Article CAS Google Scholar * Yan, J. A., Xian, L. & Chou, M. Y. Structural
and electronic properties of oxidized graphene. _Phys. Rev. Lett._ 103, 1–4 (2009). Google Scholar * Liu, L. _et al_. Amorphous structural models for graphene oxides. _Carbon_ 50,
1690–1698 (2012). Article CAS Google Scholar * Yan, J. A. & Chou, M. Y. Oxidation functional groups on graphene: Structural and electronic properties. _Phys. Rev. B - Condens. Matter
Mater. Phys._ 82, 21–24 (2010). Google Scholar * Minitha, C. R., Lalitha, M., Jeyachandran, Y. L., Senthilkumar, L. & Kumar, R. T. R. Adsorption behaviour of reduced graphene oxide
towards cationic and anionic dyes: Co-action of electrostatic and π-π interactions. _Mater. Chem. Phys._ 194, 243–252 (2017). Article CAS Google Scholar * Zhao, Y. & Truhlar, D. G.
The M06 suite of density functionals for main group thermochemistry, thermochemical kinetics, noncovalent interactions, excited states, and transition elements: Two new functionals and
systematic testing of four M06-class functionals and 12 other functionals. _Theor. Chem. Acc._ 120, 215–241 (2008). Article CAS Google Scholar * Rassolov, V. A., Ratner, M. A., Pople, J.
A., Redfern, P. C. & Curtiss, L. A. 6-31G* Basis Set for Third-Row Atoms. _J. Comp. Chem._ 22, 976–84 (2001). Article CAS Google Scholar * Zhang, W., Carravetta, V., Li, Z., Luo, Y.
& Yang, J. Oxidation states of graphene: Insights from computational spectroscopy. _J. Chem. Phys._ 131, 244505 (2009). Article ADS CAS PubMed Google Scholar * Pacile, D. _et al_.
Electronic properties and atomic structure of graphene oxide membranes. _Carbon_ 49, 966–972 (2011). Article CAS Google Scholar Download references ACKNOWLEDGEMENTS A.D.T. acknowledges
support from Center for Energy and Environment, IIT Patna during early stages of the work. The authors acknowledge Dr. V. K. Malik for support with SEM measurement. AUTHOR INFORMATION
AUTHORS AND AFFILIATIONS * Department of Physics, Indian Institute of Technology Patna, Bihta, 801106, India Pranay Ranjan, Apurva Sinha, Jayakumar Balakrishnan & Ajay D. Thakur *
Department of Chemistry, Indian Institute of Technology Patna, Bihta, 801106, India Shweta Agrawal & T. Rajagopala Rao * Department of Physics, Indian Institute of Technology Palakkad,
Palakkad, 678557, India Jayakumar Balakrishnan Authors * Pranay Ranjan View author publications You can also search for this author inPubMed Google Scholar * Shweta Agrawal View author
publications You can also search for this author inPubMed Google Scholar * Apurva Sinha View author publications You can also search for this author inPubMed Google Scholar * T. Rajagopala
Rao View author publications You can also search for this author inPubMed Google Scholar * Jayakumar Balakrishnan View author publications You can also search for this author inPubMed Google
Scholar * Ajay D. Thakur View author publications You can also search for this author inPubMed Google Scholar CONTRIBUTIONS A.D.T., J.B. and P.R. conceived the experiment(s), P.R., A.S.,
J.B. and A.D.T. conducted the experiment(s), S.A. T.R.R. and P.R. performed the computational work, A.D.T., P.R. and J.B. analyzed the results. A.D.T. and P.R. wrote the manuscript. All
authors reviewed the manuscript. CORRESPONDING AUTHORS Correspondence to Pranay Ranjan or Ajay D. Thakur. ETHICS DECLARATIONS COMPETING INTERESTS The authors declare no competing interests.
ADDITIONAL INFORMATION PUBLISHER'S NOTE: Springer Nature remains neutral with regard to jurisdictional claims in published maps and institutional affiliations. ELECTRONIC SUPPLEMENTARY
MATERIAL SUPPLEMENTARY INFORMATION FILE STEP1_SYNTHESIS STEP2_SYNTHESIS STEP3_SYNTHESIS STEP4_SYNTHESIS DATASET ALL RIGHTS AND PERMISSIONS OPEN ACCESS This article is licensed under a
Creative Commons Attribution 4.0 International License, which permits use, sharing, adaptation, distribution and reproduction in any medium or format, as long as you give appropriate credit
to the original author(s) and the source, provide a link to the Creative Commons license, and indicate if changes were made. The images or other third party material in this article are
included in the article’s Creative Commons license, unless indicated otherwise in a credit line to the material. If material is not included in the article’s Creative Commons license and
your intended use is not permitted by statutory regulation or exceeds the permitted use, you will need to obtain permission directly from the copyright holder. To view a copy of this
license, visit http://creativecommons.org/licenses/by/4.0/. Reprints and permissions ABOUT THIS ARTICLE CITE THIS ARTICLE Ranjan, P., Agrawal, S., Sinha, A. _et al._ A Low-Cost Non-explosive
Synthesis of Graphene Oxide for Scalable Applications. _Sci Rep_ 8, 12007 (2018). https://doi.org/10.1038/s41598-018-30613-4 Download citation * Received: 10 May 2018 * Accepted: 02 August
2018 * Published: 13 August 2018 * DOI: https://doi.org/10.1038/s41598-018-30613-4 SHARE THIS ARTICLE Anyone you share the following link with will be able to read this content: Get
shareable link Sorry, a shareable link is not currently available for this article. Copy to clipboard Provided by the Springer Nature SharedIt content-sharing initiative KEYWORDS * Graphene
Oxide (GO) * Expensive Membrane * Reduction Protocol * Tunable Conductivity * Fourier Transform Infra Red (FTIR)