Play all audios:
The mechanical properties of the extracellular microenvironment, including its stiffness, play a crucial role in stem cell fate determination. Although previous studies have demonstrated
that the developing brain exhibits spatiotemporal diversity in stiffness, it remains unclear how stiffness regulates stem cell fate towards specific neural lineages. Here, we established a
culture substrate that reproduces the stiffness of brain tissue using tilapia collagen for in vitro reconstitution assays. By adding crosslinkers, we obtained gels that are similar in
stiffness to living brain tissue (150–1500 Pa). We further examined the capability of the gels serving as a substrate for stem cell culture and the effect of stiffness on neural lineage
differentiation using human iPS cells. Surprisingly, exposure to gels with a stiffness of approximately 1500 Pa during the early period of neural induction promoted the production of dorsal
cortical neurons. These findings suggest that brain-stiffness-mimicking gel has the potential to determine the terminal neural subtype. Taken together, the crosslinked tilapia collagen gel
is expected to be useful in various reconstitution assays that can be used to explore the role of stiffness in neurogenesis and neural functions. The enhanced production of dorsal cortical
neurons may also provide considerable advantages for neural regenerative applications.
Determination of the fate of pluripotent stem cells and their development into functional cells is one of the crucial issues in the fields of developmental biology and regenerative medicine.
Accumulating evidence demonstrates that biochemical factors, including exogenous gene transfer, regulate the fate determination of stem cells. Recent studies have also revealed the
importance of the mechanical properties of the extracellular environment as a trigger of fate determination in vitro. Among these mechanical properties, the effect of extracellular stiffness
on stem cell fate decisions has been intensively analyzed1,2,3,4,5,6. A number of studies have determined the range of tissue stiffness in muscle (104 Pa), connective tissue (104 Pa), skin
(104 to 105 Pa) and bone (109 to 1010 Pa)7,8,9. Notably, brain tissue showed lower stiffness, ranging from 102 to 103 Pa7,8,9,10,11,12,13,14. Despite these findings, little is known about
how tissue stiffness affects the determination of stem cell fate towards specific cellular subtypes either in vitro or in vivo.
We previously reported the systematic analysis of living brain tissue stiffness during development13. Brain stiffness changes spatiotemporally throughout the embryonic stages during which
neurogenesis from neural stem cells and construction of the brain architecture mostly occur. Accordingly, a fundamental question arises of whether neural lineage choice, including neural
induction and differentiation, is influenced by differences in brain tissue stiffness. To address this question, it is essential to reproduce the stiffness conditions of living brain tissue
in vitro. Several research groups have utilized polyacrylamide (PAA)-based hydrogels as a culture substrate to provide a wide range of stiffness1,2,3,4,5,6,15,16,17,18. However, it has
proven technically demanding to consistently reproduce a substrate with a stiffness close to that of brain due to the relative softness10,11,12,13,14. Furthermore, acrylamide has been shown
to be toxic to neurons19.
To overcome these difficulties, here we applied collagen as a material to produce a culture substrate mimicking the stiffness of brain tissue. Collagen is a major component of connective
tissue in living tissue and can be easily extracted from various animals by acid solubilization. We selected collagen extracted from tilapia (Oreochromis niloticus) skin because the use of
fish collagen rather than collagen of mammalian origin is expected to reduce the possibility of the transmission of animal diseases to humans (“zoonosis”)20. Although acid-soluble collagen
molecules self-assemble into fibrils under physiological conditions, the stiffness of gels consisting of such fibrils can be controlled by chemical modification.
1-ethyl-3-(3-dimethylaminopropyl)-carbodiimide (EDC) is a commonly used crosslinking reagent for biomaterials, and N-hydroxysuccinimide (NHS) can enhance crosslinking between collagen fibers
in the presence of EDC21,22,23,24,25. Here, we identified an effective combination of EDC and NHS that produces a consistently softer range of collagen gel that mimics brain tissue, the
stiffness of which ranges from approximately 150 Pa close to the cortical plate13 to 1500 Pa close to the apical surface14. Notably, the chemically crosslinked collagen gel contained
triple-helical structures that may provide a scaffold for integrin signaling. Furthermore, the gel showed high transparency, and its surface appeared almost flattened compared to
fibril-formed collagen gels.
To test whether the gel established here can be used for stem cell culture and to evaluate the effect of stiffness on neural differentiation, we performed feeder cell-free cultures of human
induced pluripotent stem cells (hiPSCs). HiPSCs cultured on gels showed impaired pluripotency and entered the neural lineage in a manner similar to cells cultured on plastic dishes. To our
surprise, the neural characteristics acquired after 5 days of neural induction on a gel with a stiffness of 1500 Pa significantly switched to the lineage of dorsal forebrain neurons. These
results demonstrate that the tilapia collagen gel established here can be utilized for neural induction from pluripotent cells and that exposure to gels of a particular stiffness during the
initial stage of neural induction can determine the direction of differentiation towards a specific neural lineage.
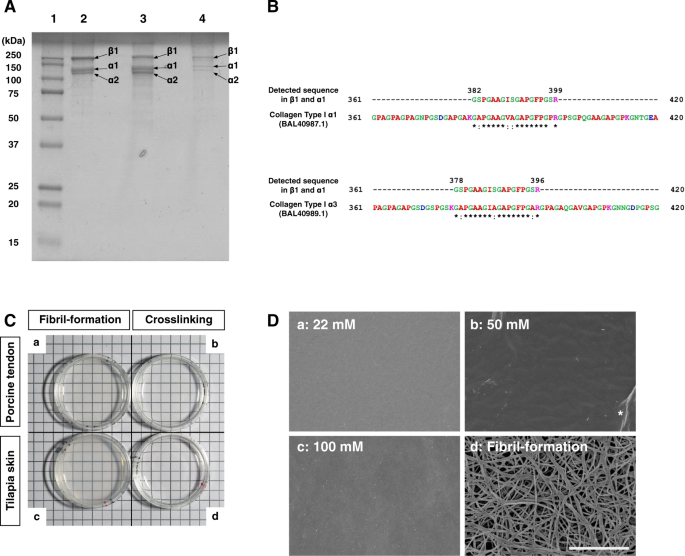
Tilapia skin collagen was extracted by acid solubilization, and SDS-PAGE was used to characterize the polypeptide composition of the tilapia skin collagen (Fig. 1A and Supplementary Fig.
S1A). Tilapia skin collagen exhibited two distinct bands between 100 and 150 kDa and a prominent band near 250 kDa without any major impurities (Fig. 1A, lane 2). According to previous
reports, the molecular weight of the α1 and 2 chains of collagen is approximately 116.5 to 126.2 kDa, and that of the β chain is 255.5 to 281.1 kDa26,27,28. The molecular weights of the
polypeptides present in extracted tilapia skin collagen fell within this range. The band pattern resembled that produced by commercially available type I collagen extracted from tilapia
scales and porcine tendon (Fig. 1A, lanes 3 and 4, respectively). To characterize collagen used in this study, we performed mass spectrometry using MALDI-TOF/MS analysis (Fig. 1B and
Supplementary Fig. S1B). We obtained the several peptide fragments and found matched protein sequences in the protein database (Supplementary Table S1). In addition, fish specific collagen
type I α329 was identified as Sequence_2 in the β and α1 bands (Supplementary Fig. S1Bb and Table S1). For further analysis of this sequence, we compared this sequence with fish collagen
type I α1, 2 and 3. We found the matched the position of this sequence in tilapia collagen type I α1 and 3 (Fig. 1B). This result was consistent with the previous report that collagen type I
α3 forms a β chain together with α1 and 2 and falls with α1 in SDS-PAGE29. Taken together with these results, collagen extracted from tilapia skin can be categorized as a type I collagen.
General characteristics of tilapia skin collagen. (A) SDS-PAGE analysis of collagen protein. Lane 1, molecular weight markers. Lane 2, tilapia skin collagen extracted in this study. Lanes 3
and 4, tilapia scale collagen and porcine tendon collagen, respectively. (B) Peptide sequence mapped on the reported sequence of tilapia collagen type I α1 and α3. Detected sequence in β1
(band No.1) and α1 (band No.2) shown in Fig. 1A and Supplementary Fig. S1B was identified as collagen type I α3, which is a fish specific collagen. BAL40987.1 and BAL40989.1 are tilapia
collagen type I α1 and α3 in GenBank, respectively. Red, small and hydrophobic includes armomatic –Y; Blue, Acidic; Magenta, Basic –H; Green, Hydroxyl, sulfhydryl, amine and G; * (asterisk)
indicates positions that have a single, fully conserved residue : (colon) indicates conservation between groups of strongly similar properties. (C) Transparency of gels prepared by various
methods. The origin of the material was porcine tendon (a and b) or tilapia skin (c and d). The material shown in (a) and (c) was prepared by the fibril-formation method, and that shown in
(b) and (d) was prepared by the crosslinking method. Gels prepared by the crosslinking method displayed higher transparency than those prepared by the fibril-formation method. (D) SEM images
of the surfaces of tilapia collagen gels prepared by the crosslinking ([NHS]/[EDC] = 0.1, a to c) and fibril-formation (d) methods are shown. The final concentration of EDC is indicated in
each panel. Note that gels prepared by the crosslinking method displayed nearly flat surfaces, whereas distinct fibrous structures were observed in gels prepared using the fibril-formation
method. The asterisk indicates creases that appeared during the preparation of the sample for SEM observation. Bar = 3 μm.
To test whether tilapia skin collagen can form gels, we first attempted various gel preparation methods in which we compared collagen from tilapia skin with collagen obtained from porcine
tendon (Fig. 1C and Supplementary Fig. S1C). Collagen gel prepared by neutralization (hereafter, the “(physical) fibril-formation method”) of either porcine tendon or tilapia skin collagen
displayed a muddied white color in both cases (Fig. 1Ca,c, respectively). In contrast, a gel prepared from either porcine tendon or tilapia skin collagen by adding crosslinking reagents
(hereafter, the “(chemical) crosslinking method”) had a clear appearance in both cases (Fig. 1Cb and d, respectively). These results demonstrate that collagen from tilapia skin can form a
gel in a manner that is similar to gel formation by commercially available porcine tendon collagen. To further analysis of gel characteristics, surface of gels was examined using scanning
electron microscopy (SEM) because the surface structure of the culture substrate can influence the determination of cell fate30,31,32. Remarkably, the surfaces of gels prepared by the
chemical crosslinking method were almost flat, and no detectable fiber-like structures were present irrespective of the concentrations of crosslinking solution used in the preparation of the
gels (Fig. 1Da–c). In contrast, distinct fiber-like structures were observed in the gels prepared by the fibril-formation method (Fig. 1Dd). These results show that the surfaces of tilapia
skin collagen gels established by the crosslinking method do not contain structures that may affect cell fate determination.
To achieve variety in the stiffness of the gels, we next investigated the concentration of crosslinking reagents. For this purpose, we mixed EDC and NHS, two widely used soluble crosslinking
reagents, with tilapia skin collagen at various concentrations. Crosslinking by EDC activates the carboxylic acid group in collagen. NHS forms a stable ester and increases the number of
crosslinking sites between collagen fibrils in the presence of EDC33,34. Importantly, a byproduct of this reaction is urea, which is not hazardous to cells and is easily removed by washing.
Therefore, we chose EDC and NHS as crosslinking reagents.
The gel stiffness was defined by the storage modulus of the gel (G′) as shown in Fig. 2A. In the absence of NHS, the average value of G′ increased up to 496 ± 6 Pa at 100 mM EDC depending on
the EDC concentration (67 ± 3, 290 ± 13 and 496 ± 6 Pa at 20, 50 and 100 mM EDC, respectively).
Effects of EDC and NHS concentrations on gel stiffness. (A) Storage modulus (G′) of gels prepared using various combinations of EDC and NHS. The storage modulus of gels without NHS was
approximately 500 Pa at 100 mM EDC. When NHS solution was added, the storage modulus showed a linear increase over the range 0.001 to 0.1 ([NHS]/[EDC]). The linearity was no longer present
at ratios of 0.5 and 1. The widest range of storage modulus was observed at a ratio of 0.1. (B) Storage modulus of gels as a function of the concentration of crosslinkers at a ratio of
[NHS]/[EDC] of 0.1. The storage modulus showed linearity between 20 and 100 mM EDC; the value of the storage modulus saturated at approximately 1600 Pa at the highest concentrations of EDC
(150 and 200 mM). (C) Frequency-dependent storage and loss modulus of gels. All conditions with the exception of 10 mM of EDC showed stable storage modulus values during measurement. Solid
lines and dashed lines indicate the storage modulus (G′) and the loss modulus (G″), respectively. (D) Thickness of the gels. All conditions except 10 mM EDC resulted in the formation of a
gel of approximately 1.5 mm thickness when 2 ml of solution was added to a 35-mm dish.
Because it provided the broadest range of stiffness, we used an [NHS]/[EDC] ratio of 0.1 in further attempts. We tested gel stiffness with seven combinations of [NHS] and [EDC] at a ratio of
0.1 (Supplementary Table S3). The average values of G′ observed were 13.0 ± 1 [EDC 10 mM]0.1, 136 ± 13 [EDC 20 mM]0.1, 145 ± 14 [EDC 22 mM]0.1, 780 ± 17 [EDC 50 mM]0.1, 1487 ± 62 [EDC 100
mM]0.1,1654 ± 27 [EDC 150 mM]0.1 and 1663 ± 62 Pa [EDC 200 mM]0.1 (Fig. 2B and Supplementary Table S3). The G′ value increased linearly with the EDC concentration over the range 20 to 100 mM
and reached a plateau at concentrations greater than 150 mM (Fig. 2B).
Analysis of the frequency-dependent storage moduli of the gels demonstrated the stability of gels within the range [EDC 20 mM]0.1 to [EDC 200 mM]0.1. To further investigate the properties of
gels, we measured the G′ and loss modulus (G″) with a linear strain condition. We found that the G″, indicating viscosity of gels, was maintained lower than G′ during measurement in all the
conditions with the exception of EDC 10 mM (Fig. 2C and Supplementary Fig. S2). In addition, we measured the time dependency of G′ and G″ to confirm the polymerization kinetics during
crosslinking (Supplementary Fig. S3). The G′ value in 22 and 100 mM was lower than G″ at the beginning of the measurement. However, the G′ value crossed over the G″ value immediately and
remained higher value than G″ during measurement. These results suggested that crosslinking was dominant during gelation and contributes to maintain gel elasticity within the range of 22 to
100 mM of EDC. In contrast, gels prepared at the lowest concentration [EDC 10 mM]0.1 showed great dispersion during measurement and exhibited lower G′ value than G″ during the later phase of
measurement (Fig. 2C and Supplementary Fig. S2). We also found that the thickness of gels prepared at [EDC 10 mM]0.1 was significantly decreased (Fig. 2D), indicating that the gel’s
internal structure was unstable at lower concentrations of EDC and NHS.
In further analysis of the characteristics of collagen in gels, we focused on the behavior of collagen molecules during gelation. First, we investigated the interaction between collagen
fibers during gelation by monitoring the turbidity of the collagen solution at 310 nm (Fig. 3A). In fibril-formed collagen, the absorbance at 310 nm increased and reached a plateau (Fig.
3Aa, purple triangle). Figure 3Ab shows a magnified view of the representative plot shown in the rectangle in Fig. 3Aa. Compared to gels prepared using the fibril-formation method,
absorbance at 310 nm was significantly suppressed in gels prepared by the chemical crosslinking method (Fig. 3Aa,Ab); these gels displayed absorbance that was similar to that of the control
collagen solution (white triangle in Fig. 3Aa). Second, we examined the degree of crosslinking by measuring the free amine group content of the gels (Fig. 3B). Compared to the control
without EDC and NHS, the free amine group content decreased from 100% to approximately 80% over the range [EDC 22 mM]0.1 to [EDC 200 mM]0.1, whereas the free amine group content was higher
at [EDC 10 mM]0.1 and [EDC 20 mM]0.1. Taken together, these results show that the gels prepared by the crosslinking method showed elastic properties with a high linearity along EDC
concentration within the range [EDC 20 mM]0.1 to [EDC 100 mM]0.1 and sufficient crosslinking reaction within the range [EDC 22 mM]0.1 to [EDC 200 mM]0.1. Therefore, we pursued further
characterization of gels prepared at [EDC 22 mM]0.1 to [EDC 100 mM]0.1 because these EDC concentrations resulted in G′ values ranging from 150 to 1500 Pa (close to the stiffness of brain
tissue) in an accurately adjustable manner.
Molecular properties of collagen during gelation. (A) (a) A typical time plot of turbidity during gelation of a collagen solution (white triangles), fibril-formation method (purple
triangles) and crosslinkers at an [NHS]/[EDC] ratio of 0.1 (22 and 100 mM EDC (pink and blue lines). The absorbance at 310 nm gradually increased and reached a plateau, displaying a sigmoid
curve pattern in the fibril-formation method, whereas it was maintained at a constant value in the collagen solution and in gels prepared by the crosslinking method. (b) Magnified view of
the rectangle area in (a) showing absorbance at 310 nm when various EDC and NHS concentrations were used in the crosslinking method. (B) The degree of crosslinking obtained at various EDC
and NHS concentrations was monitored by measurement of the free amine group content of the gels. The data were plotted over a time period of 300 sec.
We measured the circular dichroism (CD) spectrum of the gel material to determine whether a collagen triple helix was present in the gels. We used four representative conditions for CD
spectral analysis at 20 °C and 37 °C: 0.3 wt% tilapia collagen solution (pH 3.0), fibril-formed physical collagen gels, and chemically crosslinked collagen gels prepared with 22 and 100 mM
EDC ([EDC 22 mM]0.1 and [EDC 100 mM]0.1, respectively) (Fig. 4). A positive peak at 221 nm and negative peaks near 190–200 nm reflecting the presence of a triple collagen helix were observed
at 20 °C under all conditions; these peaks disappeared in 0.3 wt% collagen solution at 37 °C (Fig. 4A). The pattern of positive peaks at 221 nm in the [EDC 22 mM]0.1 and [EDC 100 mM]0.1
samples was essentially similar under the tested conditions of crosslinker concentration and temperature (Fig. 4C,D). The wavelengths and heights of the negative peaks varied depending on
the gel conditions. These results show that tilapia collagen gels prepared by the chemical crosslinking method contain triple-helical collagen that is stably maintained under the
physiological conditions used to culture mammalian cells.
CD spectra of tilapia collagen solution and gels. The CD spectra of the following materials were measured at 20 °C (gel-forming temperature, shown in blue) and at 37 °C (culture temperature,
shown in red) (n = 3 for each condition): (A) 0.3% tilapia collagen solution diluted in HCl (pH 3.0); (B) fibril-formed physical collagen gel; (C,D) chemically crosslinked collagen gels
(SOFT [EDC 22 mM]0.1 and HARD [EDC 100 mM]0.1, respectively). The thin dotted lines indicate the individual spectra; the bold lines indicate the average spectral values for each condition.
Considerable evidence has been presented indicating that several types of undifferentiated stem cells tend to differentiate into neural lineages when they are cultured on soft
substrates2,3,4,5,6,16. Here, we addressed whether tilapia collagen gels that mimic brain stiffness have an effect on the differentiation of pluripotent stem cells. HiPSCs were maintained in
plastic dishes without feeder cells to avoid the stiffness effect of feeder-derived matrices35. Subsequently, hiPSC-colonies were enzymatically dissociated into single-cell suspensions and
seeded at equal densities for passaging either on plastic dishes or on chemically crosslinked gels; the medium was then changed to a neural differentiation medium that has been reported to
result in a high rate of production of dorsal cortical neurons36. For hiPS cell-line, we chose RPChiPS771-2 because of the higher production rate of dorsal cortical neurons in our culture
condition (Supplementary Fig. S4). For these experiments, we chose gels of two distinct stiffnesses, that is, gels prepared at [EDC 22 mM]0.1 (145 ± 15 Pa) and [EDC 100 mM]0.1 (1487 ± 62
Pa); these were defined as “SOFT” and “HARD”, respectively. HiPSCs did not grow on gels, plastic dishes or coverslips without coatings. Therefore, we tested several coating materials and
chose Vitronectin XF because it provided sufficient cellular adhesion on all substrates used in this study (Supplementary Fig. S5 and Table S4). To test the possibility that the Vitronectin
XF coating may change the surface structure of gels and alter the fate of stem cells, we examined the surfaces of gels coated with Vitronectin XF using confocal laser scanning microscopy and
SEM (Fig. 5). Adsorbed aggregates of vitronectin were identified on both SOFT and HARD as well as coverslips used for control (hereafter “Control”) after coating (Fig. 5A,Ca,Cb).
Quantification of vitronectin in the adsorption equilibrium revealed that the density of vitronectin was essentially similar between two gels and Control (Fig. 5B). In contrast, fibrous
structures remained on the surface of the gels prepared by the fibril-formation method (Fig. 5Cc).
Quantification of ligand distribution on culture substrate. (A) Vitronectin distribution on culture substrate using anti-vitronectin antibody (White particles in a, b and c). Magnified
images indicated as yellow squares (a′, b′ and c′). Bars = 10 μm for a, b and c and 2 μm for a′, b′ and c′. (B) Quantification of density of vitronectin. There was no significant difference
in the density of vitronectin (one-way ANOVA and Turkey post hoc test). (C) SEM images of the surface structures of gels coated with Vitronectin XF (SOFT, HARD and fibril-formed collagen
gel) are shown. Similar particles were observed after coating irrespective of the stiffness of chemically crosslinked gels (a and b). Note that the fibrous structure of the fibril-formed
collagen gel was retained after coating (c). Bar = 3 μm.
We aimed to examine the effect of stiffness for neural differentiation on SOFT and HARD gels and coverslips. First, we confirmed the differentiation ability of hiPSCs towards three germ
layers using embryoid body (EB) assay37 followed by cultured on gels and coverslips (Fig. 6Aa). After transferring the EBs on dishes, cells derived from EBs showed several types of
morphologies. We observed epithelial cells, cobblestone-like cells and neuronal cells under all conditions (Supplementary Fig. S6). RT-PCR analysis revealed that the expression of the three
germ layer specific genes (Fig. 6B and Supplementary Fig. S7).
Expression of pluripotent and neural stem cell markers during neural induction on gels. (A) (a) Schematic of EB formation culture. White circles, the day of medium change; Black inverted
triangles, the day of sampling. (b) Schematic of neural induction of hiPSCs on gels. Day 0 indicates the day on which differentiation medium was first applied. The cells were cultured on
gels in plastic dishes up to Day 6. KSR EB medium, Knockout Serum Replacement EB medium; ND medium, Neural Differentiation medium; White circles, the day of medium change; Black inverted
triangles, the day of sampling. (B) RT-PCR analysis of differentiation markers of three germ layers expressed after EB formation followed by culture on gels and plastic dishes. Mesodermal
markers, PDGFRα and ISL1; Endodermal markers, AFP and HNF1B; Ectodermal markers, PAX6 and MAP2. U, undifferentiated hiPSCs on Day 0; D, differentiated hiPSCs on Day 14. (C) (a) Confocal
images of hiPSCs stained with antibodies against OCT4 and SSEA-4. The culture conditions and the number of days after neural induction are indicated in the panel. (b) QRT-PCR analysis data
showing that the mRNA level of OCT4 decreased during the early phase of culture under all conditions (n = 2). (D) (a) Confocal images of hiPSCs stained with antibodies against NANOG and
SSEA-4. The culture conditions and the number of days after neural induction are indicated in the panel. (b) QRT-PCR analysis data showing that the mRNA level of NANOG decreased during the
early phase of culture and that it was almost completely absent on Day 6 under all conditions (n = 2). (E) (a) Images of hiPSC-derived neural cells stained with antibodies against PAX6, TUJ1
and with DAPI. PAX6 expression was first observed on Day 4. The vast majority of cells were positive for PAX6 on Day 6 under all conditions. (b) QRT-PCR analysis of the expression of PAX6.
PAX6 expression increased from Day 4 to 6. The PAX6 expression level showed no significant differences among the conditions at any of the time points tested (one-way ANOVA, n = 3). Bars =
200 μm (C–E). For the statistical analysis of qRT-PCR and counting, *P