Play all audios:
ABSTRACT Lake Urmia is one of the largest hypersaline lakes on earth with a unique biodiversity. Over the past two decades the lake water level declined dramatically, threatening the
functionality of the lake’s ecosystems. There is a controversial debate about the reasons for this decline, with either mismanagement of the water resources, or climatic changes assumed to
be the main cause. In this study we quantified the water budget components of Lake Urmia and analyzed their temporal evolution and interplay over the last five decades. With this we can show
that variations of Lake Urmia’s water level during the analyzed period were mainly triggered by climatic changes. However, under the current climatic conditions agricultural water
extraction volumes are significant compared to the remaining surface water inflow volumes. Changes in agricultural water withdrawal would have a significant impact on the lake volume and
could either stabilize the lake, or lead to its complete collapse. SIMILAR CONTENT BEING VIEWED BY OTHERS LAKE WATER STORAGE CHANGES AND THEIR CAUSE ANALYSIS IN MONGOLIA Article Open access
09 October 2024 DIVERGENT EFFECTS OF TEMPERATURE AND PRECIPITATION ON WATER FLOW INTO THE LARGEST LAKE ON THE TIBETAN PLATEAU Article Open access 30 March 2025 STRENGTHENING OF THE
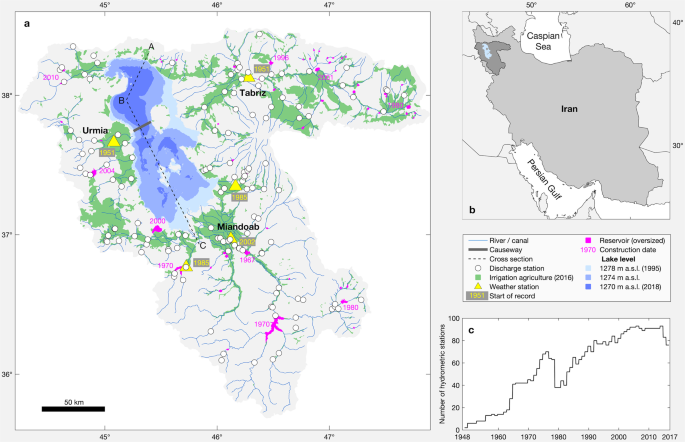
HYDROLOGICAL CYCLE IN THE LAKE CHAD BASIN UNDER CURRENT CLIMATE CHANGE Article Open access 20 October 2024 INTRODUCTION Lake Urmia is an endorheic lake located in north-west of Iran (Fig.
1). With an average original surface area of about 5,000 km2 it is one of the largest hypersaline lakes on earth1,2,3. Considering its original extent, Lake Urmia has more than one hundred
islands, which are vital for the reproduction of various local birds, but also as a safe breeding refuge of migratory birds such as Flamingos and White Pelicans2. The main islands are an
ideal habitat for endangered species such as the Iranian yellow deer and Armenian mouflon4. Despite its very high natural salinity of 140–280 gL−1 5,6, the lake itself constitutes a living
space for diverse bacterial communities, halophilic phytoplankton, or the brine shrimp _Artemia urmiana_4. Starting in 1995, Lake Urmia experienced a strong decline in lake level. Between
1995 and 2013 the lake lost about 60% of area and even more than 90% of its volume7,8,9,10. Although the interannual variability of the lake level has always been high, the extreme decline
in the 90 s is a singular event, at least in the last 100 years11,12. This loss of volume has negative impacts on the lake’s ecosystems, such as a significant reduction of the aquatic
habitat accompanied by an increase of salinity to more than 300 gL−1 2, which has caused a severe slowdown of the reproduction rate of _Artemia Urmiana_13. Moreover, most islands have
disappeared and the deposition of sand dunes and evaporites on the dried-up lake bed has formed a vast salty desert. The reasons behind the pronounced water level decline during the past two
decades are controversial. Several studies state that the reduction of surface water inflow due to agricultural extraction predominantly caused the lake level
decline14,15,16,17,18,19,20,21,22. This was mainly triggered by an uncontrolled growth of the irrigated area, accompanied by the extensive construction of reservoirs, and poor agricultural
water use efficiency. Several studies base their conclusions on trend analysis of hydro-meteorological data sets8,19,22,23. While Jalili _et al_.19 and Khazaei _et al_.22 identified only
weak correlations between meteorological variables and lake level and hence concluded that mainly anthropogenic changes caused the lake level decline, Alizadeh-Choobari _et al_.8 and
Zoljoodi and Didevarasl23 could identify more pronounced trends in climate variables, i.e. increasing temperatures and decreasing precipitation over the last decades. Interestingly, the
studies from the former authors base on rather large-scale satellite products, while the latter have used records of local weather stations. Three of the studies mentioned above even provide
quantitative estimates of anthropogenic impacts. Ghale _et al_.16 concluded on the basis of a time series analysis comparing the water balance of the lake with agricultural water
consumption that about 80% of the shrinkage in the period 1998–2010 was man-made. Using a hydrological model, Chaudhari _et al_.15 found that 86% of the shrinkage of the lake in the period
1995–2010 can be explained by human activities. Hassanzadeh _et al_.17 used a system dynamics model24 to analyze the influence of different management and climate scenarios on the lake
volume. Their model results suggest that the influence of the reservoirs (at a storage volume of about 1 km3), the changes in precipitation directly above the lake, and the reduced inflow
due to overuse of surface water are responsible for 25%, 10% and 65% of the volume loss, respectively. Other studies conclude that changes in climate, i.e. reduced precipitation and
increased temperatures, are mainly responsible for lowering the lake level7,9,25,26,27. Generally, these studies based their assumptions on similarities between trend patterns of climate and
inflow into the lake. Fathian _et al_.26 showed that decreasing discharge trends can already be observed in the headwater catchment areas, which indicate climate-induced changes, and that
the reservoirs do not seem to have a significant influence. Shadkam _et al_.7 analyzed the relative contribution of climate change and water management to the water balance of the lake using
a variable infiltration capacity model. They also conclude that reservoirs have no significant impact on the reduced lake inflow and that climate and irrigation have an impact of 60% and
40% respectively. Furthermore, they state that the increased irrigation water demand results from stronger and longer periods of drought and thus establish a direct correlation between the
increasing agricultural water demand and climatic changes. The future of Lake Urmia is at stake. The relevance and interplay of global and regional factors, i.e. climate change and local
water management, will determine its fate. Although our ability to influence climatic changes seems to be rather limited, at least on a short time scale, an optimization of agricultural
practices has a proven potential for immediate water savings28. However, to encourage and justify related water savings requires a prediction of their potential benefits based on
scientifically sound future projections. To this end, we quantify the components of the water budget of Lake Urmia over the last five decades and analyze their temporal evolution and
interplay. Based on the water balance, we perform a series of simulations of different development scenarios to analyze whether and to what extend local agricultural water saving could
contribute to the restoration and conservation of Lake Urmia. RESULTS AND DISCUSSION LAKE URMIA’S WATER BALANCE Lake Urmia is the limnic end member of an endorheic (closed) basin, which
means that its only relevant outflow component is the evaporation (_E_) from the lake surface. Inflow into the lake results from several rivers (_Q_) and from direct precipitation (_P_).
Also, a certain groundwater component in the water balance cannot be precluded, especially if one considers the groundwater extraction through tens of thousands of legal and illegal wells in
the Lake Urmia catchment29. To the best of our knowledge, however, the vast majority of studies assume that a direct groundwater component is relatively small compared to the previously
mentioned ones. For instance, hydrochemical investigations at the western shore indicated almost no direct hydraulic interaction between groundwater and lake water30, another study
considered a direct component to be less than 3% of total inflow7, and some studies provide even quantitative estimates ranging from about 60 × 106 m3a−1 to 210 × 106 m3a−1 29,31,32. The
reason for these rather low rates is the fact that the main receiving water bodies for the groundwater are the perennial rivers discharging into the lake1,7,32,33. Therefore, a direct
groundwater component is neglected in the water balance of the lake, Eq. (1). $$\frac{dS}{dt}=\frac{P+Q-E}{dt}$$ (1) where dS is the change of water storage in the lake over the time period
dt. Available data sets allowed the computation of the water balance from October 1953 to September 2017 with hydrological seasons extending from October to September in the following year
(Fig. 2). Between 1965 and 1995 the lake received an annual average of 4.9 km3 water from its tributaries. Despite strong interannual variations, after 1995 a decline in river water inflow
is evident, i.e. the mean annual discharge rate dropped by 50% to about 2.4 km3a−1 (1995 to 2017). The lowest annual surface discharge to the lake of only 0.5 km3 was recorded in 2015 (Fig.
2). The total volume of precipitation input and evaporation loss depend on the extent of the lake. Moreover, the actual evaporation rate depends on the salt concentration, which increases by
reduction in lake volume. As a consequence of both, there has been a large evaporation rate in 1990s and the previous decades (up to 8.8 km3a−1). Thus, the decreasing evaporation loss to
some extend buffers the lower inflow rates and leads to an almost equilibrated water balance since 2013. The calculated changes in the lake volume by considering the water balance components
and the observed changes in lake volume agree quite well (Fig. 2), indicating the validity of the proposed water balance. For statistical analysis, which is the subject of the next section,
we distinguished six periods between 1965 and 2017 that are characterized by their general trends in the lake volume evolution. Although, the available data set allowed us to draw the water
balance for the lake since 1953, the number of operating hydrometric stations is rather limited before 1965, i.e. they have more than doubled from 1963 (n = 18) to 1965 (n = 42, Fig. 1c),
which likewise improves the robustness of the data set. Besides, the separation of the periods bases on a visual analysis of storage change patterns, i.e. steep increase in lake volume
during periods 1 and 3 with an observed change of storage (dS) of 3.2 km3a−1 in both cases, a quite stable lake volume during periods 2 and 6 with dS = −0.3 km3a−1 and 0.1 km3a−1,
respectively, a steep decrease in lake volume during period 4 (dS = −3.0 km3a−1), and a moderate decrease during period 5 (dS = −0.9 km3a−1, Fig. 2). CHANGING CLIMATE VS. IRRIGATION WATER
CONSUMPTION Precipitation and evaporation are the principal natural boundary conditions and drivers for streamflow. Here, we compare the temporal patterns of precipitation and evaporation
with the discharge volumes of the rivers. To allow for a direct comparison, we applied the 12-months Standardized Precipitation Evaporation Index (SPEI), which is a multi-scalar measure
accounting for precipitation and potential evaporation34. In analogy to the SPEI, we used the Standardized Runoff Index (SRI)35 representing the river flows. Both indices have the same scale
and positive values indicating wetness, while negative values indicate dryness. For the SRI two different time series are used: one, which is based on the discharge weighted mean of all
discharge stations and another one, which only bases on those stations that are the closest for each main river to the river mouth (Fig. 3a). The latter SRI series represents the inflow
reaching the lake and is more relevant for the lake water budget. In analogy to the six periods, defined earlier for the evolution of the lake volume, we have also subdivided these time
series into six periods. In addition to the six periods, we also show statistical parameters for a period from 1954 to 1965. Here it should be noted, however, that the corresponding data set
might be less robust due to less operating hydrometric stations described above. The SRI seems to follow the SPEI with a good approximation, which is also illustrated by the Mann-Kendall
trends. Only in period 5 the trends differ significantly, with no significant trend for SPEI and a negative trend for SRI (Fig. 3a). Interestingly, this period is also characterized by a
strongly increasing capacity of reservoirs in the catchment, i.e. it almost doubled from 1.2 km3 to 2.1 km3, and an increasing surface water consumption for irrigated agriculture (Fig. 3d).
To further analyze the relationship between SPEI and SRI, their individual monthly values are compared (Fig. 3b). As expected, during periods which show a significant decline in lake volume
(periods 4 and 5) or a very low volume (period 6), mean SRI and SPEI values are negative. During periods 1 and 3, Lake Urmia experienced an increase in water level, which is reflected by
positive values of mean SRI and SPEI. Moreover, it can be observed that during period 1, the mean SRI is higher than the SPEI, which indicates more favorable discharge conditions. The lowest
mean SRI in relation to the corresponding SPEI can be found in period 2. Other mean SRI and SPEI differ less, i.e. they plot quite close to the 1:1 line, including in periods 4 and 5 during
which the severe lake level drop happened (Fig. 3b). We also analyze the slope of the linear regression of the monthly SPEIs and the responding SRIs. For this purpose, we not only analyze a
single slope, but perform a bootstrap sampling with 1,000 data samples per period. The result of the bootstrapping analysis is displayed by a probability density function of the slopes for
each period (Fig. 3c). Generally, higher slope values indicate stronger responses of river flow to changes in weather. Interestingly, anthropogenic alteration can cause both a weakened and
an amplified response. A weakened response is usually expected due to damming, while an amplified response often results from water extraction for irrigation. This amplification commonly
results from an exceptionally high irrigation water withdrawal during dry seasons and a reduced extraction during wet seasons36. In our case, the strongest response appears for period 4,
during which the most rapid lake level decline happened (Figs. 2 and 3c). Based on the previous discussions, this might be a consequence of increased extraction of irrigation water to
mitigate the impact of drought. However, this explanation seems not very likely as the majority of the very dry months (very low SRI and SPEI) plotting well above the 1:1 line (Fig. 3b),
i.e. they don’t show exceptionally low discharge rates related to the weather conditions. In contrast, the weakest response (lowest slopes) of SRI to SPEI occurred during periods 2 and 6
followed by period 1 and 5 (Fig. 3c). In this case, too, the explanation that the dams could be the cause seems rather unlikely. Since the number and likewise the cumulative volume of dams
has steadily increased over time (Fig. 3d), a steady increase in influence (i.e. weakening of response) could have been expected. Results show that the temporal pattern of river flow rates
can be well explained by weather changes, while an anthropogenic impact is not so obvious. However, in our analyses we have so far focused on an explanation for the temporal variability of
the river runoff, which could imply the risk of a systematic influence being ignored. And indeed, a look at the temporal evolution of surface water consumption for irrigation reveals such a
systematic influence (Fig. 3d). Since about 1970 irrigation was promoted for agricultural development and first large-scale water management was introduced with the construction the
reservoirs Bukan and Mahabad (Fig. 1a)37. Since then, records of surface water extraction for irrigation show high, but relatively constant rates. The only remarkable change occurred during
the period 5 with an increase from 2.1 to 2.6 km3a−1. During the extreme lake level drop in period 4, the increase of irrigation water extraction was only about 0.2 km3a−1, while the inflow
to the lake decreased by 90% from 6.0 to 0.6 km3a−1 (Figs. 2 and 3d). However, it is important to note that the withdrawal rates are generally on a quite high level and often (especially in
the recent years) exceed the remaining inflow into the lake. On the basis of this perception and previous results, it can be concluded that although the massive irrigation withdrawal of
surface water does not seem to directly cause the significant decline in the lake level over the last two decades, it has greatly weakened the lake’s resilience, making it vulnerable to
climate change. This hypothesis is also supported by a parsimonious modeling experiment (Supplementary Information 1). Here it could be shown that even under more or less natural inflow
conditions (irrigation water extraction added to the inflow), the simulated lake volume also decreased significantly over the last two decades. Its temporal variability does not differ too
much from the observed lake volume either. However, under these natural inflow conditions, the simulated lake volume is constantly well above the simulated one, which takes irrigation water
abstraction into account. Hence, the volume decrease of the lake under natural inflow conditions is much less pronounced, i.e. for the year 2017 the simulated lake volume without irrigation
water extraction (8.3 km3) is more than four times larger than the volume with irrigation water extraction (1.9 km3, Supplementary Fig. S1). RESERVOIRS AND DISCHARGE From 1967 to 2015, 57
reservoirs with total capacity of 2.2 km3 were built in the Lake Urmia catchment to ensure a stable water supply for irrigated agriculture. An analysis of the impact of these reservoirs on
the river runoff (Supplementary Information 2) revealed that runoff time series from downstream hydrometric stations do not show negative runoff trends more frequently than those that are
not influenced, i.e. before reservoir construction or upstream of a reservoir (Supplementary Fig. S2). After the construction of the reservoirs, on the other hand, the discharge is reduced
on average by about 10%. Here, however, it is difficult to say whether this is a direct consequence of reservoir construction or merely a consequence of the generally declining runoff of
recent decades. A clear difference between the runoff time series before and after reservoir construction is the interannual variability. After reservoir construction, the interannual
variability is more balanced, i.e. runoff is relatively higher during dry months and relatively lower during wet months compared to the temporal runoff pattern before reservoir construction
(Supplementary Fig. S3). This shows quite clearly the intended water retention to support the irrigation water supply in the dry months. IMPLICATIONS ON FUTURE PERSPECTIVES Evaporation from
the lake strongly depends on the lake surface area and its salt concentration and thus counteracts low inflow rates. However, this only works effectively as long as there is a strong
reduction of the lake area as a feedback to a decreasing volume. To analyze this, we need to take a look at the lake morphology. Lake Urmia is generally shallow and has a maximum depth of
only about 10 meters. This shallowness is also reflected by a quite high average area-volume ratio of about 900 km−1 (considering a lake level range of 1267.2–1278.4 m a.s.l.). In
comparison, the Great Lakes in the US having an average area-volume ratio of about 10 km−1 38. In particular in the south, the lake bottom’s marginal planes are flat and have extremely
gentle slopes. On the other hand, the northern part of the lake is slightly deeper (Fig. 4a). This morphology leads to a very non-linear volume- area relationship. A strong reaction of the
lake area on a reduced volume can be observed for a lake volume between 1.3 and about 4 km3, while above and below this volume the reaction is weaker (Fig. 4b). The lower tipping point at
about 1.3 km3 (sharp change in slope, Fig. 4b) is reached when the shallow southern part of the lake falls completely dry. The lake volume has fluctuated just above this tipping point since
2013, where the strongest reaction of the lake area on volume changes can be observed. This may have contributed to the relatively stable lake volume of recent years, although the SPEI index
was negative and despite the growing significance of agricultural water extraction. However, it should be noted that exceeding this tipping point leads to a reduced buffer effect and thus
to a loss in resilience to climatic changes and agricultural water use. To draw some conclusions for Lake Urmia’s future development, we run a series of forward simulations based on the lake
water balance. The forecasting period of these simulations is ten years and six different scenarios are analyzed. First, we distinguish between a best-case, status quo, and worst-case
scenario for the climatic boundary conditions (Fig. 5a–c). These scenarios base on observed mean precipitation, potential evaporation and inflow rates, for the period 3, period 6 and the two
hydrological years from October 1999 to September 2001, respectively (Table 1). Here, the latter one was chosen due to exceptionally low inflow rates and the most severe drop in lake volume
(Fig. 2). In addition, for these three climatic scenarios, we assumed an increased inflow of 1.2 km³a−1 into the lake, due to water savings in the agriculture sector (Fig. 5d–f). This
corresponds to 50% of the surface water extraction for irrigation in 2016, savings that are considered possible in related studies1,28. Our analysis show that for the climatic best-case
scenario, the lake could reach a volume of 15 km3, which corresponds to an area of 4400 km2, already after about three years, even if agricultural withdrawal is not reduced (Fig. 5a,d). The
gain in volume is significantly higher compared to observations in the best-case climatic reference period, due to the initially much smaller lake area, resulting in lower evaporation.
However, the climatic status quo and also the worst-case scenarios are more likely, based on regional climate projections39,40. Here, agricultural water savings would have a significant
impact on the lake volume. While without water savings the lake volume would further shrink (status quo scenario, Fig. 5b) or even dramatically shrink (worst-case scenario, Fig. 5c), a 50%
reduction in withdrawal would lead to a 60% increase in lake volume after four years in the status quo scenario (Fig. 5e), and at least to a more or less constant lake volume, compared to
today, even for the worst-case scenario (Fig. 5f). CONCLUSION We could show that in the last decades variation in the volume of Lake Urmia was mainly triggered by changes in climatic
conditions, and even without agricultural water extraction the general trend of the lake volume variations would have been the same. However, this conclusion does not mean that human
influence on the hydrological system in the Lake Urmia catchment is negligible. Using a parsimonious modeling experiment, we were also able to show that agricultural extraction has a massive
influence on the resilience of the lake, as it exaggerates the general trend of declining lake volume, especially in the last two decades. This means, that without agricultural extraction
the lake volume would also have decreased significantly in the last two decades, but would still have ended up at a much higher volume. Interestingly, the specific morphology of the lake
could, to some extend buffer reduced inflows. However, the current climatic conditions together with the retraction of the lake to its northern and slightly deeper parts brought it into a
very critical and labile state, close to the tipping point where it loses its ability to buffer reduced inflows by a reduced surface area. As agricultural water withdrawals are under the
current climatic conditions comparable to the remaining surface water inflow volumes, or even higher, any changes in water withdrawal would have a significant impact on the lake volume. This
is a risk, as well as an opportunity. Maintaining or even increasing the current extraction rates could result in a complete collapse of the lake, especially if climate would further get
dryer. However, substantial but realistic agricultural water savings could stabilize the lake by keeping the lake volume above the crucial tipping point, bringing therefore back its ability
to buffer, even if climate would get dryer. Considering the current climatic conditions, it could as well lead to a significant volume and surface area increase of the lake, thus regaining
its role as a very precious and special ecosystem. METHODS DATA The lake volume evolution as well as the quantification and further analysis of the different water balance components
(inflow, precipitation, evaporation and change of storage) base on a series of different data sets. These include: (I) mean monthly and annual lake level for the period 1965–2018 and
1931–2017, respectively (Iran Water Resources Management Company); (II) monthly and annual inflow into the lake for the period 1965–2016 and 1953–2017, respectively (Ministry of Energy);
(III) monthly river runoff for a total of 132 gauging stations with records between 1952 and 2016 (Ministry of Energy); (IV) monthly potential evaporation, calculated based on routine
weather data using a simplified version of the Penman equation41, for Tabriz from 1952 to 2017 (Iran Meteorological Organization); (V) monthly precipitation for the stations Tabriz
(1951–2017), Urmia (1951–2017), Sahand (1985–2017), Mahabad (1985–2017) and Miandoab (2002–2017) (Iran Meteorological Organization); (VI) monthly river water extraction for irrigation from
1970 to 2016 (Ministry of Agriculture); (VII) evolution of total area for irrigation agriculture in the Lake Urmia catchment between 1984 and 2016 (Ministry of Agriculture); (VIII)
information about the 41 principal reservoirs in the catchment, i.e. construction date and capacity (Ministry of Energy); (IX) bathymetry of Lake Urmia with a resolution of 30 × 30 m,
surveyed in 2017 by an echo sounding (50–200 kHz) mapping campaign (by the Ministry of Energy’s Water Research Institute on request of Urmia Lake Restauration Program). LEVEL-AREA-VOLUME
RELATIONSHIP The lake area and volume are calculated based on the lake level and the raster data set of the bathymetry. To calculate the area, the number of pixels, which are equal or lower
than the corresponding lake level, is multiplied with the pixel size (900 m2). Subsequently, the mean depth is calculated by subtracting the mean elevation of the pixels, which are equal or
lower than the lake level, from the lake level. Multiplying the mean depth with the area results the lake volume. SALT WATER EVAPORATION Evaporation from saline water bodies depends on
meteorological variables, but also on the salinity and the ionic composition. As the salinity increases, the free energy of the water molecules is reduced, resulting in a decrease in the
saturation vapor pressure above the water surface and thus a decrease in evaporation42,43. Here, the relationship of actual salt water evaporation (Esal) to freshwater evaporation (Efresh)
can be represented by the salinity dependent empirical ratio α42,43, Eq. (2). $$\alpha =\frac{{E}_{sal}}{{E}_{fresh}}$$ (2) Lake Urmia is an endorheic basin and therefore the salt
concentration depends strongly on the lake volume. A linear regression model, based on a number of observations5, explains this dependence of the salinity on the lake volume quite well (Fig.
6a). In order to determine the empirical ratio α, we performed evaporation experiments for eight different salt solutions and a fresh water reference. The ionic composition of the salt
solution used was similar to that of Lake Urmia5 and the initial salt concentrations ranged from 5% to 38%. During the experiment, temperature and relative humidity were kept constant at 30
°C and 20%, respectively, by means of an environmental chamber. The experiment lasted 7 days and each day the evaporation loss was measured gravimetrically. For the expected concentration
range, based on the range of observed volumes (Fig. 6a), a linear regression model is used to describe the relationship between α and salinity (Fig. 6b). Subsequently, actual salt water
evaporation rates for Lake Urmia were estimated by multiplying potential evaporation rates with the corresponding value for α, which was derived from the introduced linear models. It should
be noted that this approach constitutes a simplification. Actually, α not only depends on the salinity, but it is also influenced by meteorological variables. Two studies of Salhotra _et
al_.42,43 have analyzed this influence. They experimentally determined α for a range (n = 24) of different temperatures (16–35 °C) and humidities (29–62%) for three concentrated
Mediterranean Sea water samples with about 5.4%, 20%, and 23.3% salinity. Resulting values for α showed an average standard deviation of 0.06, which could be seen as a first approximation
for the uncertainty of the presented approach. Being aware of the existence of more accurate concepts, we still consider the applied approach appropriate as it does not require additional
and, in our case, not continuously available data such as water temperature and humidity directly above the lake surface. STATISTICS The 12-months standardized precipitation evaporation
index (SPEI)34 and the 12-months standardized runoff index (SRI)35 are calculated individually for all 132 runoff stations44. Here, for the SPEI the closest available weather station, based
on Thiessen polygons, is used. Subsequently, for each month during the test period from 1965 to 2016, the runoff-weighted averages for the indices are calculated (Fig. 3a). In order to
investigate the temporal development of both time series, they are split into the six periods, which characterize the general trends in lake volume evolution (Fig. 2). For each of these
periods and for both indices a seasonal Mann-Kendall test is performed and the Sens slope is calculated45,46. The significance level for the seasonal Mann-Kendall test is 0.01 and the
starting month for the 12-months interval is October (start of the hydrological year). Bootstrap sampling of the slope of the simple linear regression model of the SRI-SPEI relationship for
the six periods is performed with a number of 1000 data samples (Fig. 3c). DATA AVAILABILITY All data used in this study is available from the corresponding author upon reasonable request.
CODE AVAILABILITY Matlab codes are archived at: https://github.com/stephan-schulz-1/urmia.git. REFERENCES * Stone, R. Feature: Saving Iran’s great salt lake. _Science (80-)_.
https://doi.org/10.1126/science.aad1702 (2015). * Eimanifar, A. & Mohebbi, F. Urmia Lake (Northwest Iran): a brief review. _Saline Systems_ 3, 5 (2007). Article Google Scholar *
Kabiri, K., Pradhan, B., Sharifi, A., Ghobadi, Y. & Pirasteh, S. Manifestation of Remotely Sensed Data Coupled With Field Measured Meteorological Data for an Assessment of Degradation of
Urmia Lake, Iran. In _Asia Pacific Conference on Environmental Science and Technology_ 395–401 (2012). * Asem, A., Eimanifar, A., Djamali, M., De los Rios, P. & Wink, M. Biodiversity of
the hypersaline urmia lake national park(NW Iran). _Diversity_ 6 (2014). * Karbassi, A., Bidhendi, G. N., Pejman, A. & Bidhendi, M. E. Environmental impacts of desalination on the
ecology of Lake Urmia. _J. Great Lakes Res._ 36, 419–424 (2010). Article CAS Google Scholar * Sharifi, A., Shah-Hosseini, M., Pourmand, A., Esfahaninejad, M. & Haeri-Ardakani, O. The
Vanishing of Urmia Lake: A Geolimnological Perspective on the Hydrological Imbalance of the World’s Second Largest Hypersaline Lake. In, https://doi.org/10.1007/698_2018_359 (2018). Google
Scholar * Shadkam, S., Ludwig, F., van Oel, P., Kirmit, Ç. & Kabat, P. Impacts of climate change and water resources development on the declining inflow into Iran’s Urmia Lake. _J.
Great Lakes Res._ 42, 942–952 (2016). Article Google Scholar * Alizadeh-Choobari, O., Ahmadi-Givi, F., Mirzaei, N. & Owlad, E. Climate change and anthropogenic impacts on the rapid
shrinkage of Lake Urmia. _Int. J. Climatol._ 36, 4276–4286 (2016). Article Google Scholar * Delju, A. H., Ceylan, A., Piguet, E. & Rebetez, M. Observed climate variability and change
in Urmia Lake Basin, Iran. _Theor. Appl. Climatol._ 111, 285–296 (2013). Article ADS Google Scholar * Tourian, M. J. _et al_. A spaceborne multisensor approach to monitor the desiccation
of Lake Urmia in Iran. _Remote Sens. Environ._ 156, 349–360 (2015). Article ADS Google Scholar * Golabian, H. Urumia Lake: Hydro-Ecological Stabilization and Permanence. In
_Macro-engineering Seawater in Unique Environments_ 365–397, https://doi.org/10.1007/978-3-642-14779-1_18 (2010). Chapter Google Scholar * Wurtsbaugh, W. A. _et al_. Decline of the world’s
saline lakes. _Nat. Geosci._ 10, 816–821 (2017). Article ADS CAS Google Scholar * Agh, N. _et al_. Effects of salinity on survival, growth, reproductive and life span characteristics of
Artemia populations from Urmia Lake and neighboring lagoons. _Pakistan J. Biol. Sci. PJBS_ 11, 164–172 (2008). Article CAS Google Scholar * Alborzi, A. _et al_. Climate-informed
environmental inflows to revive a drying lake facing meteorological and anthropogenic droughts. _Environ. Res. Lett._ 13, 084010 (2018). Article ADS Google Scholar * Chaudhari, S.,
Felfelani, F., Shin, S. & Pokhrel, Y. Climate and anthropogenic contributions to the desiccation of the second largest saline lake in the twentieth century. _J. Hydrol._ 560, 342–353
(2018). Article ADS Google Scholar * Ghale, Y. A. G., Altunkaynak, A. & Unal, A. Investigation Anthropogenic Impacts and Climate Factors on Drying up of Urmia Lake using Water Budget
and Drought Analysis. _Water Resour. Manag._ 32, 325–337 (2018). Article Google Scholar * Hassanzadeh, E., Zarghami, M. & Hassanzadeh, Y. Determining the Main Factors in Declining the
Urmia Lake Level by Using System Dynamics Modeling. _Water Resour. Manag._ 26, 129–145 (2012). Article Google Scholar * Hesami, A. & Amini, A. Changes in irrigated land and
agricultural water use in the Lake Urmia basin. _Lake Reserv. Manag._ 32, 288–296 (2016). Article Google Scholar * Jalili, S., Hamidi, S. A. & Namdar Ghanbari, R. Climate variability
and anthropogenic effects on Lake Urmia water level fluctuations, northwestern Iran. _Hydrol. Sci. J._ 61, 1759–1769 (2016). Google Scholar * Nouri, H., Mason, R. J. & Moradi, N. Land
suitability evaluation for changing spatial organization in Urmia County towards conservation of Urmia Lake. _Appl. Geogr._ 81, 1–12 (2017). Article Google Scholar * AghaKouchak, A. _et
al_. Aral Sea syndrome desiccates Lake Urmia: Call for action. _J. Great Lakes Res._ 41, 307–311 (2015). Article Google Scholar * Khazaei, B. _et al_. Climatic or regionally induced by
humans? Tracing hydro-climatic and land-use changes to better understand the Lake Urmia tragedy. _J. Hydrol._ 569, 203–217 (2019). Article ADS Google Scholar * Zoljoodi, M. &
Didevarasl, A. Water-Level Fluctuations of Urmia Lake: Relationship with the Long-Term Changes of Meteorological Variables (Solutions for Water-Crisis Management in Urmia Lake Basin).
_Atmos. Clim. Sci._ 04, 358–368 (2014). Google Scholar * Simonovic, S. P. _Managing Water Resources - Methods and Tools for a Systems Approach_. (UNESCO, 2009). * Arkian, F., Nicholson, S.
E. & Ziaie, B. Meteorological factors affecting the sudden decline in Lake Urmia’s water level. _Theor. Appl. Climatol._ 131, 641–651 (2018). Article ADS Google Scholar * Fathian, F.,
Morid, S. & Kahya, E. Identification of trends in hydrological and climatic variables in Urmia Lake basin, Iran. _Theor. Appl. Climatol._ 119, 443–464 (2014). Article ADS Google
Scholar * Malekian, A. & Kazemzadeh, M. Spatio-temporal analysis of regional trends and shift changes of autocorrelated temperature series in Urmia Lake basin. _Water Resour. Manag._
30, 785–803 (2016). Article Google Scholar * Mostafa, H., El-Nady, R., Awad, M. & El-Ansary, M. Drip irrigation management for wheat under clay soil in arid conditions. _Ecol. Eng._
121, 35–43 (2018). Article Google Scholar * JICA. _Data collection survey on hydrological cycle of Lake Urmia basin in the Islamic Republic of Iran_. (2016). * Amiri, V., Nakhaei, M., Lak,
R. & Kholghi, M. Investigating the salinization and freshening processes of coastal groundwater resources in Urmia aquifer, NW Iran. _Environ. Monit. Assess._ 188, 233 (2016). Article
Google Scholar * Hashemi, M. A Socio-technical Assessment Framework for Integrated Water Resources Management (IWRM) in Lake Urmia Basin, Iran. (Newcastle University, 2012). * UNDP &
DoE. _An Independent Review: The Status of Water Resources in the Lake Urmia Basin_. (2008). * Vaheddoost, B. & Aksoy, H. Interaction of groundwater with Lake Urmia in Iran. _Hydrol.
Process_., https://doi.org/10.1002/hyp.13263 (2018). * Vicente-Serrano, S. M., Beguería, S. & López-Moreno, J. I. A Multiscalar Drought Index Sensitive to Global Warming: The
Standardized Precipitation Evapotranspiration Index. _J. Clim._ 23, 1696–1718 (2010). Article ADS Google Scholar * Shukla, S. & Wood, A. W. Use of a standardized runoff index for
characterizing hydrologic drought. _Geophys. Res. Lett._ 35, L02405 (2008). Article ADS Google Scholar * Döll, P., Fiedler, K. & Zhang, J. Global-scale analysis of river flow
alterations due to water withdrawals and reservoirs. _Hydrol. Earth Syst. Sci._ 13, 2413–2432 (2009). Article ADS Google Scholar * Modares, N. F. The role of climate and land use change
in Lake Urmia desiccation. (University of Oulu, 2018). * Tilzer, M. M. & Serruya, C. _Large Lakes - Ecological Structure and Function_., https://doi.org/10.1007/978-3-642-84077-7
(Springer Berlin Heidelberg, 1990). Google Scholar * Ashraf, S. _et al_. Compounding effects of human activities and climatic changes on surface water availability in Iran. _Clim. Change_
152, 379–391 (2019). Article ADS Google Scholar * IPCC. _Climate Change 2014: Synthesis Report. Contribution of Working Groups I, II and III to the Fifth Assessment Report of the
Intergovernmental Panel on Climate Change_. (2014). * Valiantzas, J. D. Simplified versions for the Penman evaporation equation using routine weather data. _J. Hydrol._ 331, 690–702 (2006).
Article ADS Google Scholar * Salhotra, A. M., Adams, E. E. & Harleman, D. R. F. Effect of Salinity and Ionic Composition on Evaporation: Analysis of Dead Sea Evaporation Pans. _Water
Resour. Res._ 21, 1336–1344 (1985). Article ADS CAS Google Scholar * Salhotra, A. M., Adams, E. E. & Harleman, D. R. F. The alpha, beta, gamma of evaporation from saline water
bodies. _Water Resour. Res._ 23, 1769–1774 (1987). Article ADS CAS Google Scholar * AghaKouchak, A. Standardized Drought Analysis Toolbox (SDAT). (2015). * Hirsch, R. M. & Slack, J.
R. A Nonparametric Trend Test for Seasonal Data With Serial Dependence. _Water Resour. Res._ 20, 727–732 (1984). Article ADS Google Scholar * Burkey, J. Seasonal Kendall Test with Slope
for Serial Dependent Data. (2012). Download references AUTHOR INFORMATION AUTHORS AND AFFILIATIONS * Technische Universität Darmstadt, Institute of Applied Geosciences, Schnittspahnstr. 9,
64287, Darmstadt, Germany Stephan Schulz, Sahand Darehshouri & Christoph Schüth * Polytechnique Montréal – Department of Civil, Geological and Mining Engineering, Montreal, Canada Elmira
Hassanzadeh * Sharif University of Technology, Urmia Lake Restoration Program, Department of Civil Engineering, Azadi Ave, P.O.Box: 11155, 9313, Tehran, Iran Massoud Tajrishy Authors *
Stephan Schulz View author publications You can also search for this author inPubMed Google Scholar * Sahand Darehshouri View author publications You can also search for this author inPubMed
Google Scholar * Elmira Hassanzadeh View author publications You can also search for this author inPubMed Google Scholar * Massoud Tajrishy View author publications You can also search for
this author inPubMed Google Scholar * Christoph Schüth View author publications You can also search for this author inPubMed Google Scholar CONTRIBUTIONS S.S., S.D. and C.S. designed the
research; S.S. performed the data analysis; S.D. performed the evaporation experiment; S.D., E.H. and M.T. provided/gathered the data; S.S., S.D., E.H. and C.S. wrote the paper. All authors
reviewed the manuscript. CORRESPONDING AUTHOR Correspondence to Stephan Schulz. ETHICS DECLARATIONS COMPETING INTERESTS The authors declare no competing interests. ADDITIONAL INFORMATION
PUBLISHER’S NOTE Springer Nature remains neutral with regard to jurisdictional claims in published maps and institutional affiliations. SUPPLEMENTARY INFORMATION SUPPLEMENTARY INFORMATION.
RIGHTS AND PERMISSIONS OPEN ACCESS This article is licensed under a Creative Commons Attribution 4.0 International License, which permits use, sharing, adaptation, distribution and
reproduction in any medium or format, as long as you give appropriate credit to the original author(s) and the source, provide a link to the Creative Commons license, and indicate if changes
were made. The images or other third party material in this article are included in the article’s Creative Commons license, unless indicated otherwise in a credit line to the material. If
material is not included in the article’s Creative Commons license and your intended use is not permitted by statutory regulation or exceeds the permitted use, you will need to obtain
permission directly from the copyright holder. To view a copy of this license, visit http://creativecommons.org/licenses/by/4.0/. Reprints and permissions ABOUT THIS ARTICLE CITE THIS
ARTICLE Schulz, S., Darehshouri, S., Hassanzadeh, E. _et al._ Climate change or irrigated agriculture – what drives the water level decline of Lake Urmia. _Sci Rep_ 10, 236 (2020).
https://doi.org/10.1038/s41598-019-57150-y Download citation * Received: 29 October 2019 * Accepted: 24 December 2019 * Published: 14 January 2020 * DOI:
https://doi.org/10.1038/s41598-019-57150-y SHARE THIS ARTICLE Anyone you share the following link with will be able to read this content: Get shareable link Sorry, a shareable link is not
currently available for this article. Copy to clipboard Provided by the Springer Nature SharedIt content-sharing initiative