Play all audios:
Training of one limb improves performance of the contralateral, untrained limb, a phenomenon known as cross transfer. It has been used for rehabilitation interventions, i.e. mirror therapy,
in people with neurologic disorders. However, it remains unknown whether training of the upper limb can induce the cross-transfer effect to the trunk muscles. Using transcranial magnetic
stimulation over the primary motor cortex (M1) we examined motor evoked potentials (MEPs) in the contralateral erector spinae (ES) muscle before and after 30 min of unilateral arm cycling in
healthy volunteers. ES MEPs were increased after the arm cycling. To understand the origin of this facilitatory effect, we examined short-interval intracrotical inhibition (SICI) and
cervicomedullary MEPs (CMEPs) in neural populations controlling in the ES muscle. Notably, SICI reduced after the arm cycling, while CMEPs remained the same. Using bilateral transcranial
direct current stimulation (tDCS) in conjunction with 20 min of the arm cycling, the amplitude of ES MEPs increased to a similar extent as with 30 min of the arm cycling alone. These
findings demonstrate that a single session of unilateral arm cycling induces short-term plasticity in corticospinal projections to the trunk muscle in healthy humans. The changes are likely
driven by cortical mechanisms.
Training of one limb through task repetition improves the performance with the contralateral, untrained limb9,10,11,12, a phenomenon known as cross transfer. For instance, increased peak
acceleration was observed in both left and right hands performing index finger abduction after the unilateral training of the finger abduction of the right hand10,13. The mechanisms
contributing to the cross transfer between the upper limbs are likely from bilateral interactions of the primary motor cortices (M1s)14. Previous work has shown a decrease in
interhemispheric inhibition from the trained M1 to the untrained M1 after the unilateral training15. Furthermore, research using transcranial direct current stimulation (tDCS) over the M1
contralateral to the untrained muscle demonstrated enhancement of the cross-transfer effect in the untrained muscle further supporting this cortical mechanism9,16,17. Growing evidence
suggests that the physiological pathways modulating upper-limb and trunk muscles interact3,18,19,20. However, it remains unclear whether training of the arms can induce plasticity in the
neural pathways projecting to the trunk muscles, resulting in improved trunk function. Research has shown that reductions in GABAa-mediated intracortical inhibition, i.e. short-interval
intracortical inhibition (SICI), contributing to plasticity in the M1s are related to the cross-transfer effect and motor skill acquisition21,22. Our previous study found that voluntary
contractions of biceps brachii (BB) and triceps brachii (TB) reduced SICI and increased corticospinal drive to the erector spinae (ES) muscle in the lower thoracic region19. This highlights
the potential of improving performance of the ES muscle by employing arm movement. Since many patients with neurologic disorders, such as stroke23 and spinal cord injury24, have impaired
trunk control, understanding if arm-training can influence function of the trunk muscles will lead to development of interventions for trunk rehabilitation. For instance, arm ergometer
exercise requires minimal supervision and inexpensive equipment, therefore providing a suitable patient-led rehabilitation technique in the community.
Previous studies have shown changes in M1 excitability projecting to a trunk muscle that is not primarily involved in upper-limb movements. For example, interhemispheric inhibition is
present in the ES muscle located at the first lumbar vertebra during voluntary contractions of anterior deltoid (AD)25. In addition, studies have shown the contribution of the M1 to postural
adjustments of the ES muscles located at the lower thoracic region during bilateral shoulder movements3,26. Thus, we hypothesised that arm training increases corticospinal projections to
the trunk muscles, which are not the prime movers used in the training, and the mechanisms are likely involved cortical circuits within the M1. To test this hypothesis, we examined
corticospinal excitability, intracortical inhibition and spinal excitability in the ES muscle using TMS and electrical stimulation prior to and following unilateral arm cycling (Fig. 1).
Based on previous studies using tDCS to examine cortical mechanisms, we also tested the effect of combined bilateral tDCS and the arm cycling on changes in the size of ES MEP in healthy
participants.
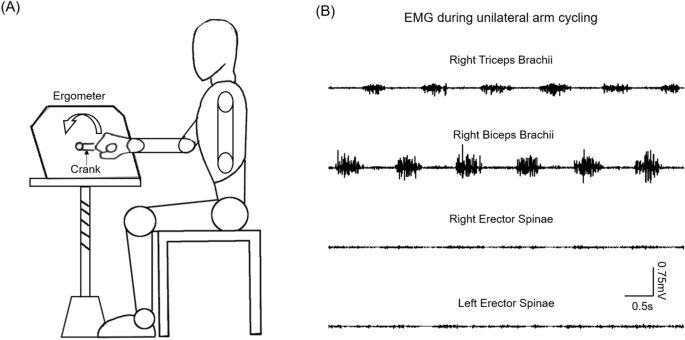
Experimental setup. (A) Schematic illustration of the setup of unilateral arm cycling. (B) Raw electromyography (EMG) activity recorded from biceps brachii and triceps brachii muscles of the
dominant arm performing the arm cycling, and from bilateral erector spinae muscles.
Figure 2A illustrates traces of averaged MEPs in the ES muscle from a representative participant. Note that the size of MEP in the ES muscle increased after the arm cycling for up to 20 min.
Results demonstrated an effect of TIME on the size of MEP in the ES muscle (F3,42 = 6.18; p = 0.001; n = 15). Post hoc tests showed that the amplitude of ES MEP increased at 10 min (125.85
± 21.60% baseline MEP; p = 0.04), and 20 min (147.12 ± 51.21%; p = 0.001) following the arm cycling compared with baseline (Fig. 2B). There was no difference in the size of ES MEP between 10
and 20 min after the cycling (p = 0.23). Note that majority of participants show increased MEPs in ES at 10 and 20 min after the cessation of the arm cycling compared with baseline (Fig.
2C). There was no difference in ES MEP at 30 min after the arm cycling (120.40 ± 37.29%; p = 0.104) compared with baseline. There was no difference in background EMG in ES across all time
points (F4,42 = 2.16; p = 0.12).
Motor evoked potentials (MEPs) in the erector spinae (ES) muscle. (A) MEP traces recorded from the ES muscle of a representative participant. Traces show the average of 10 MEPs in the ES
muscle before (grey graces) and after (black traces) 30 min of unilateral arm cycling. (B) Group data (n = 15) showing ES MEPs after the arm cycling. The abscissa shows the time points
measured after cessation of the arm cycling and the ordinate shows the size of ES MEP (as a % of the ES MEP obtained prior to the arm cycling, called baseline). The horizontal dashed line
represents the size of the ES MEP at baseline. Note that the size of ES MEP increases at 10 and 20 min after the arm cycling compared with baseline and returns to the same as baseline at 30
min after the arm cycling. (C) Individual data showing that majority of participants demonstrate increases in ES MEP at 10 and 20 min after cessation of the arm cycling. Error bars indicate
the standard error of the mean (SEM). *p