Play all audios:
ABSTRACT We report for the first time the use of experimental electron density (ED) as training data for the generation of drug-like three-dimensional molecules based on the structure of a
target protein pocket. Similar to a structural biologist building molecules based on their ED, our model functions with two main components: a generative adversarial network (GAN) to
generate the ligand ED in the input pocket and an ED interpretation module for molecule generation. The model was tested on three targets: a kinase (hematopoietic progenitor kinase 1),
protease (SARS‐CoV‐2 main protease), and nuclear receptor (vitamin D receptor), and evaluated with a reference dataset composed of over 8000 compounds that have their activities reported in
the literature. The evaluation considered the chemical validity, chemical space distribution-based diversity, and similarity with reference active compounds concerning the molecular
structure and pocket-binding mode. Our model can generate molecules with similar structures to classical active compounds and novel compounds sharing similar binding modes with active
compounds, making it a promising tool for library generation supporting high-throughput virtual screening. The ligand ED generated can also be used to support fragment-based drug design. Our
model is available as an online service to academic users via https://edmg.stonewise.cn/#/create. SIMILAR CONTENT BEING VIEWED BY OTHERS A STRUCTURE-BASED FRAMEWORK FOR SELECTIVE INHIBITOR
DESIGN AND OPTIMIZATION Article Open access 12 March 2025 DEEP LEAD OPTIMIZATION ENVELOPED IN PROTEIN POCKET AND ITS APPLICATION IN DESIGNING POTENT AND SELECTIVE LIGANDS TARGETING LTK
PROTEIN Article 20 February 2025 A DUAL DIFFUSION MODEL ENABLES 3D MOLECULE GENERATION AND LEAD OPTIMIZATION BASED ON TARGET POCKETS Article Open access 26 March 2024 INTRODUCTION Molecular
generative models using the three-dimensional (3D) information of target pockets have garnered increasing attention in the field of de novo drug design1,2,3. The process of drug design is
generally perceived as an inherently multi-constrained optimization process. The major constraints include complementarity between the ligand and protein, regarding multiple aspects, such as
shape and non-covalent interactions (NCI), and requirements of the ligand itself, including synthesizability and low strain energy binding conformation. Therefore, efficiently maintaining
these constraints during the training of the molecular generative model is subject to intensive discussions. Some representative attempts include the following: (1) using autoregressive
algorithms or introducing conditional tokens in the training process for models generating molecules in a sequential manner4; (2) leveraging generative adversarial networks (GAN) and
reinforcement learning to reflect the desired bias in the output distribution5,6; (3) employing Bayesian optimization for the search of appropriate regions in the latent space from trained
models such as variational autoencoder (VAE)7. These approaches all possess delicately designed architecture and have accomplished great achievements by working in an end-to-end manner in
the fields of machine translation, games, and image processing. However, when applied to molecule generation for drug design, additional challenges arise, including an increased number of
constraints and the lack of data. As a result, the application of end-to-end design that intends to satisfy all the constraints at one stroke by using massive amounts of training data is not
as effective as in other fields. Therefore, researchers pursue solutions in two directions: (1) reducing the constraints by generating non-3D molecules, in which the molecules are
represented as strings (i.e. SMILES) or graphs8,9,10; (2) expanding the dataset, for example, by generating ligand–protein complex data using docking approaches11. Although these attempts
are inspiring, a groundbreaking strategy that can pour additional experimental data in the models is still absent. The current data expansion approaches are based on calculations heavily
relying on computer-aided drug design (CADD) theory. This promotes artificial intelligence (AI) models learning from well-established rules instead of “real world” information. There are
over 120,000 high quality experimental electron density (ED) maps accumulated globally in the Protein Data Bank (PDB)12 over the past 60 years. However, only part of the information in these
experimental EDs is used for the determination of atom coordinates, whereas other information reflecting NCI13, time-averaged conformational change14,15, and solvent distribution16 remains
untapped. In addition to being considered as data source, ED is also an ideal representation for molecules because it naturally reflects the physical and chemical properties of a molecule.
Specifically, the ED intensity isosurface describes the shape of a molecule; electron localization function (ELF)17 describes the bond properties; and ED topology, such as saddle points,
indicates the NCI between molecules13. Therefore, compared to the traditional 3D molecule representations including the node-edge based representation18,19 and dot-cloud-based representation
such as Gaussian filtering20 and van der Waals radius21, there is no need for ED to involve multiple channels to enhance the representation of physical and chemical properties, thereby
avoiding the data sparsity problem. Furthermore, ED is continuously smoothing and compatible with convolutional neural networks (CNN). Based on the forementioned reasons, we used ED as
molecule representation and introduced experimental ED as training data in this work. Our model was trained to first generate ED from the pocket and then interpret the generated ED into
molecules. We evaluated our model using classical CADD indicators, such as the quantitative estimate of drug-likeness (QED)22 and synthetic accessibility score (SAS)23, to test the molecular
validity. Additionally, we employed a set of more intuitive indicators to test whether our model could generate novel compounds with similar binding modes to active compounds: (1) the
generation of compounds with reasonable diversity reflected by their distribution in chemical space; and (2) the generation of novel molecules sharing similar binding modes with the
classical active compounds. We also demonstrated the superiority of our model to a state-of-art 3D molecule generative model by testing them on three targets including hematopoietic
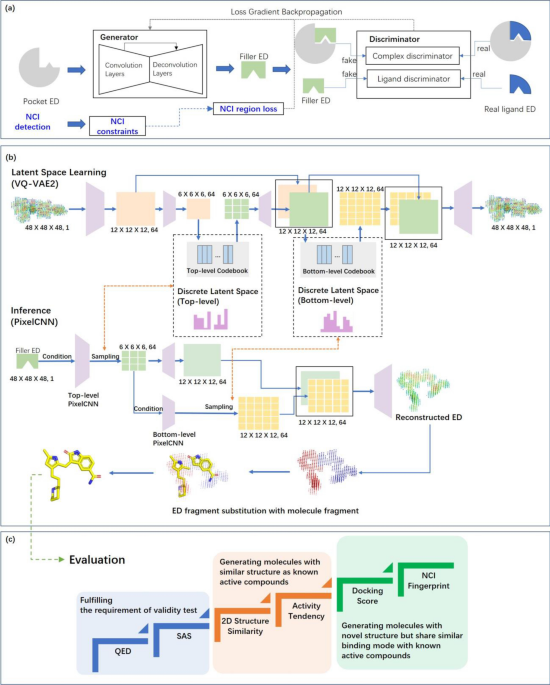
progenitor kinase 1 (HPK1), SARS‐CoV‐2 main protease (3CLpro), and vitamin D receptor (VDR). RESULTS MODEL DESIGN We trained our model to learn constraints and generate molecules in three
major steps. Initially, a GAN was used to take the ED of a pocket as input to learn pocket-ligand complementarity and generate the ligand ED (Fig. 1a). We termed the generated ligand ED at
this step as “filler ED” in this study. Subsequently, an ED interpretation module powered by vector quantized variational autoencoder (VQ-VAE2)24 was used to learn constraints on ligand
validity and compress them in latent spaces. Then, PixelCNN25 was used to balance the complementary and molecular validity by sampling in the latent space using filler ED as conditions and
thereby generate reconstructed ED (Fig. 1b). Such sampling process may produce multiple reconstructed EDs and thus achieve diversity. Next, reconstructed EDs were fragmented and thereby
substituted with molecule fragments to generate final molecules. Experimental EDs were used to train the GAN, and quantum mechanics (QM) based computational ED as well as force field based
molecular conformations were used to train VQ-VAE2 and PixelCNN. To assure the efficiency of retaining constraints during the training of GAN, we increased the weight of the region where the
ligand and pocket show NCI. Details of the model design are provided in “Methods” section. To demonstrate the working process of our model, we applied the model to a kinase target, HPK1.
The complex structure of HPK1 binding with a reference ligand (PDB:7KAC; Fig. 2a) was used as a starting point. The pocket was defined as the residues within 5 Å from the reference ligand.
Using experimental ED at a resolution of 2.5 Å for the pocket as input (Fig. 2b), the filler ED was generated as shown in Fig. 2c. Interestingly, the generated filler ED replaced the region
originally occupied by water molecules and covered the unoccupied cavities (indicated with red arrows in Fig. 2c), demonstrating the complementarity of the generated filler ED to the pocket.
Then, the generated filler ED was converted into several reconstructed EDs (Fig. 2d). For each reconstructed ED, a map skeleton was recognized to assist the fragmentation of reconstructed
ED and the subsequent substitution of ED fragments with molecule fragments. For a kinase target, it is not a surprise to observe that the classical hinge binding groups could be well fitted
into the reconstructed EDs (Fig. 2e). Finally, the molecular fragments were connected to create intact molecules (Fig. 2f,g). In the above process, the diversity of generated molecules could
be achieved during reconstructed ED sampling and ED fragment substitution. On average, to generate one million molecules, over 2000 reconstructed EDs need to be sampled using the filler ED
generated based on the pocket. MODEL EVALUATION As shown in Fig. 1c, our molecule generative model was evaluated from three perspectives: (1) the ability to generate valid molecules in terms
of QED and SAS while maintaining a reasonable diversity; (2) the ability to generate molecules similar to classical active compounds, defined as generation of molecules with over 0.5
Tanimoto similarity8,26 with the reference active compounds; (3) the ability to generate novel binders, defined as the generation of molecules with novel scaffolds relative to the reference
active compounds but possessing similar binding modes. We selected three targets including HPK1 (PDB: 7KAC), 3CLpro (PDB:7VU6), and VDR (PDB: 1S19), to test the performance of our model.
They were selected as representatives of kinase, protease, and nuclear receptors. Regarding references (Supporting information Table S1), 6334, 1101, and 757 compounds with reported activity
were used for HPK1, 3CLpro, and VDR, respectively (Supplementary material 1). In addition, a state-of-art 3D molecule generative model27 reported in NeurIPS 2021 was used as a comparison
benchmark. VALIDITY TEST We generated 10,000 molecules for each of the three targets using our model and the benchmark model and compared the QED and SAS of the generated molecules. To make
the comparison results easy to understand, we also calculated the QED and SAS of the reference compounds and used them as positive controls. As shown in Table 1, although both our model and
the benchmark model performed well for QED, our model outperformed the benchmark model on SAS. CHEMICAL SPACE DISTRIBUTION To understand the diversity and novelty of the molecules generated
by our model, we calculated the Tanimoto-similarity-based diversity and compared the scaffold similarity of generated molecules with reference compounds. As shown in Table S2 and Figure S1
(Supporting information), the molecules generated by the benchmark model exhibit higher diversity and novelty than those generated by our model. However, such general diversity and novelty
are not suitable for the evaluation of molecules generated with constraints, because well-functioning constraints may reduce the general diversity and novelty. To perform a comprehensive
evaluation, we referred to the small-molecule-universe representative universal library (SMU-RUL) chemical space28, a self-organizing-map (SOM)-supported chemical space used to describe the
distribution of molecules with molecular weight less than 500 Da. To simplify the comparison results, samples from PubChem were used to represent molecules lacking target-specific
constraints, and active reference compounds were used to represent molecules with tight constraints. As shown in Fig. 3, we observed that our model achieved a better balance between the
diversity and novelty and the constraints than the benchmark model (i.e., the molecules generated by our model are concentrated towards the region where the active compounds are positioned,
whereas the molecules of the benchmark model are distracted toward some other regions and thus appear more diverse). GENERATION OF MOLECULES SIMILAR TO CLASSICAL ACTIVE COMPOUNDS To test
whether our molecular generative model can generate molecules with structures similar to already known active compounds, one million molecules were generated for each of the three targets
and compared to reference compounds by measuring the Tanimoto similarity of the ECFP4 fingerprint. In this study, a molecule with over 0.5 Tanimoto similarity against a reference compound
was considered a similar molecule to this reference compound. Our model successfully generated molecules similar to reference compounds for all three targets (Supplementary material 2).
Taking HPK1 as an example, some reference compounds and their generated counterparts are listed in Fig. 4. Furthermore, when we sorted reference compounds by their activity, we observed that
our model tended to generate molecules with higher similarity to active and medium-active rather than inactive compounds, for all three targets (Table 2). Apart from the similarity trend,
our model also generated more molecules similar to active and medium-active compounds than to inactive ones for HPK1 and 3CLpro. Regarding the comparison with the benchmark model which
failed to generate million-level molecules within a reasonable time frame (Supporting information Table S3), it would be unfair to use all the 1 million molecules generated by our model.
Therefore, our molecules that were subjected to the comparison were randomly selected from the 1 million previously generated to match the capacity of the benchmark model. As shown in Table
S4 (Supporting information), although neither of the two models generated molecules similar to active reference compounds under the condition that only tens of thousands of molecules were
generated, our model still provided molecules with better Tanimoto similarity to the references than the benchmark model did. GENERATION OF NOVEL COMPOUNDS POSSESSING SIMILAR BINDING MODES
AS ACTIVE COMPOUNDS If a molecule generative model can only generate classical active compounds, it will not be attractive to researchers searching for new drugs. To test our model’s ability
to generate active compounds with novel structures, we searched the generated library for the molecules exhibiting a < 0.5 Tanimoto similarity with reference compounds while sharing a
similar binding mode. Taking HPK1 as an example, 2769 HPK1 reference compounds with reported Ki or Kd were selected and docked into the 7KAC pocket by using Glide SP29,30 to provide a
background for binding mode analysis. This is because the binding mode is more theoretically related to Ki and Kd than to EC50 or IC50. However, as shown in Fig. 5a, the Glide score could
not efficiently distinguish the reference compounds with different activities, which implies the need for a more powerful descriptor of binding mode. Thus, we referred to NCI fingerprints
depicted using the independent gradient model (IGM) method31. The IGM method calculates NCIs by analyzing the topological properties of EDs, and thus can provide a full spectrum of NCIs13,
whereas the traditional rule-based method only provides a short list of classical NCIs. Compound clustering based on the NCI fingerprint was conducted using T-distributed stochastic neighbor
embedding (t-SNE)32. As shown in Fig. 5b, the clustering results aligned quite well with the activity: compounds sorted into one cluster tended to possess similar activities despite the low
discriminative capability for samples with very high activity (separating compounds below 1 nM from those below 10 nM). To analyze the binding mode of molecules generated for HPK1, we
randomly selected 10,000 generated molecules with < 0.5 Tanimoto similarity against the reference compounds and then scored them using Glide by only employing the minimization and scoring
functions. This operation was conducted for both our model and the benchmark model. Similarly to the reference compounds, the Glide score was unable to efficiently distinguish between the
performances of our model and the benchmark model (Fig. 5a). Therefore, we randomly selected 200 molecules from each of the two models and conducted NCI fingerprint clustering. As shown in
Fig. 5b, the molecules generated by the benchmark model tended to be more concentrated and farther from the cluster of active compounds than those generated by our model. Molecules at
different positions on the NCI fingerprint map are listed in Fig. 5c,d, and their NCI fingerprints are provided in Fig. S2 (Supporting information). The hinge region-related NCIs, which are
considered crucial for active compounds, were exhibited for molecules generated close to the cluster of active compounds. These NCIs were weak for molecules far from the clusters, such as
#2-BM and #3-BM. Although there were cases (#4-BM and #5-ours) where the molecule from our model was close to the benchmark model molecule in the NCI fingerprint map, and both of them were
close to the cluster of active compounds, our molecules are still easily distinguished for their superior synthetic accessibility. DISCUSSION Our model is designed under the principle of
learning constraints in separated phases: in phase I, less abundant experimental ED data supports the GAN to learn pocket-ligand complementarity, which is reflected by filler ED; in phase
II, relatively abundant computational data support the VQ-VAE2 to learn the constraints on molecule validity, which is reflected by latent space. To balance the constraints learned in
different phases, an autoregressive sampling process (i.e., PixelCNN) is designed, in which phase I generated filler ED is used as conditions to sample in phase II generated latent space.
Such sampling has the additional advantage of diversifying the generated molecules. In summary, because an optimal filler fulfilling all the NCIs with a pocket may not exist as a valid
druglike molecule, the above design makes it possible to first focus the use of high-value experimental data in a single task and then balance the constraints learned from different tasks.
However, the above design also raises additional challenges, such as the evaluation of ED and the efficiency of inheriting constraints such as NCI in different tasks. To address these
challenges, we again refer to the concept of “map skeleton” which is previously used to assist the fragmentation of reconstrued ED. Because one reconstructed ED has only one map skeleton and
the nodes of a map skeleton represent the most possible positions where atoms locate, whether a map skeleton of an ED is druglike and capable of forming NCI indicate the quality of that ED.
Specifically, the following indices can be used for ED quality evaluation: (1) what percentage of contacts between filler ED and solvent accessible hetero atoms (SAHA) of the pocket is
retained in reconstructed EDs and map skeletons; (2) whether a map skeleton can be interpreted into valid SMILES; (3) whether a map skeleton contains rings. Taking 2500 reconstructed EDs
generated by our model as example, the reconstructed EDs and map skeletons retain around 100% (e.g., 82%/82% for HPK1) and 70% (e.g., 59%/82% for HPK1) of the contacts between filler ED and
pocket SAHA (Supporting information Fig. S3), respectively. To check from the perspective of drug likeness, 97% and 80% of the reconstructed EDs have map skeletons with at least one ring and
as valid SMILES, respectively. To further improve the performance of our model, there are two major points under consideration. First, we are considering the use of multi-resolution ED for
the GAN training. Currently, the pockets used for training were represented as ED at a resolution of 2.5 Å, and therefore, some of the PDB entries with a resolution higher than 2.5 Å had
their data at high-resolution shells unused. One possible method for utilizing these valuable data is to create multiple channels for different resolutions. However, one must strike a
balance between creating multiple channels and avoiding the data sparsity problem for high-resolution channels receiving PDB entries with low-resolution data. Second, the fragment
substitution approach employed in this study is to demonstrate the ED-based idea and thus has a relatively simplified design whose performance is highly related to the quality of the
fragment library. To upgrade the approach, we can train a clustering model to cut the ED into more fragments with smaller size than the current approach does. Doing so will reduce the size
of the fragment library to be searched, as the number of conformations decreases sharply along with the shrink of the size of molecule fragments. In addition, we are considering expending
the training set of VQ-VAE2 to cover all eight million molecules in SMU-RUL and more molecules from PubChem. Doing so will improve the quality of latent space and reconstructed ED so that
the subsequent V-Net may directly produce high-quality molecules instead of map skeletons, making the fragments assembling unnecessary. Another approach worth trying is to generate a caption
in the format of SMILES that best describes the reconstructed ED. Then, the generated SMILES can be fitted in the reconstructed ED to get 3D conformation. Another point that should be
considered is how to use our model in a scenario in which there is no experimental ED data as input. Such a scenario could occur when the generative model is used for a pocket provided by a
molecular dynamic approach. Our model, although trained using experimental ED data as input, also works when using a calculated Fourier synthesis-based ED map as input. Specifically, one
only needs to add reasonable B factors (e.g., 20 with a Gaussian perturbation) for each atom and then calculate the ED map using the Fourier synthesis. Furthermore, the application of our
molecule generative model to the representative conformations obtained from molecular dynamics may provide potential solutions for some challenging tasks. First, it is possible to remove the
bias introduced by using only one conformation of the pocket. We can generate molecules for all the representative conformations and all the available experimental EDs for the pocket (if
any), and then combine the generated molecules to compile the library. Second, it is possible to support cosolvent MD simulations (CMD) in the study of allosteric pockets and hidden
pockets34,35. Because such pockets usually require the presence of a ligand to open from an apo state, the incorporation of the right cosolvents is highly associated with the success of
sampling the open state. Usually, general probes such as benzene and isopropanol are used as probes34. With our model, specific probes can be generated for the cavity of interest. In
addition, if the cavity exhibits conformational changes after the probe binds to it during CMD, we can use the new conformation of the cavity to generate new probes. Another potential use of
our model is the detection of small molecule binding regions for protein–protein interaction (PPI) interfaces. Because an electron density map can represent the physical and chemical
properties of the molecule and is continuously smoothing, it can fully utilize the potential of CNN in representing the local environment. Specifically, although we did not train our model
with PPI samples, our model can still recognize the “pocket-like” region in PPI interfaces and generate fragment-sized molecules (Supporting information Figure S5). METHODS MOLECULE DESIGN
LIGAND ED GENERATIVE MODEL As show in Fig. 1a, the pocket EDs were input into a V-Net 3D image generation network, which acts as a generator. In addition to the generator, two
discriminators, called complex and ligand discriminators, were designed. The complex discriminator was responsible for examining the level of complementarity between the ligand and the
pocket, and the ligand discriminator was responsible for verifying ED validity from the perspectives of gradient and connectivity. The protein-ligand pairs used to train the filler ED
generative model were from the PDBbind database36. In total, 27,006 ligand-protein pairs were extracted from 12,905 complexes. The number of the ligand-protein pairs was larger than that of
the complexes because we included drug-like molecules as well as other binders with molecular weight less than 600, such as ATP, ADP, and sugars. To avoid the appearance of similar pockets
in both the training and the testing sets, training-testing split was done by referring to the pocket classification from previous studies focusing on the 1D and 3D pocket similarity11,37.
The key NCIs identified using a previously reported method13 were also included in the model during training with the purpose of making the network more attentive on the NCI related regions.
Smooth L1 loss was performed separately to strengthen the loss of the NCI related regions. The GAN and its loss were expressed using the following equations:
$${G}^{*}=argmi{n}_{G}ma{x}_{D}\left({L}_{cGAN}\left(G,{D}_{complex}\right)+\alpha {L}_{GAN}\left(G,{D}_{ligand}\right)\right)+\lambda L\left(G\right)$$ (1)
$${L}_{cGAN}\left(G,{D}_{complex}\right)={\mathbb{E}}_{x,y}\left[log{
D}_{complex}\left(x,y\right)\right]+{\mathbb{E}}_{x,y}\left[\mathrm{log}\left(1-{D}_{complex}\left(x,G\left(x\right)\right)\right)\right]$$ (2)
$${L}_{GAN}\left(G,{D}_{ligand}\right)={\mathbb{E}}_{x,y}\left[log{
D}_{ligand}\left(x,y\right)\right]+{\mathbb{E}}_{x,y}\left[\mathrm{log}\left(1-{D}_{ligand}\left(G\left(x\right)\right)\right)\right]$$ (3) $$L\left(G\right)= \beta {L}_{gen}+\gamma
{L}_{ligand}+ \varepsilon {L}_{NCI}+\delta {(L}_{tv1}+ {L}_{tv2})$$ (4) where _D__complex_ represents the complex discriminator, and _D__ligand_ represents the ligand discriminator. _L(G)_
indicates the regression loss of GAN, _x_ represents the input pocket_, y_ represents the ground truth ligand, and _α_, _λ_, _β_, _γ_, _ε_, \(\delta\) are hyper parameters. _L__tv1_ and
_L__tv2_ are used to measure the similarity of two EDs from the perspectives of the first and second orders derivative of intensity, respectively. The addition of _D__ligand_ and the
incorporation of _L__tv1_ and _L__tv2_ in _L_(_G_) are to ensure the learning of ED topology properties which reflect not only the geometrical information such as molecule shape but also
chemical information such as atom type. The components of _L_(_G_) are defined as follows: $$\mathrm{SmoothL}1=\left\{\begin{array}{l}0.5{\mathrm{x}}^{2},\quad if
\left|\mathrm{x}\right|<1\\ \left|\mathrm{x}\right|-0.5,\quad otherwise\end{array}\right.$$ (5) $${L}_{gen}=\frac{1}{{N}_{I}}\sum_{\mathrm{i}\in
\mathrm{I}}\mathrm{SmoothL}1({G(x)}_{i}-{y}_{i})$$ (6) where _I_ indicates the entire region, and _N__I_ indicates the number of elements in \(I\).
$${L}_{ligand}=\frac{1}{{N}_{Gt}}\sum_{\mathrm{i}\in \mathrm{Gt}}\mathrm{SmoothL}1({G(x)}_{i}-{y}_{i})$$ (7) where _Gt_ indicates the region covered by the ground truth, and _N__Gt_
indicates the number of elements in _Gt_ $${L}_{NCI}=\frac{1}{{N}_{NCI}}\sum_{\mathrm{i}\in \mathrm{NCI}}\mathrm{SmoothL}1({G(x)}_{i}-{y}_{i})$$ (8a) where _NCI_ indicates the region covered
by _NCI_, and _N__NCI_ indicates number of elements in _NCI_ $${L}_{tv1}=\frac{1}{{N}_{I}}\sum_{\mathrm{i}\in \mathrm{I}}\mathrm{SmoothL}1({\widehat{tv1}}_{i}-{tv1}_{i})$$ (8b)
$${L}_{tv2}=\frac{1}{{N}_{I}}\sum_{\mathrm{i}\in \mathrm{I}}\mathrm{SmoothL}1({\widehat{tv2}}_{i}-{tv2}_{i})$$ (8c) $$tv1= \left({I}_{\left(i+1,j,k\right)\in I}-{I}_{\left(i,j,k\right)\in
I}\right) \oplus \left({I}_{\left(i,j+1,k\right)\in I}-{I}_{\left(i,j,k\right)\in I}\right) \oplus \left({I}_{\left(i,j,k+1\right)\in I}-{I}_{\left(i,j,k\right)\in I}\right)$$ (8d) $$tv2=
\left({tv1}_{\left(i+1,j,k\right)\in I}-{tv1}_{\left(i,j,k\right)\in I}\right) \oplus \left({tv1}_{\left(i,j+1,k\right)\in I}-{tv1}_{\left(i,j,k\right)\in I}\right) \oplus
\left({tv1}_{\left(i,j,k+1\right)\in I}-{tv1}_{\left(i,j,k\right)\in I}\right)$$ (8e) where \(\oplus\) indicates the operator of concatenate. To prepare data for model training, the
experimental EDs (i.e. sigma scaled 2Fo-Fc map) for pockets were generated using Phenix38 and experimental ED coefficients downloaded from PDB. These pocket EDs were used as input features
for the AI model. The computational ED for ligands were prepared as labels. The software xtb39 were used to calculate computational ED for ligands at GNF2-xTB level using ligand coordinates
as input. Since the ED intensity within the nuclear region is much stronger than that within the region where the NCIs take place and where the shape of the molecule is defined (i.e., the
isosurface at 0.03 e/Å3), the range of values were compressed using logarithms and then used as labels for the AI model. ED was featured using 3D CNN, and data augmentation was used to
achieve rotational invariance. LIGAND STRUCTURE GENERATIVE MODEL As shown in Fig. 1b, VQ-VAE2 was used to compress the ED into a discrete latent space and learn a codebook in which EDs are
represented by a series of embeddings. To retain the constraints in the input ED while ensuring that the output ED can match a valid molecule, a separate autoregressive prior (PixelCNN) was
taught to sample the latent space with input ED as a given condition. Two codebooks were learned during training: the top-level codebook focusing on the extraction of general profile
information (such as shape) and the bottom-level codebook focusing on the detailed information (such as local conformations). Regarding sampling with the two codebooks, the input ED was used
as a condition to sample the top-level codebook, and the top-level encoding was used as the condition to sample the bottom-level codebook. Thus, the relationship between the conditional ED
(i.e., input ED) and the generated ED was decoupled. EDs were voxelized into a discrete 0.5 Å cubic grid with a side size of 24 Å. There were represented as a tensor \(\mathrm{p}\in
{\mathcal{R}}^{1\times 48\times 48\times 48}\), where channel size was 1, expressing the intensity of ED. The VQ-VAE2 loss is shown in Eq. (9),where _x_ is the training instance, _D_ is the
decoder of the VQ-VAE2 and _e_ is the encoder. The reconstruction loss is shown in Eq. (10). It combines the \({\mathrm{L}}_{\mathrm{SoftDiceLoss}}\) as well as
\({\mathrm{L}}_{\mathrm{SmoothL}1}\). To generate better ED reconstructed shapes, we adopted \({\mathrm{L}}_{\mathrm{SoftDiceLoss}}\) as shown in Eq. (11) for segmenting ED and the
background where _y_ is the target and \(\widehat{y}\) is the prediction. The target label of the pixel with the ED value was set to 1, and the rest of the background part was set to 0.
Further, \({\mathrm{L}}_{\mathrm{SmoothL}1}\) was obtained using Eq. (12); similarly, y is the target and \(\widehat{\mathrm{y}}\) is the prediction.
$$\mathrm{L}(\mathrm{x},\mathrm{D}(\mathrm{e})) = {\mathrm{L}}_{\mathrm{Reconstruction}}(\mathrm{x},\mathrm{D}(\mathrm{e})) + {\Vert \mathrm{sg}[\mathrm{E}(\mathrm{x})-\mathrm{e}]\Vert
}_{2}^{2}+\upbeta {\Vert \mathrm{sg}[\mathrm{e}]-\mathrm{E}(\mathrm{x})\Vert }_{2}^{2}$$ (9) $${\mathrm{L}}_{\mathrm{Reconstruction}}(\mathrm{x},\mathrm{D}(\mathrm{x})) =
{\mathrm{L}}_{\mathrm{SoftDiceLoss}}(\mathrm{x},\mathrm{D}(\mathrm{x}))+\mathrm{\alpha }{\mathrm{L}}_{\mathrm{SmoothL}1}(\mathrm{x},\mathrm{D}(\mathrm{x}))$$ (10)
$${\mathrm{L}}_{\mathrm{SoftDiceLoss}}(\widehat{\mathrm{y}},\mathrm{y}) = 1 - \frac{2\sum_{\mathrm{i}\in
\mathrm{I}-1}{\widehat{\mathrm{y}}}_{\mathrm{i}}{\mathrm{y}}_{\mathrm{i}}}{\sum_{\mathrm{i}\in \mathrm{I}-1}{{\widehat{\mathrm{y}}}_{\mathrm{i}}}^{2}+\sum_{\mathrm{i}\in
\mathrm{I}-1}{{\mathrm{y}}_{\mathrm{i}}}^{2}}$$ (11) $${\mathrm{L}}_{\mathrm{SmoothL}1}(\widehat{\mathrm{y}},\mathrm{y})= \frac{1}{{N}_{I}}\sum_{\mathrm{i}\in
\mathrm{I}}\mathrm{SmoothL}1({\widehat{y}}_{i}-{y}_{i})$$ (12) _PixelCNN_ optimized the negative log-likelihood of the training data _to maximize the probability_
\(\mathrm{p}(\mathrm{x}|\mathrm{h}) = \prod_{\mathrm{i}=1}^{\mathrm{HWD}}\mathrm{p}({\mathrm{x}}_{\mathrm{i}}|{\mathrm{x}}_{1},...,{\mathrm{x}}_{\mathrm{i}-1},\mathrm{h})\), where H
represents height, W represents width, and D represents depth of the 3D cube where h is the condition. Top-level and bottom-level prior networks were modeled with 6 × 6 × 6 and 12 × 12 × 12
latent variables, respectively. Additionally, the condition of the top-level PixelCNN was the previously generated filler ED. The bottom-level network was conditioned on the top-level prior.
To prepare the data for modeling training, two million molecules with a QED exceeding 0.3 were extracted. For each molecule, 20 conformers were generated using ConfGen40. EDs of the 40
million conformers were generated using xtb39 and then used as training data for the VQ-VAE2. MAP SKELETON ASSISTED ED FRAGMENT SUBSTITUTION WITH MOLECULE FRAGMENT First, the reconstructed
ED was submitted to a V-Net framework for atom detection. This step is similar to that of key point detection in human skeletons in the field of image processing. The V-Net was trained using
the above 40 million EDs as features and the conformers used to generate these EDs as labels. The ground truth was represented as a tensor, where 10 channels were denoted based on atom
type: PAD (no atoms), C, N, O, S, P, F, Cl, Br, and I. The cross-entropy loss was used for atom type classification. The V-Net output was comprised of connected atoms and called a map
skeleton. Then, a molecular fragment library was prepared. The molecules from PubChem were matched with 35 reaction templates41 according to the substructure superposition supported by
RDKit42, and then cut into two fragments at the matching site. If a molecule matched multiple reaction templates, it was still cut into two fragments each time, but the cutting site was
different. In this way, over 270,000 fragments with labeled cutting sites were obtained. Then OpenBabel43 was used to generate a maximum of 20 conformations for each fragment, and it finally
produced a library with 3.5 million 3D conformations. GFN0-xtb EDs of the conformations were calculated for future use. Next, the map skeleton was cut into several fragment pairs in the
following manner: each time the whole molecule was cleaved at one acyclic single bond, two fragments were generated; next time, the whole molecule was cleaved at another acyclic single bond;
the process was repeated until all acyclic single bonds had been cut. Each cut on the map skeleton generates a pair of map skeleton fragments and a pair of ED fragments. The
above-established 3.5 million 3D conformation library was searched for entries that could be well fitted in the ED fragment in terms of shape and intensity and similar to the map skeleton
fragment in terms of atomic position. Specifically, an entry in the library was first superimposed with the map skeleton fragment by minimizing root-mean-square deviation of atomic positions
and then subjected to the measuring of Dice using Eq. (11) between its ED and the ED fragment. Next, the two groups of selected entries were assembled in an enumerative way to make a list
of target molecules. Subsequently, several filters were applied to remove the unqualified molecules. These filters include the following: * 1. Collisions with the pocket : the distance from
the pocket heavy atom is less than 2.5 Å. * 2. Collisions between the fragments: the distance from the non-bonded heavy atom is less than 2.0 Å. * 3. Stability and synthetic accessibility
filters and drug-like filter reported by Virshup et al.28 Illustrations can be found in Figure S4 and Table S5 in Supporting Information. MODEL EVALUATION The data used for chemical space
construction consisted of 8.8 million molecules from SMU-RUL28. The evaluation data were collected from 144 publications including research papers and patents. CHEMICAL SPACE CONSTRUCTION
Chemical space was constructed mainly based on the method described in a previous study28. In our work, four properties including carbon-scaled atomic mass, carbon-scaled atomic van der
Waals volume, carbon-scaled atomic Sanderson electronegativity, and carbon-scaled atomic polarizability were used to calculate the autocorrelation fingerprint. The autocorrelation
descriptors were calculated using PyBioMed44. The SOM45 with size of 120 ×120 was implemented using MiniSom library46. NCI FINGERPRINT ANALYSIS Docking was implemented by using Glide29,30.
IGM-based NCI analysis was implemented using Multiwfn47. The atom-pair-based NCI list output by Multwfn was further annotated with the Mol2/Sybyl atom types for both of the atoms using
OpenBabel48 and PyBel43 packages, and then submitted to Scikit-learn49 for t-SNE32 clustering analysis. BENCHMARK MODEL The source code of benchmark model is downloaded from its official
website: https://github.com/luost26/3D-Generative-SBDD. DATA AVAILABILITY The data analyzed during this study are included in this published article and its supplementary information files.
Partial codes are available from the corresponding author on reasonable request. Our model provides service to academic users via https://edmg.stonewise.cn/#/create. ABBREVIATIONS * ED:
Electron density * GAN: Generative adversarial network * NCI: Non-covalent interactions * QED: Quantitative estimate of drug-likeness * SAS: Synthetic accessibility score * VQ-VAE: Vector
quantized variational autoencoder * t-SNE: T-distributed stochastic neighbor embedding * SOM: Self-organizing-map * SMU-RUL: Small-molecule-universe representative universal library * HPK1:
Hematopoietic progenitor kinase 1 * 3CLpro : SARS‐CoV‐2 main protease * VDR: Vitamin D receptor REFERENCES * Walters, W. P. & Barzilay, R. Applications of deep learning in molecule
generation and molecular property prediction. _Acc. Chem. Res._ 54, 263–270. https://doi.org/10.1021/acs.accounts.0c00699 (2021). Article CAS PubMed Google Scholar * Xie, W., Wang, F.,
Li, Y., Lai, L. & Pei, J. Advances and challenges in de novo drug design using three-dimensional deep generative models. _J. Chem. Inf. Model._ 62, 2269–2279.
https://doi.org/10.1021/acs.jcim.2c00042 (2022). Article CAS PubMed Google Scholar * Skalic, M., Sabbadin, D., Sattarov, B., Sciabola, S. & De Fabritiis, G. From target to drug:
Generative modeling for the multimodal structure-based ligand design. _Mol. Pharm._ 16, 4282–4291. https://doi.org/10.1021/acs.molpharmaceut.9b00634 (2019). Article CAS PubMed Google
Scholar * Jin, W., Barzilay, R. & Jaakkola, T. In _International Conference on Machine Learning._ 4839–4848 (PMLR). * Olivecrona, M., Blaschke, T., Engkvist, O. & Chen, H. Molecular
de-novo design through deep reinforcement learning. _J. Cheminform._ 9, 48. https://doi.org/10.1186/s13321-017-0235-x (2017). Article PubMed PubMed Central Google Scholar * De Cao, N.
& Kipf, T. J. a. e.-p. MolGAN: An implicit generative model for small molecular graphs. arXiv:1805.11973 (2018). https://ui.adsabs.harvard.edu/abs/2018arXiv180511973D. * Lim, J., Ryu,
S., Kim, J. W. & Kim, W. Y. Molecular generative model based on conditional variational autoencoder for de novo molecular design. _J. Cheminform._ 10, 31.
https://doi.org/10.1186/s13321-018-0286-7 (2018). Article CAS PubMed PubMed Central Google Scholar * Xu, M., Ran, T. & Chen, H. D. Novo molecule design through the molecular
generative model conditioned by 3D information of protein binding sites. _J. Chem. Inf. Model._ 61, 3240–3254. https://doi.org/10.1021/acs.jcim.0c01494 (2021). Article CAS PubMed Google
Scholar * Li, Y. _et al._ DeepScaffold: A comprehensive tool for scaffold-based de novo drug discovery using deep learning. _J. Chem. Inf. Model._ 60, 77–91.
https://doi.org/10.1021/acs.jcim.9b00727 (2020). Article CAS PubMed Google Scholar * Mahmood, O., Mansimov, E., Bonneau, R. & Cho, K. Masked graph modeling for molecule generation.
_Nat. Commun._ 12, 3156. https://doi.org/10.1038/s41467-021-23415-2 (2021). Article ADS CAS PubMed PubMed Central Google Scholar * Francoeur, P. G. _et al._ Three-dimensional
convolutional neural networks and a cross-docked data set for structure-based drug design. _J. Chem. Inf. Model._ 60, 4200–4215. https://doi.org/10.1021/acs.jcim.0c00411 (2020). Article CAS
PubMed PubMed Central Google Scholar * Berman, H. M. _et al._ The protein data bank. _Nucleic Acids Res._ 28, 235–242. https://doi.org/10.1093/nar/28.1.235 (2000). Article ADS CAS
PubMed PubMed Central Google Scholar * Ding, K. _et al._ Observing noncovalent interactions in experimental electron density for macromolecular systems: A novel perspective for
protein-ligand interaction research. _J. Chem. Inf. Model._ https://doi.org/10.1021/acs.jcim.1c01406 (2022). Article PubMed Google Scholar * Pearce, N. M. _et al._ A multi-crystal method
for extracting obscured crystallographic states from conventionally uninterpretable electron density. _Nat. Commun._ 8, 15123. https://doi.org/10.1038/ncomms15123 (2017). Article ADS
PubMed PubMed Central Google Scholar * Riley, B. T. _et al._ qFit 3: Protein and ligand multiconformer modeling for X-ray crystallographic and single-particle cryo-EM density maps.
_Protein Sci._ 30, 270–285. https://doi.org/10.1002/pro.4001 (2021). Article CAS PubMed Google Scholar * Lang, P. T., Holton, J. M., Fraser, J. S. & Alber, T. Protein structural
ensembles are revealed by redefining X-ray electron density noise. _Proc. Natl. Acad. Sci. USA_ 111, 237–242. https://doi.org/10.1073/pnas.1302823110 (2014). Article ADS CAS PubMed
Google Scholar * Koumpouras, K. & Larsson, J. A. Distinguishing between chemical bonding and physical binding using electron localization function (ELF). _J. Phys. Condens. Matter_ 32,
315502. https://doi.org/10.1088/1361-648X/ab7fd8 (2020). Article ADS CAS PubMed Google Scholar * Deng, D. _et al._ XGraphBoost: Extracting graph neural network-based features for a
better prediction of molecular properties. _J. Chem. Inf. Model._ 61, 2697–2705. https://doi.org/10.1021/acs.jcim.0c01489 (2021). Article CAS PubMed Google Scholar * Gligorijevic, V. _et
al._ Structure-based protein function prediction using graph convolutional networks. _Nat. Commun._ 12, 3168. https://doi.org/10.1038/s41467-021-23303-9 (2021). Article ADS CAS PubMed
PubMed Central Google Scholar * Kuzminykh, D. _et al._ 3D molecular representations based on the wave transform for convolutional neural networks. _Mol. Pharm._ 15, 4378–4385.
https://doi.org/10.1021/acs.molpharmaceut.7b01134 (2018). Article CAS PubMed Google Scholar * Skalic, M., Jimenez, J., Sabbadin, D. & De Fabritiis, G. Shape-based generative modeling
for de novo drug design. _J. Chem. Inf. Model._ 59, 1205–1214. https://doi.org/10.1021/acs.jcim.8b00706 (2019). Article CAS PubMed Google Scholar * Bickerton, G. R., Paolini, G. V.,
Besnard, J., Muresan, S. & Hopkins, A. L. Quantifying the chemical beauty of drugs. _Nat. Chem._ 4, 90–98. https://doi.org/10.1038/nchem.1243 (2012). Article CAS PubMed PubMed Central
Google Scholar * Ertl, P. & Schuffenhauer, A. Estimation of synthetic accessibility score of drug-like molecules based on molecular complexity and fragment contributions. _J.
Cheminform._ 1, 8. https://doi.org/10.1186/1758-2946-1-8 (2009). Article CAS PubMed PubMed Central Google Scholar * Razavi, A., Van den Oord, A. & Vinyals, O. Generating diverse
high-fidelity images with vq-vae-2. _Adv. Neural Inf. Process. Syst._ 32, 25 (2019). Google Scholar * Pombo, G., Gray, R., Varsavsky, T., Ashburner, J. & Nachev, P. _International
Conference on Medical Image Computing and Computer-Assisted Intervention_ 429–437 (Springer, 2019). Google Scholar * Bajusz, D., Racz, A. & Heberger, K. Why is Tanimoto index an
appropriate choice for fingerprint-based similarity calculations?. _J. Cheminform._ 7, 20. https://doi.org/10.1186/s13321-015-0069-3 (2015). Article CAS PubMed PubMed Central Google
Scholar * Luo, S., Guan, J., Ma, J. & Peng, J. In _Thirty-Fifth Conference on Neural Information Processing Systems._ * Virshup, A. M., Contreras-Garcia, J., Wipf, P., Yang, W. &
Beratan, D. N. Stochastic voyages into uncharted chemical space produce a representative library of all possible drug-like compounds. _J. Am. Chem. Soc._ 135, 7296–7303.
https://doi.org/10.1021/ja401184g (2013). Article CAS PubMed PubMed Central Google Scholar * Friesner, R. A. _et al._ Extra precision glide: Docking and scoring incorporating a model of
hydrophobic enclosure for protein-ligand complexes. _J. Med. Chem._ 49, 6177–6196. https://doi.org/10.1021/jm051256o (2006). Article CAS PubMed Google Scholar * Schrödinger Release
2021–4. Glide, Schrödinger, LLC, New York, NY, 2021. * Contreras-Garcia, J. _et al._ NCIPLOT: A program for plotting non-covalent interaction regions. _J. Chem. Theory Comput._ 7, 625–632.
https://doi.org/10.1021/ct100641a (2011). Article CAS PubMed PubMed Central Google Scholar * Belkina, A. C. _et al._ Automated optimized parameters for T-distributed stochastic neighbor
embedding improve visualization and analysis of large datasets. _Nat. Commun._ 10, 5415. https://doi.org/10.1038/s41467-019-13055-y (2019). Article ADS CAS PubMed PubMed Central Google
Scholar * Shearer, J., Castro, J. L., Lawson, A. D. G., MacCoss, M. & Taylor, R. D. Rings in clinical trials and drugs: Present and future. _J. Med. Chem._ 65, 8699–8712.
https://doi.org/10.1021/acs.jmedchem.2c00473 (2022). Article CAS PubMed PubMed Central Google Scholar * Smith, R. D. & Carlson, H. A. Identification of cryptic binding sites using
MixMD with standard and accelerated molecular dynamics. _J. Chem. Inf. Model._ 61, 1287–1299. https://doi.org/10.1021/acs.jcim.0c01002 (2021). Article CAS PubMed PubMed Central Google
Scholar * Ghanakota, P. & Carlson, H. A. Driving structure-based drug discovery through cosolvent molecular dynamics. _J. Med. Chem._ 59, 10383–10399.
https://doi.org/10.1021/acs.jmedchem.6b00399 (2016). Article CAS PubMed PubMed Central Google Scholar * Wang, R., Fang, X., Lu, Y. & Wang, S. The PDBbind database: Collection of
binding affinities for protein-ligand complexes with known three-dimensional structures. _J. Med. Chem._ 47, 2977–2980. https://doi.org/10.1021/jm030580l (2004). Article CAS PubMed Google
Scholar * Bhagavat, R., Sankar, S., Srinivasan, N. & Chandra, N. An augmented pocketome: Detection and analysis of small-molecule binding pockets in proteins of known 3D structure.
_Structure_ 26, 499-512 e492. https://doi.org/10.1016/j.str.2018.02.001 (2018). Article CAS PubMed Google Scholar * Adams, P. D. _et al._ Recent developments in the PHENIX software for
automated crystallographic structure determination. _J. Synchrotron. Radiat._ 11, 53–55. https://doi.org/10.1107/s0909049503024130 (2004). Article CAS PubMed Google Scholar * Bannwarth,
C., Ehlert, S. & Grimme, S. GFN2-xTB—an accurate and broadly parametrized self-consistent tight-binding quantum chemical method with multipole electrostatics and density-dependent
dispersion contributions. _J. Chem. Theory Comput._ 15, 1652–1671. https://doi.org/10.1021/acs.jctc.8b01176 (2019). Article CAS PubMed Google Scholar * Watts, K. S. _et al._ ConfGen: A
conformational search method for efficient generation of bioactive conformers. _J. Chem. Inf. Model._ 50, 534–546. https://doi.org/10.1021/ci100015j (2010). Article ADS CAS PubMed Google
Scholar * Konze, K. D. _et al._ Reaction-based enumeration, active learning, and free energy calculations to rapidly explore synthetically tractable chemical space and optimize potency of
cyclin-dependent kinase 2 inhibitors. _J. Chem. Inf. Model._ 59, 3782–3793. https://doi.org/10.1021/acs.jcim.9b00367 (2019). Article CAS PubMed Google Scholar * RDKit. RDKit: Open-source
cheminformatics. http://www.rdkit.org (2021). * O’Boyle, N. M., Morley, C. & Hutchison, G. R. Pybel: A Python wrapper for the OpenBabel cheminformatics toolkit. _Chem. Cent. J._ 2, 5.
https://doi.org/10.1186/1752-153X-2-5 (2008). Article CAS PubMed PubMed Central Google Scholar * Dong, J. _et al._ PyBioMed: A python library for various molecular representations of
chemicals, proteins and DNAs and their interactions. _J. Cheminform._ 10, 16. https://doi.org/10.1186/s13321-018-0270-2 (2018). Article CAS PubMed PubMed Central Google Scholar *
Takacs, G., Sandor, M., Szalai, Z., Kiss, R. & Balogh, G. T. Analysis of the uncharted, druglike property space by self-organizing maps. _Mol. Divers_
https://doi.org/10.1007/s11030-021-10343-y (2021). Article PubMed Google Scholar * Vettigli, G. MiniSom: Minimalistic and NumPy-based implementation of the Self Organizing Map (2018). *
Lu, T. & Chen, F. Multiwfn: A multifunctional wavefunction analyzer. _J. Comput. Chem._ 33, 580–592. https://doi.org/10.1002/jcc.22885 (2012). Article CAS PubMed Google Scholar *
O’Boyle, N. M. _et al._ Open Babel: An open chemical toolbox. _J. Cheminform._ 3, 33. https://doi.org/10.1186/1758-2946-3-33 (2011). Article CAS PubMed PubMed Central Google Scholar *
Pedregosa, F. _et al._ Scikit-learn: Machine learning in Python. _J. Mach. Learn. Res._ 12, 2825–2830 (2011). MathSciNet MATH Google Scholar Download references FUNDING All the authors
received funding from StoneWise Ltd.; B.H. and W.Z. also received funding for cloud computing from Beijing Municipal Science & Technology Commission project (No. Z211100003521001).
AUTHOR INFORMATION Author notes * These authors contributed equally: Lvwei Wang, Rong Bai and Xiaoxuan Shi. AUTHORS AND AFFILIATIONS * Beijing StoneWise Technology Co Ltd., Haidian District,
Haidian Street #15, Beijing, 100080, China Lvwei Wang, Rong Bai, Xiaoxuan Shi, Yinuo Cui, Xiaoman Wang, Cheng Wang, Haoyu Chang, Yingsheng Zhang, Jielong Zhou, Wenbiao Zhou & Bo Huang *
Innovation Center for Pathogen Research, Guangzhou Laboratory, Guangzhou, 510320, China Wei Zhang & Wei Peng Authors * Lvwei Wang View author publications You can also search for this
author inPubMed Google Scholar * Rong Bai View author publications You can also search for this author inPubMed Google Scholar * Xiaoxuan Shi View author publications You can also search for
this author inPubMed Google Scholar * Wei Zhang View author publications You can also search for this author inPubMed Google Scholar * Yinuo Cui View author publications You can also search
for this author inPubMed Google Scholar * Xiaoman Wang View author publications You can also search for this author inPubMed Google Scholar * Cheng Wang View author publications You can
also search for this author inPubMed Google Scholar * Haoyu Chang View author publications You can also search for this author inPubMed Google Scholar * Yingsheng Zhang View author
publications You can also search for this author inPubMed Google Scholar * Jielong Zhou View author publications You can also search for this author inPubMed Google Scholar * Wei Peng View
author publications You can also search for this author inPubMed Google Scholar * Wenbiao Zhou View author publications You can also search for this author inPubMed Google Scholar * Bo Huang
View author publications You can also search for this author inPubMed Google Scholar CONTRIBUTIONS B.H. and W.Z. conceived the idea. B.H. provided instructions for experimental ED
processing, molecular representations, and model evaluation. W.Z. provided instructions on AI models. L.W., R.B., and X.S. developed the model. W.Z. and Y.C. prepared evaluation data. C.W.
and H.C. supported evaluation. X.W. supported website development. Y.Z. and J.Z. provided instructions on general model architecture. W.P. provided instructions on the selection of
validation targets. CORRESPONDING AUTHORS Correspondence to Wenbiao Zhou or Bo Huang. ETHICS DECLARATIONS COMPETING INTERESTS The authors declare no competing interests. ADDITIONAL
INFORMATION PUBLISHER'S NOTE Springer Nature remains neutral with regard to jurisdictional claims in published maps and institutional affiliations. SUPPLEMENTARY INFORMATION
SUPPLEMENTARY INFORMATION 1. SUPPLEMENTARY INFORMATION 2. SUPPLEMENTARY INFORMATION 3. SUPPLEMENTARY INFORMATION 4. SUPPLEMENTARY INFORMATION 5. SUPPLEMENTARY INFORMATION 6. SUPPLEMENTARY
INFORMATION 7. RIGHTS AND PERMISSIONS OPEN ACCESS This article is licensed under a Creative Commons Attribution 4.0 International License, which permits use, sharing, adaptation,
distribution and reproduction in any medium or format, as long as you give appropriate credit to the original author(s) and the source, provide a link to the Creative Commons licence, and
indicate if changes were made. The images or other third party material in this article are included in the article's Creative Commons licence, unless indicated otherwise in a credit
line to the material. If material is not included in the article's Creative Commons licence and your intended use is not permitted by statutory regulation or exceeds the permitted use,
you will need to obtain permission directly from the copyright holder. To view a copy of this licence, visit http://creativecommons.org/licenses/by/4.0/. Reprints and permissions ABOUT THIS
ARTICLE CITE THIS ARTICLE Wang, L., Bai, R., Shi, X. _et al._ A pocket-based 3D molecule generative model fueled by experimental electron density. _Sci Rep_ 12, 15100 (2022).
https://doi.org/10.1038/s41598-022-19363-6 Download citation * Received: 17 July 2022 * Accepted: 29 August 2022 * Published: 06 September 2022 * DOI:
https://doi.org/10.1038/s41598-022-19363-6 SHARE THIS ARTICLE Anyone you share the following link with will be able to read this content: Get shareable link Sorry, a shareable link is not
currently available for this article. Copy to clipboard Provided by the Springer Nature SharedIt content-sharing initiative