Play all audios:
ABSTRACT Field pea (_Pisum sativum_ L.) needs improvement to increase productivity due to its high price and demand. However, the incidence of powdery mildew (PM) disease limits its
production. This study aimed to analyze the diversity of qualitative and quantitative traits against powdery mildew resistance by utilizing cluster and principal component analysis to
explore PM resistance high-yield potential field peas. Shannon–Weaver's diversity index (Hʹ) displayed high intra-genotype diversity for quantitative and qualitative aspects.
Heterogeneity was identified for resistance against powdery mildew infections. Eighty-five genotypes were divided into five groups using Mohalanobis generalized distance (D2) statistics. The
highest inter-cluster D2 value was observed between clusters 2 and 3 (11.89) while the lowest value was found between clusters 3 and 4 (2.06). Most of the genotypes had noticeable
differences, so these could be employed in a crossing scheme. Twelve genotypes were extremely resistant, 29 genotypes were resistant, 25 genotypes were moderately resistant, 18 genotypes
were fairly susceptible, and 1 genotype was susceptible to powdery mildew disease. Among 29 resistant genotypes, BFP77, BFP74, BFP63, BFP62, BFP43, and BFP80 were high yielders and, could be
used directly and/or transferred through hybridization to high-yielding disease-susceptible genotypes. Among the 25 moderately resistant genotypes, BFP78, BFP45, BFP79, and BFP48 were found
to be high yielders. In principal component analysis (PCA), the first four PCs with Eigen values > 1 accounted for 88.4% variability for quantitative traits. Clustering sorted genotypes
into five groups, where groups 1 to 5 assembled 37, 28, 1, 8, and 11 genotypes, respectively. Genotypes of cluster 4 were identified as high yielders with its attributes. Pearson correlation
significantly and positively correlated across all traits except for PM. This variation suggested that there is a mechanism to select promising genotypes for field pea breeding. Considering
all features, BFP78, BFP77, BFP74, BFP63, BFP62, BFP45, BFP79, and BFP80 could be preferred as high yielders and PM resistance owing to longer pod lengths, seeds per pod and pods per plant.
SIMILAR CONTENT BEING VIEWED BY OTHERS ‘UNEMAT RUBI’, A NEW SPINELESS PINEAPPLE CULTIVAR AND RESISTANT TO FUSARIOSIS FOR THE INTERNATIONAL MARKET Article Open access 13 May 2025
COMPREHENSIVE EVALUATION OF SUGAR BEET VARIETIES BASED ON GENOTYPE × YIELD × TRAIT (GYT) IN DIFFERENT ENVIRONMENTS Article Open access 21 March 2025 GENETIC DIVERSITY, MORPHOLOGICAL AND
QUALITY TRAITS OF _MOMORDICA DIOICA_ Article Open access 04 December 2024 INTRODUCTION Field pea (_Pisum sativum_ L.) is one of the oldest crops in cultivation and the third-largest producer
of legumes worldwide1. It has chromosome number 2n = 14 and is a self-pollinated diploid. In tropical, subtropical, and temperate parts of the world, field pea is a significant cool-season
multifunctional crop that is widely farmed for grain and green pods2,3. It is recognized as one of the highly productive, nutritionally dense cool-season legume crops, which has great
promise for reducing protein deficiency in the resource-constrained society4. With a yield of over 16.20 metric tons and a global cultivation area of over 8.14 million hectares, it meets
consumer demand for food, feed, and fodder5. Due to numerous widespread biotic and abiotic stresses, of which powdery mildew, rust, and high temperatures are the main concerns6,7 the
productivity of dry peas in Bangladesh is very low and fluctuates between 1120 and 1338 kg/ha. According to Azam et al.8 and USDA9, the crop is mainly grown for human consumption, animal
feed, and as a source of income for farmers. For the human diet, it is a significant source of proteins and other nutrients10. Additionally, the crop is highly valuable economically since it
can grow in low-rainfall areas better than other pulses like faba beans and lentils11. However, the nation imports pulse waste at a cost of around 64512. Parihar et al.13 noted that pea
seeds have an average amount of iron, selenium, zinc, and molybdenum of around 97, 42, 41, and 12 ppm, respectively. They are also considered to have 21–33% protein and 56–74% carbohydrates.
Field peas are high in lysine and tryptophan amino acids and low in cysteine and methionine amino acids14,15 these are rich sources of protein (21–25%). Being a leguminous vegetable, it
occupies a prominent position among vegetables due to its high nutritional value, particularly proteins and a variety of other health-improving ingredients like carbohydrates, vitamin A,
vitamin C, calcium, phosphorus, and essential amino acids, particularly lysine16. As a result, it plays a crucial role in maintaining nutritional security for those who lack access to
resources in impoverished countries. By fostering a symbiotic relationship between nitrogen-fixing bacteria and plant root nodules, they can increase soil fertility17. In several locations
in Bangladesh, it is cultivated primarily as a relay crop alongside transplant Aman rice. After harvesting the pods, the plants are used as either feed or organic soil amendments, and the
green pods are sold as food. It is a member of the Fabaceae family, the largest family of flowering plants with 1200 species and 450 genera18. The cotyledons of pea grains come in a variety
of colors, including yellow, green, and orange. These grains are used in dal, stew, chhola, vegetables, snacks, soup, chat, and flour, whereas entire seeds are mostly used as animal
feed19,20. It is also helpful in food processing because it can be transformed into a variety of products, including biscuits, pasta, salad, noodles, cookies, and bread21. This makes it
extremely relevant economically. Smallholder farmers in rural areas of several developing nations, like Bangladesh, find it to be quite alluring8. Field pea serves as a unique food supply
during the lean season with minimal to no value addition, as well as function as feed for animals, green vegetables for humans, and an income source for both men and women7. Field pea seeds
are used as a raw material in a variety of industries to make goods with added value including _Bombay Chanachur_, _Ruchi,_ and _PRAN Dal Vaja_. It is extensively grown in a variety of
nations throughout the globe22. Since 2010, its global cultivable area has expanded from 6.58 to 8.09 million hectares, and its output has increased from 10.44 to 16.21 metric tons. The main
producers of peas are Canada, Russia, China, India, and the United States23 nevertheless; the United States produces the most peas overall 39.33%, followed by Europe (36.98%) and Asia
(18.09%). The crop's average productivity is currently 2.0 t/ha worldwide, up about 36% over the past ten years (2007–2017), but it has the potential to produce up to 5.0 t/ha in many
nations, including the Netherlands, Denmark, Belgium, Germany, and Finland, where harvests range from 3.45 to 5.01 t/ha24. However, nations with productivity levels of less than 2.00 t/ha
include Australia, China, India, and Myanmar25. Peas have poor output and productivity due to their susceptibility to many fungal infections and parasites26. _Erysiphe polygoni_ a
filamentous fungus responsible for 25–70% of crop losses in pea production causes pea powdery mildew, an airborne fungal disease27,28. Nisar et al.29 found that powdery mildew disease
reduced the production potential of field pea germplasm grown in various regions of the globe by 86%. In the mid-altitudes and with moderate intensity, powdery mildew disease has been
observed to reduce field pea output by 20–30%. When the days are warm and dry and the nights are icy enough for dew to accumulate, powdery mildew is a bothersome illness. Generally, the
price of field peas is a little bit high in Bangladesh though it is affordable to consumers. However, sometimes yield loss by PM severely affects farmers' incomes, as the government
can’t support farmers with crop insurance. Furthermore, the loss of yield of field peas reduces the market supply, and prices of field peas hike at the consumer level. To prevent the
illness, farmers often employ chemical agents, which might pollute the environment30. Eklund et al.31 showed that spore discharge may potentially affect farm employees' respiration and
allergy responses. Due to the high expense of fungicides, adverse effects on the environment, social and health issues, and other factors, it is preferable to search out other alternative
ways of disease management. Crop breeding should prioritize genetically based resistance32. To enhance and maintain the output and productivity of field peas for small-scale farmers, it is
necessary to produce high-yielding and powdery mildew resistant cultivars33. The development of superior crop varieties depends heavily on their existing genetic variation and proper
selection against yield-attributed traits34,35,36. The degree of genetic diversity and variability37,38 and the degree of inheritance of required traits determine the achievement of up
gradation in breeding programs39. Approaches using multivariate analysis may be useful in identifying genetic diversity and classifying germplasm40. Principal component analysis (PCA), one
of these methods, uses statistics to group a large number of variables into fundamental, uncorrelated components. PCA may be used to determine germplasm characterization traits, show
individual differences and relationships, and evaluate each individual's contribution to overall variance41. In addition, germplasm may be categorized and organized using hierarchical
cluster analysis42,43,44. Selecting superior parents for hybridization will be aided by an evaluation of the kind and degree of variety45. Principal component analysis is a method used to
decrease the size of large datasets, improve interpretability, and limit information loss46. Designing breeding programs for novel objectives may be aided by estimates of the variety of
these characteristics, cluster analysis, and PCA47. For the preservation, breeding strategies, development, and commercialization of new varieties46,47, high-yielding phenotypic variability
provided by various morphological and agronomical characteristics, such as seed, leaf, plant, and fruit-related characteristics, is crucial to understand48,49,50,51. The economic yield, a
very complicated characteristic of crops, is influenced by local climate and genetic factors. The crop also experiences many biotic and abiotic stressors and exhibits poor response to
inputs52. To increase the genetic variety and revitalize breeding stocks, new germplasm must be introduced. So, reducing the present yield gap and creating high-yielding types depend on
productivity and growth crops. Because of their comparatively greater economic significance, early genotypes in particular still have poor productivity, mostly because there aren't many
kinds with stable, high-yielding potential and losses from a variety of biotic and abiotic stressors53. A comprehensive evaluation of the field pea's qualitative and quantitative
traits is however uncommon. To develop crop advancement programs that produce high-yielding progeny, it is thus necessary to investigate genetic variability54. The necessity for a varied
parent to produce better genotypes in segregating generations was discussed by many researchers1,55,56. Yield-related traits have been considered by many researchers in multivariate analysis
to categorize and estimate diversity in crops. The researchers have a great interest in developing new varieties with the improvement of qualitative57,58,59,60 and quantitative
traits61,62,63,64 based on stability65,66, variability, and diversity67,68,69,70. Pea is an important vegetable crop as well as legumes in Bangladesh. In the country, a limited number of
low-yielding pea genotypes are being used commercially which are severely infested by powdery mildew (PM) during the growing period resulting in reduced pea yield. Therefore, the current
study was carried out to assess the genetic divergence of significant morpho-agronomic traits and to evaluate the performance of various genotypes of field peas to identify desirable
high-yielding pea genotypes with tolerance to PM and find out the genotypes for desirable traits that could be used in pea breeding programs to broaden the gene pool of this important
vegetable crop. METHODS PLANT MATERIALS AND SITE This research employed a total of 85 different genotypes of field peas for characterization and assessment. The Plant Genetic Resources
Centre (PGRC), Bangladesh Agricultural Research Institute (BARI), provided seeds for 23 Indigenous types, 7 genotypes from various agro-ecological areas in Bangladesh, 32 exotic types for
exploration through Australia, 1 exotic types from Nepal, 5 released varieties from BARI, 1 released variety from BSMRAU, and 14 were collected from the Pulses Research Centre (PRC), BARI,
for these experiments. Released variety BFP84 (BARI Motor-2) was used as a check for powdery mildew scoring in studied genotypes. Table 1 gives the complete details of these genotypes. Pea
seeds used for the study comply with our institutional, national, and international guidelines and legislation. DESIGNING EXPERIMENTS AND CROP MANAGEMENT The field experiment was carried out
during the cropping season (November to February) of the years 2022 and 2023 at the field of the Pulse Breeding Division, PRC, BARI, Ishwardi, Pabna, Bangladesh, which is situated at a mean
height of 15–19 m above sea level and is located at 24.75°N latitude and 88.5°E longitude. A Randomized Complete Block Design (RCBD) with three replications was used to set up the research.
The unit plot for continuous line sowing was 4.0 m by 1 m (two lines). Plant-to-plant spacing was kept at 5–7 cm inside a row. The use of pre-sowing irrigation helped achieve optimal
germination. The experimental plots were well-prepared before planting, and we added Farm Yard Manure (FYM). Field pea cultivation was done using the recommended amounts of manure and
fertilizer71. The seeds were treated with Provex at 2.5 g/kg seed prior to sowing. The experiment was routinely weeded, and irrigation was given as needed. As and when required, other
cultural activities were carried out. DETERMINATION OF AGRO-MORPHOLOGICAL AND QUALITATIVE CHARACTERISTICS Ten competing plants were chosen at random from each entry in each replication, and
the observations were averaged by dividing each value by ten. Data were recorded on days to 80% flowering (DF), days to maturity (DM), plant height (PH), pod length (cm) (PL), seeds per pod
(SPP), pods per plant (PPP), hundred seed weight (HSW), and yield per plant (YPP). Data on grain yield and yield-related traits were collected on a plant basis. The days to flowering (DF)
and days to maturity (DM) were taken when each block reached 80% flowering and 90% physiological pod maturity and calculated from the time required to the date of sowing to the date of 80%
flowering and 90% physiological pod maturity, respectively. Plant height (PH), pod length (PL), seeds per pod (SPP), pods per plant (PPP), and yield per plant (YPP) were collected after
harvesting from ten randomly selected plants in each plot. Plant height was measured in cm from the base of the plant to the tip of the plant. Pod length was measured from ten randomly
selected pods using a scale in cm. The number of seeds in ten randomly selected pods was collected to measure number of seeds per pod. The number of pods in ten randomly selected plants was
calculated to measure pods per plant. A hundred dried and cleaned seeds were counted and weighed to measure hundred seed weight (HSW). Ten randomly selected plants were collected and the
seeds were separated, dried, and cleaned to measure yield per plant. A set of local descriptors that were produced with the help of several scientific descriptors from the European Union
descriptor (UPOV) and IBPGR were used to capture the qualitative characteristics72,73. DISEASE DATA SCORING Early stage, flowering stage, and pod setting stage disease reactions of powdery
mildew for various genotypes were documented on a full plot basis 60 days after planting at three times74 (Table 2). After seed germination, 10 plants were selected at random from each line
and scored for morphological data and powdery mildew. The development of the powdery mildew disease was started by natural infection, and the disease infection was created by spraying a
fungicide Benomyl at 2.5 kg/ha at a fixed spray interval of every 7, 14, and 21 days75. Using a knapsack sprayer with a 60.6 ml spray volume per 2.4 m2 plot, a fungicide was administered.
The application of fungicides began as soon as the first detectable disease symptom appeared. The disease scoring process used a scale of 1 to 9 are details presented in Table 2. According
to Singh76 the disease data collected using the aforementioned scale was translated to a percentage disease index (PDI). Percentage disease index (PDI) was calculated for each genotype using
the formula: $$\text{PDI }(\text{\%}) = \frac{\text{Sum of all ratings}}{\text{Maximum disease grade }\times \text{Total number of observed plants}} \times 100$$ STATISTICAL ANALYSIS Both
quantitative and qualitative characteristics were taken to evaluate the varieties. 11 qualitative and 8 quantitative measurements were combined. Five plants and five pods per plant per
accession were used to gather the observations. Each treatment from all the sample data of a trait was averaged to obtain a replication mean. Statistics and biometrics were used to assess
the average data of different quantitative traits. The ANOVA, descriptive statistics, and LSD were calculated by using Statistix 8. Microsoft Excel was used to assess the phenotypic
diversity for each qualitative feature using the Shannon–Weaver diversity index (Hʹ)77. Excel was used to generate the Standardized H' using the following formula77: $$\sum {\left[
{\left( {{\text{pi}}} \right) \times \log \left( {{\text{pi}}} \right)} \right]}$$ where Hʹ—Shannon diversity index, and n—Individuals of a certain kind or species, N- Total number of
individuals of a community. According to Eticha et al.78, the diversity index was categorized as low (0.10 ≤ H ≤ 0.40), intermediate (0.40 ≤ H ≤ 0.60), or high (H ≥ 0.60). Using the
doe-bioresearch packages, the findings for various agro-morphological parameters were evaluated. The means were separated using the least significant difference at a 5% level of
significance. Pooled data from two years (2022 and 2023) were used to perform all analyses. The tools R (v 4.0.5) and R Studio were used to conduct the multivariate analysis79. Principal
component analysis (PCA) was used to estimate the degree of connection between characteristics, and cluster analysis was used to group genotypes based on traits. Using R's Complex
Heatmap package, the two-way hierarchical clustering heatmap was created using the Ward D2 and Euclidean distance algorithms. The R packages ggplot2, Factoextra80, and FactomineR81, were
used to create the PCA-biplot. The R program corrplot was used to create the correlation matrix82 which was then arranged in hclust. Cluster analysis was used to determine the cluster means
and standard deviations for each characteristic. Cluster analysis assessed the cluster mean values, distance values, and Dendrogram; PCA calculated Eigenvalues, variability, cumulative
variability, and vector components. RESULTS QUALITATIVE TRAITS The qualitative traits of the tested field pea genotypes are presented in Table 3, and the conversion values of the individual
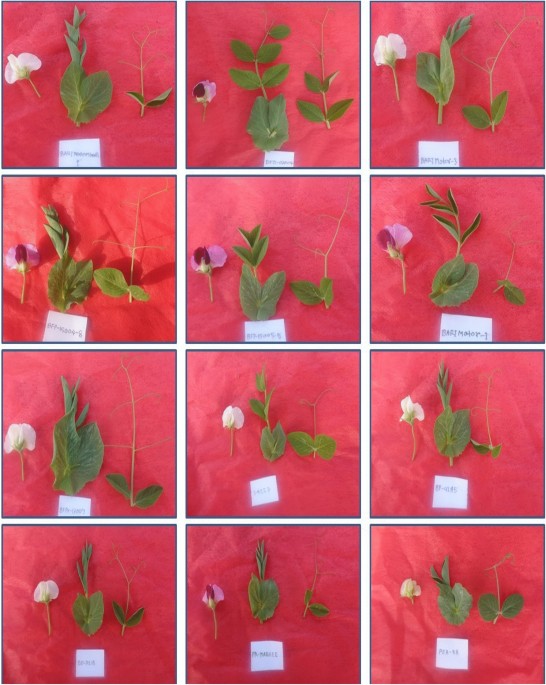
traits are exposed in the same Table 3. Flower color variation and variability of leaf and tendril characteristics are shown in Fig. 1. Our results showed significant variation among the
traits studied in the field pea genotypes. The leaves were green in 69 genotypes (76.47% of the total), and the remaining 12 genotypes had yellow-green leaves (14.12%). It was found that the
color of the tendrils of the collected genotypes was mainly green (56.47%), followed by pale green and purple green tendrils 36.47, and 7.06%, respectively. High leaf sizes were found in
medium (43.53%), small, large, very small, and very large (43.53%), 29.41, 16.47, and 3.53%, respectively. Most genotypes of flowers (59 of 85) were creamy white (69.41%). Great diversity in
immature pod color was identified. Green, light-green, slight dark green, and slight light green constituted the major types with 56.47, 16.47, 14.12, and 10.59% of the total variation,
while the remaining genotype had dark-green colored pods (2.35% of the total). Maximum twining tendrils showed intermediate type (60%) and the lowest found high twining tendrils (16.47%).
Two types of growth patterns were recognized in the evaluated genotypes: erect (74.12%) and flat (25.88%). Rough-type pod texture was recorded among the collected field pea genotypes,
followed by smooth and tuberculate types. The majority of genotypes had weakly curved pods (72.94%) and a little absent pod curvature (14.12%). Regarding seed size, three types, medium
(72.94%), small (20.00%), and large (7.06%)—were recorded from the field pea genotype. The seed colors of the collected genotype are mainly Whitish green (51.76%) and Cream (29.41%). In the
case of the seed wrinkle, two types of variation were noted. The frequency distribution of genotypes studied for quantitative traits is shown in Fig. 2. In the histogram, there was much
variation found in the evaluated genotypes among the tested traits (Fig. 2). GENOTYPIC VARIATIONS IN AGRO-MORPHOLOGICAL TRAITS The combined analysis of variance over two years data revealed
significant differences for studied traits among the tested field pea genotypes (Table 4). However, the analysis of variance for year showed non-significant differences among the tested
genotypes (Table 4). For this reason, the data of years 2022 and 2023 were pooled and the pooled data were analyzed for diversity study and other multivariate analysis. The results of the
wide range of parameters for mean performance indicated that significant variations were seen in all of the investigated features, particularly in yield, seed size, pod setting, and disease
response. Table 5 displays the average values for each characteristic in the 85 genotypes of field peas that were studied. For genotypes BFP30 and BFP56, the DF was found to have a mean of
54.88 days and a range of 25–91 days, respectively (Tables 5 and 6; Supplementary Tables S1 & S3). The DM values, which varied from 84 to 112 days (BFP84 to BFP57 and BFP61), had grand
averages of 103.14 (Tables 5 and 6). From the vegetative stage until maturity, the plant's height ranges from 11.94 to 219.62 cm, with a mean height of 113.68 cm (Tables 5 and 6;
Supplementary Tables S1 & S3). The PPP substantially distinguished across genotypes, with BFP65 (6.3) and BFP74 (47.78), respectively, having the highest and the lowest values, while the
mean was 21.13 (Tables 5 and 6; Supplementary Tables S1 & S3). The SPP and PM had grand means of 4.87 and 3.71, with a range of 5.32 to 6. BFP04 had the highest PL (6.14), followed by
BFP55, BFP65, and BFP14 (Tables 5 and 6; Supplementary Tables S1 & S3). Between genotypes, significant variance in HSW was displayed. The lowest HSW was shown by the BFP50, while the
highest HSW and mean were shown by the BFP44 (Tables 5 and 6; Supplementary Tables S1 & S3). Field pea genotypes' YPP varied from 0.75 to 26.16 g. BFP78 provided the greatest YPP,
followed by BFP77, BFP74, BFP72, BFP45, and BFP63. BFP77, BFP74, BFP72, and BFP63 were highly resistant to resistant and high yielding. The genotypes BFP78, BFP79, and BFP48, on the other
hand, were highly productive and only moderately resistant. BFP44, however, demonstrated high production potential and moderate susceptibility (Table 7 Supplementary Tables S2 & S4).
SHANNON WEAVER DIVERSITY ANALYSIS COMBINED WITH DESCRIPTIVE STATISTICS The diversity of the accessions on the quantitative characteristics shown in Table 6 was assessed using the descriptive
statistics (average, range, and standard deviation) and Hʹ. All of the genotypes' coefficients of variation fell into two categories: medium (between 10 and 20%), or low (below 10%).
The ninequantitative features' coefficients of variance varied from 1.04 to 12.15%. The YPP population had the highest CV (12.15%), followed by PPP (4.49), HSW (4.25), and PH (3.05).
The field pea genotype's high intra-varietal variability was demonstrated by the larger coefficients of variation for PH, PL, and DM. SPP (2.13–7.45) had the lowest diversity index
(0.80) across morphological traits while PH (11.94–219.62 cm) displayed the greatest diversity value (3.62). A high diversity index (H') was also seen in the yield-related
characteristics DF (1.00), DM (1.91), PPP (1.12), PL (1.93), HSW (0.88), and YPP (1.23). RESPONSE OF GENOTYPES TO THE ILLNESS OF POWDERY MILDEW The genotypes of field peas were tested in the
field at three development stages for natural infection with the powdery mildew disease caused by _Erysiphe polygoni_. From the early stages to flowering and pod setting, the disease's
severity increased (Table 7, Supplementary Tables S2 & S4, and Fig. 3). The responses of all genotypes examined to the illness caused by powdery mildew varied greatly. As a result,
among the genotype sources, 14.11 and 34.11% of the genotypes, respectively, were found to be highly resistant to _E. polygony_ infection. Hence forward, it was found that out of the total
85 field pea genotypes, twelve genotypes (BFP21, BFP29, BFP30, BFP31, BFP33, BFP34, BFP35, BFP52, BFP72, BFP73, BFP81 and BFP84) i.e. 14.11% were highly resistant (Disease Severity Scale 2)
(Table 8), twenty-nine (BFP04, BFP06, BFP13, BFP17, BFP18, BFP20, BFP23, BFP28, BFP32, BFP37, BFP38, BFP39, BFP40, BFP41, BFP42, BFP43, BFP55, BFP57, BFP59, BFP62, BFP63, BFP67, BFP68,
BFP69, BFP71, BFP74, BFP77, BFP80 and BFP82) i.e. 34.11% were resistant (Disease Severity Scale 3), twenty-five (BFP03, BFP10, BFP11, BFP12, BFP15, BFP19, BFP22, BFP24, BFP25, BFP26, BFP27,
BFP45, BFP46, BFP48, BFP50, BFP53, BFP54, BFP61, BFP70, BFP75, BFP76, BFP78, BFP79, BFP83 and BFP85) i.e. 29.41% were moderately resistance (Disease Severity Scale 4), eighteen (BFP01,
BFP02, BFP08, BFP14, BFP16, BFP36, BFP44, BFP58, BFP64, BFP65, BFP07, BFP09, BFP47, BFP49, BFP51, BFP56, BFP60 and BFP66) i.e. 21.76% were moderately susceptible (Disease Severity Scale 5
& 6) and three (BFP05) i.e. 1.17% were susceptible (Disease Severity Scale 7) (Table 8 and Fig. 3). The genotypes BFP21, BFP30, BFP31, BFP33, BFP34, BFP52, BFP72 were highly resistance
along with check variety BFP84 (BARI Motor-2). PRINCIPAL COMPONENT ANALYSIS (PCA) The results of PCA showed that only the first four principal components (PCs) had eigenvalues greater than
1.00 and that the highest variability across field pea genotypes for yield component attributes was around 88.4% (Fig. 4a,b). In field pea improvement programs, the traits corresponding to
these five PCs may be given the appropriate weight. Nine characteristics were used for the principal component analysis (Fig. 4b). 72.2% of the variance was explained by the first three
principal components (PC), which had values of 30, 23.9, and 18.3% for PC1, PC2, and PC3, respectively (Fig. 4a). Following the PC1 in terms of variety were the PC2, PC3, PC4, and PC5. The
earlier research by Hanci and Cebeci83 provided further support for the current investigation. The decision of how many variables to keep is aided by eigenvalues. According to Sharma54, the
number of variables is often equal to the sum of the eigenvalues. The first principal component (PC1) exhibited a variance of 30%, with the key positive contributions being YPP, HSW, PH, and
PPP, while the significant negative contributors were PL, DM, and SPP (Fig. 4c). The PC2 was mostly linked to yield parameters including DF, DM, and PPP, and accounted for 23.9% of the
overall variance (Fig. 4d). Figure 5 depicts the magnitude and direction of the quantitative features' contribution to the various main components. The PCA-biplot was created using the
first two PCs, which together accounted for 53.9% of the total variability (Fig. 5). The key yield and yield-attributing traits, however, grouped in trait clusters 2 and 3, such as HSW, PL,
and YPP, were mostly connected with and positively contributed to PC2 and PC3 (Figs. 4c,d, 5). Based on the features that contribute to yield, the genotypes in clusters 4 and 5 dominated
substantially and were favorably emphasized in both PC1 and PC2 (Fig. 5); in contrast, the genotypes in cluster 3 were strongly reflected by the traits DF, DM, and PL (Fig. 4). ANALYSIS OF
CLUSTER DISTANCES Based on D2 values, cluster analysis was used to divide the 85 genotypes into 5 distinctive groups. The number of genotypes in each cluster ranged from 1 to 37. Cluster 1
included the greatest number of genotypes (37) possible. Cluster 3 included the fewest number of genotypes only one. The genotypes in clusters 2, 4, and 5 were 28, 8, and 11, respectively
(Table 9 and Fig. 6). Prasad et al.1 and Kumar et al.84 noticed that great variety was present in the material under evaluation, as evidenced by the discrimination of genotyping lines into
so many distinct clusters. Table 9 and Fig. 6 provide estimates of intra- and inter-cluster distances for five clusters. Cluster 5 had the highest intra-cluster value (3.40), followed by
Cluster 2 (3.01), Cluster 1 (2.92), and Cluster 4 (2.06), indicating that these clusters' genotypes exhibit substantial genetic diversity (Table 9). Cluster 2 and Cluster 3 had the
greatest inter-cluster distance (11.89), followed by Cluster 1 and Cluster 3 (11.43) and Cluster 3 and Cluster 5 (5.35), indicating the greatest genotypic diversity in these clusters.
Therefore, it is suggested that improved segregants for high seed production and yield-contributing characteristics owing to non-allelic interactions are predicted if different genotypes
from these groups are employed in breeding programs along with other desired features. Cluster 3 and cluster 4 exhibited the least genetic diversity among their clusters, and they had the
same genetic architecture, as shown by the smallest inter-cluster difference between them (2.06), which was followed by cluster 4 and cluster 5 (3.40) (Table 9). In order to disrupt the
unfavorable relationship between yield and its associated qualities, such genotypes may also be employed in breeding programs to create bi-parental crosses between the most diversified and
close-proximity groups. GENOTYPES ARE GROUPED USING A HEATMAP-ORIENTED CLUSTERING PATTERN A heatmap is a two-dimensional data visualization technique that uses color to show the size of a
phenomenon. By examining color variation by intensity, the reader may observe how the phenomenon is categorized or varies through time. On a backdrop of mostly minor features, it depicts the
relative distribution of strongly expressed qualities (Figs. 6 and 7). The heatmap analysis produced two dendrograms as a consequence, one in the vertical direction representing the
germplasm accessions and the other in the horizontal direction reflecting the attributes that caused the diffusion. A heatmap is a two-dimensional data visualization technique that uses
color to show the size of a phenomenon. Eighty-five field pea genotypes were used in the current research, and using heatmap-oriented cluster analysis, the genotypes were divided into five
groups based on the average values of all the analyzed variables. The distribution of genotypes in the clusters showed that cluster 1 had the highest number of genotypes (37) and cluster 3
had the lowest number of genotypes (1) (Table 10 and Figs. 6 and 7). Three other groups might be seen on other dendrograms. DF and DM are two characters connected to Group 1. Three
characters (YPP, HSW, and PL) are related to Group 3. Three characters (SPP, PH, and PPP) are allies of Group 3 (Fig. 7). ANALYSIS OF CLUSTERED MEANS To determine the acceptable genotypic
diversity present across all study groups, a dendrogram of 85 field pea genotypes was created using the Ward clustering technique85. The significant degree of variation in cluster means for
several traits (Table 10) further supported the variety. Eight yield and yield contributing characteristics, along with PM cluster means, were evaluated (Table 10). The average comparison of
the various characters revealed significant variations among the clusters for each character. Cluster 5 had the highest mean for DF (81.45), followed by Cluster 3 (57), while Cluster 2 had
the lowest mean for a DF (47.04). The mean values for Cluster 3 were the greatest for DM, HSW, and PM. In cluster 4, the greatest means for PH (190.05), PPP (38.03), and YPP (20.65) were
found. Twenty-eight genotypes constituted the Cluster 2, which had the second highest number of genotypes. This cluster had smaller seeds than the others, was more moderately vulnerable to
powdery mildew, and had a lower YPP than the others. In cluster 2, none of the characters had the highest mean value. These results showed that certain clusters performed better for various
character types. ANALYSIS OF THE TRAIT ASSOCIATIONS There were very strong relationships among the traits that were assessed (Fig. 8). The coefficient of correlation is the measurement of
the linear relationship between two variables. The correlation of nine parameters under field conditions is presented in Fig. 8. PPP had positive significantly correlation with PH (r = 0.65,
_p_ < 0.001), YPP (r = 0.46, _p_ < 0.001), whereas it had negative nonsignificant correlation with DF, PM and SPP under field condition. PH demonstrated positive significant
correlation with YPP (r = 0.34, _p_ < 0.01), and DM (r = 0.24, _p_ < 0.05) while expressed negligible negative correlation with DF, PM and SPP. YPP expressed positive highly
significant correlation with HSW (r = 0.85, _p_ < 0.001), while it showed negligible negative correlation with DF and PM. DF showed highly significant correlation with DM (r = 0.54, _p_
< 0.001). Powdery mildew (PM) disease severity had nonsignificant positive correlation with HSW (r = 0.03) and SPP (0.15). whereas rest of the traits had a nonsignificant negative
correlation with powdery mildew disease severity (Fig. 8). PL represented highly positive correlation with SPP (r = 0.80, _p_ < 0.001). DISCUSSION An established crop breeding technique
for managing and successfully using plant genetic resources is genotype evaluation and screening for desired traits86. The degree of genetic diversity in agro-morphological variables
associated with yield determines the breeding strategy. Research on multivariate analysis and genetic diversity is essential for an effective genotype assessment. Plant genotypes exhibit a
great degree of morphological variation. A great degree of diversity is used to create better cultivars of important crops. Crops that are less popular or aren’t used as much need to benefit
from this development as well since they have a high degree of variability both inside and between their accessions (intra-variation) and within (inter-variation). All studied field pea
genotypes showed a variation across several traits which define a wide array of variability among the traits. A similar kind of variability for traits in rice was recorded by several
researchers87,88. Breeders may choose better lines for future development by using morphological characterization in diverse areas89,90,91. Analyzing morphological traits is a common method
for determining genetic diversity for many crop species, including field peas. It is successfully used on a variety of crops, including _Pisum sativum_73, mungbean48,92, black gram93,
amaranth94,95,96,97,98, Maize99, and field pea17,22,23. The findings of this research support highly the Shannon–Weaver diversity indices across field pea populations for the qualitative
attributes of tendril color, tendril twinning, immature pod color, flower color, and seed size. Shubha et al.100 and Rosero-Lombana et al.101 both found similar findings for field pea. Table
3 displays the results of the Shannon–Weaver diversity study for qualitative traits. Indicators of variety varied from 0.36 for leaf color to 0.89 for pod curvature. Seven qualitative
traits in this research have a high variety index (H = 0.60). The results of this research showed that there was little variation in leaf color and pod curvature across field pea genotypes,
in contrast to studies73,102. For the majority of the characteristics listed in Tables 4 and 5, a broad range of differences were observed. The findings are validated by other
research17,73,103 and show that features like PH, HSW, DF, PPP, DM and YPP, showed a very wide variation in mean performance. There was a lot of phenotypic diversity in seed yield and
related traits. The great degree of diversity in yield and its associated traits was highlighted by the mean performance in this research (Table 3), suggesting that future breeding programs
will have more opportunities to make use of these traits104. In keeping with the findings of the current study, several researchers including those of our own earlier study16,17 showed
significant heterogeneity in field pea yield and its associated characteristics. Significant differences for studied traits among the tested field pea genotypes might be due to the
difference in genetic composition of the tested genotypes. This indicates that the tested genotypes have different potential for field pea crop production for studied characters which
corroborated with the results of Mogiso105 and Gurmu106 in field pea. Significant variations across genotypes were also reported in literatures107,108,109,110,111,112 which supported the
current findings. Crops that are affected by the powdery mildew disease have large yield losses74,113,114. Field pea breeding for resistance to powdery mildew needs effective disease
screening techniques. When field peas are produced for seed, powdery mildew losses are greater because the disease becomes more severe as the crop matures114. No matter where they came from,
natural sources of resistance with varying disease responses to powdery mildew in field peas have been found in the germplasm32. Crops suffering from powdery mildew disease experience
significant losses of yield114. It is necessary to use the right disease-screening techniques while breeding field peas to resist powdery mildew. According to Teshome75, the powdery mildew
disease significantly reduces the yield potential of field pea germplasm grown throughout the world by generating an 86% loss. Therefore, the greatest alternative for crop breeding is
genetically based resistance to harmful diseases32,75,115. In order to choose powdery mildew-resistant lines for documentation and identification of top lines for widespread cultivation, the
chosen pea lines were also assessed for the powdery mildew disease. Researchers have used a variety of approaches to screen for powdery mildew29,75,115, but artificial inoculation has been
found to be the most reliable and effective29,105,115,116. In this study, the same eighty-five germplasms were tested in a field setting for resistance to powdery mildew. Out of the 85
germplasms listed in Tables 6 and 7, none were found to be extremely resistant (immune). However, 29 germplasms were observed to be resistant and 12 to be highly resistant. Eighteen
genotypes demonstrated moderately susceptible, while the remaining twenty-five germplasms exhibited moderate resistance. The BFP05 genotype showed susceptible to PM disease. In order to
better understand the level of genetic diversity and agronomic performance of resistant germplasm accessions, more information should be gathered29,117,118. The germplasm accessions, which
have high levels of resistance and agronomic superiority, may minimize the time necessary to eradicate the undesired genes via repeated backcrossing by plant breeders. Three basic selection
strategies including tandem selection, independent culling levels and index selection can be utilized for improvement of plants species in breeding programs. Tandem selection attempts to
improve a breeding germplasm for several traits by selecting one trait at one time for several generations, then another trait is focused on for next breeding cycle119. Identification of
diversity serves two roles: it helps to organize the identity and integrity of an ex-situ collection and it also provides a structure accessing this diversity for breeding efforts120. PCA is
a useful method for locating significant characteristics that have a bigger influence on the total variables, and each vector's coefficient indicates the percentage contribution of
each original variable that each principal component is linked to Sanni et al_._121. According to studies, the first three main components are often the most significant in showing the
patterns of variation among the various genotypes and the traits linked to genotype differentiation. Raji122 asserted that traits with coefficients greater than 0.3 (regardless of whether
they are positive or negative) are important, while traits with coefficients less than 0.3 are thought to have the least impact on the overall variation seen. This methodology was used in
the current study123. Based on the dendrogram produced by cluster analysis and PCA, the 85 genotypes of field pea were divided into five groups (Tables 9 and 10 and Fig. 6). Sharma103
determined a similar clustering pattern using PCA and hierarchical cluster analysis for 22 field pea genotypes. According to Euclidean distance, clusters mostly emerge following the origin
of genotypes or geographical locations. Most genotypes with the same geographic origin are clustered together, although a smaller number of genotypes with different origins are also included
in the same cluster. Understanding the link between variables may be aided by the use of multivariate statistical analysis, such as PCA. These might help determine the traits nature and
simplify data collection124. The first four principal components in this study's PCA analysis of the nine quantitative characteristics explained 88.4% of all variance, indicating a very
significant link between the features under investigation (Fig. 4a). The first PC was the most important, accounting for 30% of the variance on its own. Because of their significant
loadings, the features of YPP, HSW, PH, and PPP were crucial in the first PC for distinguishing the genotypes (Fig. 4c). Similar findings were found in a field pea crop by Chowdhury and
Mian125. A method of multivariate analysis known as PCA biplot combines characteristics and genotypes in two dimensions while eliminating overlapping variations from large, complicated data
sets, making it easier to identify key figures for selection (Fig. 5). As a result, PCA revealed distinct trait differentiation as well as significant variation across the five groups of the
85 field pea genotypes (Fig. 5). The traits PPP, HSW, PH, and YPP significantly contributed to describing the variations among the BFP74, BFP78, BFP76, BFP80, BFP75, BFP45, and BFP73
genotypes, and as a result, it will be possible to improve the genetic diversity of field pea genotypes through selection using these traits. Singh et al.113 claimed that while choosing the
kind of cluster to utilize for further selection and the pattern to use for hybridization, greater focus should be placed on the characteristic that provides the greatest divergence. The
correlation matrix of the observed qualities in Fig. 5 also confirmed the variability of traits determined by PCA biplot and cluster analysis. One of the widely used statistical methods for
categorizing items into groups that have a lot in common with other groups of objects is cluster analysis. The clusters will be useful for upcoming heterotic breeding since different sets of
alleles may affect their traits and performance125. According to earlier publications by Prasad et al.1 and Kumar et al.126, great variety was present in the material under evaluation, as
evidenced by the discrimination of genotyping lines into so many distinct clusters. Table 9 displays the estimated intra and inter-cluster distances for five clusters. Cluster 5 had the
largest intra-cluster distance, which was followed by clusters 2, 1, and 4, whereas clusters 2 and 3 had the greatest inter-cluster distance, which was followed by clusters 1 and 3 (Table
9). In cluster 4 with 8 genotypes, we observed that variables that contribute to PPP, PL, PH, and YPP were substantially higher (Table 10). The findings of this research showed that
yield-related positive and significant traits had the ability to enhance seed production. Since they demonstrated a favorable and statistically significant link with grain production, these
traits were taken into account throughout the selection process. Thus, the field pea hybridization program for a variety of applications might employ these genotypes of field pea as parental
sources. In conclusions, both multivariate statistical analysis tools showed the existence of wide genetic diversity among the landraces in the study for qualitative and quantitative
characteristics during the years 2022 and 2023. The results of the current research showed that there was enough genetic variation within and between genotypes, suggesting the prospect of
further genetic improvement in field pea yield and traits associated with yield. The studied qualitative and quantitative traits both revealed connections between one another. The findings
of the current study showed that there was significant variation in both seed yield and its related traits and resistance to powdery mildew diseases, suggesting the possibility of selecting
promising gene pools that could be used as direct sources or transferred through hybridization to genotypes with high yields but disease-prone traits. The BFP77, BFP74, BFP63, BFP62, BFP43,
and BFP80 genotypes were also high-yielding and resistant to PM, while check variety (BFP84) was highly resistance but lower yield; they could be selected as elite genotypes to pass to the
next yield trial or for crossing purposes. BFP78, BFP72, BFP79, and BFP48 genotypes were found to be high-yielding and moderately resistant to PM. For breeding reasons, elite genotypes might
be chosen from high-yielding and resistant gene pools (BFP77, BFP74, BFP63, and BFP62) and low-yielding and resistant gene pools (BFP50, BFP69, BFP53, BFP30, BFP57, and BFP65). The 85
genotypes were clearly divided into five groups of clusters using the dendrogram and heatmap-oriented cluster analysis, and there was substantial genetic variation. The genotypes BFP78,
BFP77, BFP74, BFP45, BFP79, and BFP80 were identified as promising for PPP and PL in relation to yield features. All four PCs had eigen values greater than one and displayed roughly 88.4%
variability. Therefore, these PCs received the attention they deserved for the following explanation. The PC1 displayed 30% of the overall variation, followed by the second and third
components, which accounted for 23.9 and 18.3% of the genotype-specific total variation, respectively. While YPP, HSW, PH, and PPP were associated with PC1, DF and DM predominated in PC2.
All potential pairs of clusters' genetic divergence were extremely significant. The selection of these features could be utilized as selection criteria to increase the seed yield of
field pea genotypes because PH, PPP, and HSW demonstrated a substantial positive connection with YPP. The examined gene pools were extremely varied, as evidenced by the inter-cluster D2
value, which ranged from 2.06 to 11.89, while cluster 5 had the greatest intra-cluster distance. The mean values for PH, PPP, PL, and YPP were the highest in Cluster 4 whereas SPP had the
lowest value (3.79) found in cluster 5. Maximum DM and HSW mean values were observed in clusters 5 and 3, respectively. Furthermore, it might be deduced that offspring from different
crossings should exhibit a broad range of genetic diversity and had a greater capacity to identify transgressive segregants in subsequent generations. The genetic variation of the genotypes
of field peas that were evaluated in this study might provide helpful information for further trait specific breeding initiatives. It is concluded that the germplasm tested in this
experiment had a high degree of resistance to powdery mildew, combined with enough genetic diversity and agronomic superiority, making it suitable for use in breeding field pea varieties
with both high yield and resistance to powdery mildew. This work used phenotypic selection for agronomic performance within field pea genotypes that would produce many useful field pea
breeding lines for the future. In the current investigation, six genotypes BFP77, BFP74, BFP63, BFP62, BFP43, and BFP80 compared to check BFP84 were found to be highly resistant with a
higher yield. These genotypes can be used to select field pea genotypes for the creation of molecular markers, mapping populations for molecular breeding, QTL identification for PM
resistance, and the development of PM-resistant varieties. DATA AVAILABILITY All data generated or analyzed during this study are included in this published article and its supplementary
information files. REFERENCES * Prasad, D., Nath, S., Lal, K., Jaiswal, A. & Yadav, V. P. Evaluation of Field pea (_Pisum_ _sativum_ L.) genotypes for genetic variability and divergence.
_Int. J. Che. Stud._ 6, 2288–2291 (2018). Google Scholar * Rana, J. C. _et al._ Screening of pea germplasm for resistance to powdery mildew. _Euphytica_ 189, 271–282 (2013). Article CAS
Google Scholar * [FAOSTAT] Food and Agriculture Organization. 2021. Production of pulse crops: top 10 dry pea producers in 2020. Statistical database.
http://www.fao.org/faostat/en/#data/QCL/visualized. * Pandey, A. K. _et al._ Omics resources and omics-enabled approaches for achieving high productivity and improved quality in pea (_Pisum_
_sativum_ L.). _Theor. Appl. Genet._ 134(3), 755–776 (2021). Article PubMed Google Scholar * FAO. Food and Agriculture Organization of the United Nations. Available online at
http://www.fao.org/faostat/en/#data/QC/visualize (2019). * Lamichaney, A. _et al._ Untangling the influence of heat stress on crop phenology, seed set, seed weight, and germination in field
pea (_Pisum_ _sativum_ L.). _Front. Plant Sci._ 12, 437 (2021). Article Google Scholar * Parihar, A. K., Rajesh Yadav, Amrit Lamichaney, R. K. Mishra, Anup Chandra, D. S. Gupta, Kuldeep
Tripathi, K. K. Hazra, and G. P. Dixit. "Field pea breeding." In _Fundamentals of Field Crop Breeding_, pp. 1237–1321. Singapore: Springer Nature Singapore (2022). * Azam, M. G.,
Iqbal, M. S., Hossain, M. A., Hossain, J. & Hossain, M. F. Evaluation of field pea (_Pisum_ _sativum_ L.) genotypes based on genetic variation and association among yield and yield
related traits under high Ganges River Floodplain. _Int. J. Plant Biol. Res._ 8(2), 1120 (2020). Google Scholar * [USDA] United State Department of Agriculture. World agricultural
production. Circular Series WAP 4–22, Foreign Agricultural Service, United State Department of Agriculture. pp. 37. https://apps.fas.usda.gov/psdonline/circulars/production.pdf. (2022). *
Kumari, T. & Deka, A. C. Potential health benefits of garden pea seeds and pods: a review. _Legum Sci._ 3, e82 (2021). Article CAS Google Scholar * Mohammed, Y. A. _et al._ Yield
performance and stability of dry pea and lentil genotypes in semi-arid cereal dominated cropping systems. _Field Crop. Res._ 188, 31–40 (2016). Article Google Scholar * BBS. Bangladesh
Bureau of Statisticst. Ministry of Planning, Statistics and Informatics Division. Government of the People’s Republic of Bangladesh (2022). * Parihar, A. K., Bohra, A. & Dixit, G. P.
Nutritional benefits of winter pulses with special emphasis on peas and rajmash. _Biofortification food Crop._ 43, 61–71 (2016). Article Google Scholar * Bhat, T. A., Gupta, M., Ganai, M.
A., Ahanger, R. A. & Bhat, H. A. Yield, soil health and nutrient utilization of field pea (_Pisum_ _sativum_ L.) as affected by phosphorus and Biofertilizers under subtropical conditions
of Jammu. _Int. J. Mod. Plant Anim. Sci._ 1, 1–8 (2013). CAS Google Scholar * Gregory, E. _et al._ _Field pea production A1166 (Revised)_ 1–6 (NDSU Ext. Serv. Fargo, 2016). Google Scholar
* Mamatha, R. M., Sharma, R. K., Bhardwaj, A. & Kumar, R. Genetic diversity study among garden pea (_Pisum_ _sativum_ var. hortense L.). _Genotypes._ 14, 911–915 (2022). Google Scholar
* Pratap, V., Sharma, V. & Kamaluddin, G. S. Assessment of genetic variability and relationship between different quantitative traits in field pea (_Pisum_ _sativum_ var. arvense)
genotype. _Leg. Res. An Int. J._ 43, 6 (2021). Google Scholar * Luitel, B. P., Pun, T. B. & Bhandari, B. B. Evaluation of growth and yield characters of garden pea genotypes at Dailekh,
Mid-Western. _Nepal. Hortic._ 15, 24–33 (2021). Article Google Scholar * Mahajan, R., Dar, A. A., Mukthar, S., Zargar, S. M., and Sharma, S. Pisum improvement against biotic stress:
Current Status and Future Prospects: Physiological, Molecular and Genetic Perspectives. 109–136 (2018). * Singh, K. S. _et al._ Estimation of correlation coefficient among yield and
attributing traits of field pea (_Pisum_ _sativum_ L.). _Legum. Res. Int. J._ 41, 20–26 (2018). Google Scholar * Hill, H. Utilization of dry beans and other pulses as ingredients in diverse
food products. _Dry Beans Pulses Prod. Process. Nutr._ 23, 307–329 (2022). Article Google Scholar * Parihar, A. K. _et al._ Potential of field pea as a nutritionally rich food legume
crop. In _Breeding for Enhanced Nutrition and Bio-Active Compounds in Food Legumes_ (eds Gupta, D. S. _et al._) 47–82 (Springer International Publishing, 2021). Chapter Google Scholar *
Parihar, A. K., Dixit, G. P., Bohra, A., Gupta, D. S., Singh, A. K., Kumar, N. (2020). Genetic advancement in field pea (_Pisum sativum_ L.): retrospect and prospect,” in Accelerated Plant
Breeding, eds S. S. Gosal and S. H. Wani (Cham: Springer), _Accel. Plant Breeding,_ 3, 283–341 (2020). * Toker, C. & Mutlu, N. Breeding for abiotic stresses. In _Biology and Breeding of
Food Legumes_ (eds Pratap, A. & Kumar, J.) 241–261 (CABI, 2011). https://doi.org/10.1079/9781845937669.0241. Chapter Google Scholar * FAO (2021). Food and Agriculture Organization
Statistics. Available online at: https: //www.fao.org/faostat/en/#data/QCL (accessed October, 2021). * Sulima, A. S. & Zhukov, V. A. War and peas: Molecular bases of resistance to
powdery mildew in pea (_Pisum_ _sativum_ L.) and other legumes. _Plants._ 11, 339 (2022). Article CAS PubMed PubMed Central Google Scholar * Warkentin, T. D., Rashid, K. Y. & Xue,
A. G. Fungicidal control of powdery mildew in field pea. _Can. J. Plant Sci._ 76, 933–935 (1996). Article CAS Google Scholar * Baiswar, P. _et al._ Molecular evidence of _Erysiphe_ _pisi_
on pea and E. _trifoliorum_ on white clover in northeast India. _Australas. Plant Dis. Notes_ 10, 1–3 (2015). Article Google Scholar * Nisar, M., Ghafoor, A., Khan, M. R. & Qureshi,
A. S. Screening of _Pisum_ _sativum_ L. germplasm against _Erysiphe_ _pisi_ Syd. _Acta Biol. Cracoviensia Ser. Bot._ 48, 33–37 (2006). Google Scholar * Ritika, B. & Utpal, D. An
overview of fungal and bacterial biopesticides to control plant pathogens/diseases. _African J. Microbiol. Res._ 8, 1749–1762 (2014). Article Google Scholar * Eklund, M. _et al._
Microsatellite markers for powdery mildew resistance in pea (_Pisum_ _sativum_ L.). _Hereditas_ 142, 86–91 (2005). PubMed Google Scholar * Fondevilla, S. & Rubiales, D. Powdery mildew
control in pea. A review. _Agron. Sustain. Dev._ 32, 401–409 (2012). Article CAS Google Scholar * Ghafoor, A. & McPhee, K. Marker-assisted selection (MAS) for developing powdery
mildew resistant pea cultivars. _Euphytica_ 186, 593–607 (2012). Article CAS Google Scholar * Biswas, P. S., Sarker, U., Bhuiyan, M. A. R. & Khatun, S. Genetic divergence in cold
tolerant irrigated rice (_Oryza_ _Sativa_ L.). _Agriculturists_ 4(1), 15–20 (2006). Google Scholar * Ali, M. A. _et al._ Estimation of genetic divergence in boro rice (_Oryza_ _sativa_ L.).
_Int. J. BioRes._ 16, 28–36 (2014). Google Scholar * Siddique, M.N.A., Sarker, U., Mian, M.A.K. Genetic diversity in restorer line of rice. In _Proceedings of the International Conference
on Plant Breeding and Seed for Food Security_; Bhuiyan, M.S.R., Rahman, L., Eds.; Plant Breeding and Genetics Society of Bangladesh: Dhaka, Bangladesh, 2009; pp. 137–142. * Nath, J. K.,
Sarker, U., Mian, M. A. K. & Hossain, T. Genetic divergence in T. _aman_ Rice. _Ann. Bangladesh Agric_ 12, 51–60 (2008). Google Scholar * Rai, P. K., Sarker, U., Roy, P. C. & Islam,
A. Character association in F4 generation of rice (_Oryza_ _sativa_ L.). _Bangladesh J. Plant Breed. Genet._ 26, 39–44 (2013). Article Google Scholar * Karim, D., Siddique, M. N. A.,
Sarker, U., Hasnat, Z. & Sultana, J. Phenotypic and genotypic correlation co-efficient of quantitative characters and character association of aromatic rice. _J. Biosci. Agric. Res._
1(1), 34–46 (2014). Article Google Scholar * Uyeda, J. C., Caetano, D. S. & Pennell, M. W. Comparative analysis of principal components can be misleading. _Syst. Biol._ 64, 677–689
(2015). Article CAS PubMed Google Scholar * Kumar, N., Paul, S. & Dhial, R. S. Study on genetic variability, heritability and genetic advance for agro-morphological traits of linseed
(_Linum_ _usitatissimum_ L.). _Res. Environ. Life Sci._ 9, 16–18 (2016). Google Scholar * Manjunatha, T., Bisht, I. & Bhat, K. Genetic structure of hull-less barley (_Hordeum_
_vulgare_ L. sub sp. vulgare) landrace populations from North-western Indian Himalayas. _Indian J. Biotechnol._ 10, 25–32 (2011). Google Scholar * Aghaei, M. J., Mozafari, J., Taleei, A.
R., Naghavi, M. R. & Omidi, M. Distribution and diversity of Aegilops tauschii in Iran. _Genet. Resour. Crop Evol._ 55, 341–349 (2008). Article Google Scholar * Karimi, H. R., Zamani,
Z., Ebadi, A. & Fatahi, M. R. Morphological diversity of Pistacia species in Iran. _Genet. Resour. Crop Evol._ 56, 561–571 (2009). Article Google Scholar * Malviya, N., Kumar, K. &
Upadhyay, D. K. Genetic divergence in Indian mustard (_Brassica_ _juncea_ L. Czern. & Coss). _Bangladesh J. Bot._ 50, 37–44 (2021). Article Google Scholar * Kavithamani, D., Yuvaraja,
A. & Selvi, B. Principal component analysis and grouping of sorghum (_Sorghum_ _bicolor_ L. Moench) gene pool for genetic diversity. _Electron. J. Plant Breed._ 10, 1426–1434 (2019).
Article Google Scholar * Chuchert, S., Nualsri, C., Junsawang, N. & Soonsuwon, W. Genetic diversity, genetic variability, and path analysis for yield and its components in indigenous
upland rice (_Oryza_ _sativa_ L. var. glutinosa). _Songklanakarin J. Sci. Technol._ 40, 609–616 (2018). Google Scholar * Azam, M. G. _et al._ Genetic Analysis in grain legumes [_Vigna_
_radiata_ (L.) Wilczek] for yield improvement and identifying heterotic hybrids. _Plants_ 11, 1774 (2022). Article CAS PubMed PubMed Central Google Scholar * Rahman, M. M. _et al._
Combining ability analysis and marker-based prediction of heterosis in yield reveal prominent heterotic combinations from diallel population of rice. _Agronomy_ 12, 1797.
https://doi.org/10.3390/agronomy12081797 (2022). Article CAS Google Scholar * Azad, A. K. _et al._ Evaluation of combining ability and heterosis of popular restorer and male sterile lines
for the development of superior rice hybrids. _Agronomy_ 12, 965. https://doi.org/10.3390/agronomy12040965 (2022). Article Google Scholar * Gonçalves, L. S., Rodrigues, R., Amaral, A. T.
Jr., Karasawa, M. & Sudre, C. P. Comparison of multivariate statistical algorithms to cluster tomato heirloom accessions. _Genet. Mol. Res._ 7, 1289–1297 (2008). Article PubMed Google
Scholar * Negash, K. Studies on genetic divergence in common bean (_Phaseolus vulgaris_ L.) introductions of Ethiopia. _An MSc Thesis Present. to Sch. Grad. Stud. Addis Abeba Univ._ 11, 46
(2006). * Rahman, A. _et al._ Studies on genetic parameters, correlation and path coefficient analysis in _ER_2 introgressed garden pea genotypes. _Legume Res._ 44, 621–626 (2021). Google
Scholar * Sharma, A., Sekhon, B. S., Sharma, S. & Kumar, R. Newly isolated intervarietal garden pea (_Pisum_ _sativum_ L.) progenies (F7) under northwestern Himalayan conditions of
India. _Exp. Agric._ 56, 76–87 (2020). Article Google Scholar * Kumar, R. & Kumar, M. Estimation of genetic divergence in garden pea (_Pisum_ _sativum_ _var_. Hortense L.) genotype to
facilitate the selection of potential parents for hybridization program. _Legume Res._ 39, 709–712 (2016). Google Scholar * Kumar, S. _et al._ Evaluation of seed yield and genetic
divergence in the germplasms of _Pisum_ _sativum_ L. var. Arvense. _J Pharmacogn Phytochem._ 6, 1016–1021 (2017). Google Scholar * Sarker, U. & Oba, S. Nutrients, minerals, pigments,
phytochemical, and radical scavenging activity in _Amaranthus blitum_ leafy vegetable. _Sci. Rep._ 10, 3868. https://doi.org/10.1038/s41598-020-59848-w (2020). Article ADS CAS PubMed
PubMed Central Google Scholar * Sarker, U. _et al._ Salinity stress ameliorates pigments, minerals, polyphenolic profiles, and antiradical capacity in lalshak. _Antioxidants_ 12, 173.
https://doi.org/10.3390/antiox12010173 (2023). Article CAS PubMed PubMed Central Google Scholar * Sarker, U. & Ercisli, S. Salt eustress induction in red amaranth (_Amaranthus
gangeticus_) augments nutritional, phenolic acids and antiradical potential of leaves. _Antioxidants_ 11, 2434. https://doi.org/10.3390/antiox11122434 (2022). Article CAS PubMed PubMed
Central Google Scholar * Sarker, U. _et al._ Colorant pigments, nutrients, bioactive components, and antiradical potential of danta leaves (_Amaranthus lividus_). _Antioxidants_ 11, 1206.
https://doi.org/10.3390/antiox11061206 (2022). Article CAS PubMed PubMed Central Google Scholar * Faysal, A. S. M. _et al._ Genetic variability, character association, and path
coefficient analysis in transplant Aman rice genotypes. _Plants_ 11, 2952. https://doi.org/10.3390/plants11212952 (2022). Article PubMed PubMed Central Google Scholar * Azam, M. D.,
Sarker, U. & Uddin, M. S. Screening maize (_Zea_ _mays_ L.) genotypes for phosphorus deficiency at the seedling stage. _Turk. J. Agric. For._ 46(6), 3.
https://doi.org/10.55730/1300-011X.3044 (2022). Article CAS Google Scholar * Hasan, M. J., Kulsum, M. U., Majumder, R. R. & Sarker, U. Genotypic variability for grain quality
attributes in restorer lines of hybrid rice. _Genetika_ 52, 973–989. https://doi.org/10.2298/GENSR2003973H (2020). Article Google Scholar * Hasan-Ud-Daula, M. & Sarker, U. Variability,
heritability, character association, and path coefficient analysis in advanced breeding lines of rice (_Oryza_ _sativa_ L.). _Genetika_ 52(2), 711–726. https://doi.org/10.2298/GENSR2002711H
(2020). Article Google Scholar * Hossain, M. A. _et al._ Integrating BLUP, AMMI, and GGE models to explore GE interactions for adaptability and stability of winter lentils (_Lens_
_culinaris_ Medik). _Plants_ 12, 2079. https://doi.org/10.3390/plants12112079 (2023). Article PubMed PubMed Central Google Scholar * Hasan, M. J. _et al._ Assessment of GGE, AMMI,
regression, and its deviation model to identify stable rice hybrids in Bangladesh. _Plants_ 11, 2336. https://doi.org/10.3390/plants11182336 (2022). Article PubMed PubMed Central Google
Scholar * Sarker, U., Oba, S., Alsanie, W. F. & Gaber, A. Characterization of phytochemicals, nutrients, and antiradical potential in slim amaranth. _Antioxidants_ 11, 1089.
https://doi.org/10.3390/antiox11061089 (2022). Article CAS PubMed PubMed Central Google Scholar * Sarker, U. _et al._ Phytonutrients, colorant pigments, phytochemicals, and antioxidant
potential of orphan leafy _Amaranthus_ species. _Molecules_ 27, 2899. https://doi.org/10.3390/molecules27092899 (2022). Article CAS PubMed PubMed Central Google Scholar * Sarker, U.,
Lin, Y. P., Oba, S., Yoshioka, Y. & Ken, H. Prospects and potentials of underutilized leafy Amaranths as vegetable use for health-promotion. _Plant Physiol. Biochem._ 182, 104–123.
https://doi.org/10.1016/j.plaphy.2022.04.011 (2022). Article CAS PubMed Google Scholar * Sarker, U. _et al._ Bioactive phytochemicals and quenching activity of radicals in selected
drought-resistant _Amaranthus tricolor_ vegetable amaranth. _Antioxidants_ 11, 578. https://doi.org/10.3390/antiox11030578 (2022). Article CAS PubMed PubMed Central Google Scholar *
Azam, M. G., Iqbal, M. S., Hossain, M. A. & Hossain, M. F. Stability investigation and genotype × environment association in chickpea genotypes utilizing AMMI and GGE biplot model.
_Genet. Mol. Res._ 19, 1–15 (2020). Google Scholar * UPOV, Union Internationale pour la Protection des Obtentions Vegetales. Protocol for distinctness, uniformity, and stability tests: peas
(_Pisum sativum_ L. Sensu lato). _CPVO-TP/007/1 Final. European Union, Genova_. (2003). * Shrestha, D. S., Chaudhary, J. N., Ghimire, K. H., Shrestha, J. & Bhattarai, M. Agro
Morphological characterization and diversity assessment of pea (_Pisum_ _Sativum_ L.) genotype conserved in genebank of Nepal. _ijrpr. com_ 4, 422–435 (2023). Article Google Scholar *
Yimam, K. Diversity analysis and identification of promising powdery mildew resistance genotypes in field pea (_Pisum_ _sativum_ L.). _Am. J. Biol. Environ. Stat._ 6, 7 (2020). Article
Google Scholar * Teshome, E. & Tegegn, A. Comparative study of powdery mildew (_Erysiphe_ _polygoni_) disease severity and its effect on yield and yield components of field pea (_Pisum_
_sativum_ L.) in the Southeastern Oromia. _Ethiopia. J Plant Pathol Microbiol_ 8, 410 (2017). Google Scholar * Singh, J., Dhall, R. K. & Aujla, I. S. Characterization of resistance
response of garden pea (_Pisum_ _sativum_ L.) against powdery mildew (_Erysiphe_ _pisi_ DC) in sub-tropical plains of India. _Sabrao J. Breed. Genet_ 47, 384–393 (2015). Google Scholar *
Shannon, C. E. _A Mathematical Model of Communication_ (University of Illinois Press. Urbana, Univ. Illinois Press, Urbana, IL, 1949). Google Scholar * Eticha, F., Bekele, E., Belay, G.
& Börner, A. Phenotypic diversity in tetraploid wheat collected from Bale and Wello regions of Ethiopia. _Plant Genet. Resour._ 3, 35–43 (2005). Article Google Scholar * R Core Team.
_R: A Language and Environment for Statistical Computing_ (Austria, Vienna, 2021). Google Scholar * Kassambara, A., Mundt, F., Kassambara, A. & Mundt, F. Factoextra: Extract and
visualize the results of multivariate data analyses. _Bug. Rep._ 1, 1–76 (2017). Google Scholar * Lê, S., Josse, J. & Husson, F. FactoMineR: An R package for multivariate analysis. _J.
Stat. Softw._ 25, 1–18 (2008). Article Google Scholar * Wei, T. & Simko, V. R Package “Corrplot”: Visualization of a correlation matrix (Version 0.84) (2017). * Hanci, F. & Cebeci,
E. Determination of morphological variability of different pisum genotypes using principal component analysis. _Legum. Res. Int. J._ 42, 162–167 (2019). Google Scholar * Kumar, S. Role of
genetic variability for seed yield and its attributes in linseed (_Linum_ _usitatissimum_ L.) improvement. _J. Pharmacogn. Phytochem._ 7, 266–268 (2019). ADS Google Scholar * Ward, J. H.
Hierarchical grouping to optimize an objective function. _J. Am. Stat. Assoc._ 58, 236–244 (1963). Article MathSciNet Google Scholar * Nietsche, S. _et al._ Variability in reproductive
traits in _Jatropha_ _curcas_ L. accessions during early developmental stages under warm subtropical conditions. _Glob. Change Biol. Bioenergy_ 7, 122–134 (2015). Article CAS Google
Scholar * Rashad, M. M. I. & Sarker, U. Genetic variations in yield and yield contributing traits of green amaranth. _Genetika_ 52, 393–407 (2020). Article Google Scholar * Kulsum,
U., Sarker, U. & Rasul, M. Genetic variability, heritability and interrelationship in salt-tolerant lines of T. aman rice. _Genetika_ 54, 761–776 (2022). Article Google Scholar *
Peratoner, G. _et al._ Variation of agronomic and qualitative traits and local adaptation of mountain landraces of winter rye (_Secale_ _cereale_ L.) from Val Venosta/Vinschgau (South
Tyrol). _Genet. Resour. Crop Evol._ 63, 261–273 (2016). Article Google Scholar * Moradi, R., Pourghasemian, N. & Naghizadeh, M. Effect of beeswax waste biochar on growth, physiology
and cadmium uptake in saffron. _J. Clean. Prod._ 229, 1251–1261 (2019). Article CAS Google Scholar * Dewi, N., Nugroho, K., Terryana, R. T. & Lestari, P. Evaluation of SSR and
important agronomical characters of promising mutant lines of Soybean. _Biodiversitas J. Biol. Divers._ https://doi.org/10.13057/biodiv/d210137 (2020). Article Google Scholar * Azam, M. G.
_et al._ Genetic analyses of mungbean [_Vigna_ _radiata_ (L.) Wilczek] breeding traits for selecting superior genotype(s) using multivariate and multi-traits indexing approaches. _Plants_
12, 1984 (2023). Article PubMed PubMed Central Google Scholar * Gayacharan, A. _et al._ Understanding genetic diversity in blackgram [_Vigna_ _mungo_ (L.) Hepper] collections of Indian
National Genebank. _Genet. Resour. Crop Evol._ 69, 1–7 (2022). Article Google Scholar * Sarker, U., Islam, M. T., Rabbani, M. G. & Oba, S. Genotypic diversity in vegetable amaranth for
antioxidant, nutrient and agronomic traits. _Indian J. Genet. Pl. Breed_ 77, 173–176 (2017). Article Google Scholar * Sarker, U., Islam, M. T., Rabbani, M. G. & Oba, S. Phenotypic
divergence in vegetable amaranth for total antioxidant capacity, antioxidant profile, dietary fiber, nutritional and agronomic traits. _Acta Agric_. _Scand. Sect. B- Soil Plant Sci._ 68,
67–76 (2018). CAS Google Scholar * Sarker, U., Azam, M., Talukder, M. & Alam, Z. Genetic variation in mineral profiles, yield contributing agronomic traits, and foliage yield of stem
amaranth. _Genetika_ 54, 91–108 (2022). Article Google Scholar * Sarker, U. _et al._ Nutritional and bioactive properties and antioxidant potential of _Amaranthus tricolor,_ _A_.
_lividus_, _A_ _viridis_, and _A_. _spinosus_ leafy vegetables. _Heliyon_ 10(9), 30453. https://doi.org/10.1016/j.heliyon.2024.e30453 (2024). Article CAS Google Scholar * Jahan, N. _et
al._ Evaluation of yield attributes and bioactive phytochemicals of twenty amaranth genotypes of Bengal floodplain. _Heliyon_ 9(9), 19644. https://doi.org/10.1016/j.heliyon.2023.e19644
(2023). Article Google Scholar * Azam, M. G., Islam, S., Hossain, M. G. & Rohman, M. M. Molecular assessment of maize inbred lines (_Zea_ _mays_ L.) using microsatellite markers.
_Bangladesh J. Agric. Res._ 43, 533–542 (2018). Article Google Scholar * Shubha, K., Kaur, V. & Dhar, S. Genetic diversity assessment in garden pea (_Pisum_ _sativum_ L.) germplasm
through principal component analysis. _Int. J. Chem. Stud._ 7, 482–486 (2019). CAS Google Scholar * Rosero-Lombana, V. & Checa-Coral, O. Morphological characterization and hierarchical
classification of 40 bush pea genotypes (_Pisum_ _sativum_ L.). _Rev. Colomb. Ciencias Hortícolas_ 15, e12078–e12078 (2021). Article Google Scholar * Shah, K. A., Liaqat, S., Asif, A.,
Qaizar, A. & Zhou, L. Genetic variability and heritability studies for leaf and quality characters in flue cured Virginia tobacco. _Academia J. Agr. Res._ 3, 44–48 (2015). Google Scholar
* Sharma, S., Chaudhary, D. R. & Sharma, A. Multivariate analysis for early genotypes of garden pea under mid hill condition of himachal pradesh. _Curr. J. Appl. Sci. Technol._ 14,
567–571 (2022). Google Scholar * Krishna, T. G., Kumar, A. & Adan, F. Morphological Diversity for Yield and Its Component Traits in Mungbean [_Vigna_ _radiata_ (L.) Wilczek]. _Curr. J.
Appl. Sci. Technol._ 12, 34–41 (2020). Article Google Scholar * Gurmu, G. N., Mulisa, T. B., Gemechu, A. L., Amena, K. G. & Terfa, G. N. Evaluation of field pea (_Pisum_ _sativum_ L.)
varieties for yield and yield-related traits. _Sarhad J. Agri._ 38, 1219–1227 (2022). Google Scholar * Mogiso, M. Adaptation and performance on yield and yield components of field pea
(_Pisum_ _sativum_ L.) varieties at Adiyo district, Southwestern Ethiopia. _J. Biol. Agric. Healthcare._ 7, 42–46 (2017). Google Scholar * Sarker, U. _et al._ Nutritional and bioactive
properties and antioxidant potential of _Amaranthus_ _tricolor_, _A_. _lividus_, _A_ _viridis_, and _A_. _spinosus_ leafy vegetables. _Heliyon_ 10(9), e30453.
https://doi.org/10.1016/j.heliyon.2024.e30453 (2024). Article CAS PubMed PubMed Central Google Scholar * Islam, M. R. _et al._ Potassium augments growth, yield, nutrient content, and
drought tolerance in mung bean (_Vigna_ _radiata_ L. Wilczek.). _Sci. Rep._ 14, 9378. https://doi.org/10.1038/s41598-024-60129-z (2024). Article ADS CAS PubMed PubMed Central Google
Scholar * Habib, M. A. _et al._ Climate-smart rice (_Oryza_ _sativa_ L.) genotypes identification using stability analysis, multi-trait selection index, and genotype-environment interaction
at different irrigation regimes with adaptation to universal warming. _Sci. Rep._ 14, 13836. https://doi.org/10.1038/s41598-024-64808-9 (2024). Article ADS CAS PubMed PubMed Central
Google Scholar * Tarafder, S. _et al._ Influence of foliar spray and post-harvest treatment on head yield, shelf-life, and physicochemical qualities of Broccoli. _Front. Nutr_ 10, 1057084.
https://doi.org/10.3389/fnut.2023.1057084 (2023). Article CAS PubMed PubMed Central Google Scholar * Prodhan, M. M. _et al._ Foliar application of GA3 stimulates seed production in
cauliflower. _Agronomy_ 12, 1394. https://doi.org/10.3390/agronomy12061394 (2022). Article CAS Google Scholar * Hossain, M. N. _et al._ Influence of salinity stress on color parameters,
leaf pigmentation, polyphenol and flavonoid contents, and antioxidant activity of _Amaranthus lividus_ leafy vegetables. _Molecules_ 2022, 27. https://doi.org/10.3390/molecules27061821
(1821). Article CAS Google Scholar * Singh, A. & Tewari, N. Predictors of linseed improvement identified through correlation and path coefficient analysis. _Curr. Adv. Agric. Sci.
Int. Journal_ 7, 114 (2015). Article Google Scholar * Ahmad, Z., Ghafoor, A., Iqbal, S. M. & Iqbal, M. S. Yield potential of local and exotic germplasm with special reference to
powdery mildew disease in peas [_Pisum_ _sativum_ (L.)]. _Pak. J. Bot._ 33, 251–255 (2001). Google Scholar * Iqbal, A., Shah, S., Nisar, M. & Ghafoor, A. Morphological characterization
and selection for high yielding and powdery mildew resistant pea (Pisum sativum) lines. _Sains Malaysiana_ 46, 1727–1734 (2017). Article CAS Google Scholar * Sillero, J. C. _et al._
Screening techniques and sources of resistance to rusts and mildews in grain legumes. _Euphytica_ 147, 255–272 (2006). Article Google Scholar * Ceyhan, E. & Avci, M. A. Combining
ability and heterosis for grain yield and some yield components in pea (_Pisum_ _sativum_ L.). _Pakistan J. Biol. Sci._ 8, 1447–1452 (2005). Article Google Scholar * Raturi, A., Singh, S.
K., Sharma, V. & Pathak, R. Genetic variability and interrelationship among qualitative and quantitative traits in mungbean. _Legum. Res._ 37, 1–10 (2014). Article Google Scholar *
Archangi, A., Mohammadi-Nejad, G. & Heidari, B. Assessing genetic diversity and aggregate genotype selection in a collection of cumin (Cuminum cyminum L.) accessions under drought
stress: Application of BLUP and BLUE. _Scientia Horticulturae_ 299, 111028. https://doi.org/10.1016/j.scienta.2022.111028 (2022). Article CAS Google Scholar * Bagheri, M. _et al._
Analysis of genetic diversity in a collection of Plantago species: Application of ISSR markers. _J. Crop Sci. Bio._ 25, 1–8 (2022). Article CAS Google Scholar * Sanni, K. A., Fawole, I.,
Guei, R. G., Ojo, D. K. & Somado, E. A. Geographical patterns of phenotypic diversity in Oryza sativa landraces of Côte d’Ivoire. _Euphytica_ 160, 389–400 (2008). Article Google Scholar
* Raji, A. A. Assessment of genetic diversity and heterotic relationship in African improved and local cassava (_Manihot esculenta_ Crantz) germplasm. PhD Thesis, University of Ibadan,
Nigeria, (2002). * Jindal, Y., Yadav, R. & Phogat, D. S. Principal component analysis and determination of the selection criteria in fodder cowpea (_Vigna_ _unguiculata_ (L) Walp.)
genotypes. _Range Manag. Agrofor._ 39, 191–196 (2018). Google Scholar * Al-Sayed, H. M., Fateh, H. S., Fares, W. M. & Attaya, A. S. Multivariate analysis of sugar yield factors in sugar
cane. _Am. J. Sustain. Agric._ 6, 44–50 (2012). Google Scholar * Chowdhury, M. A. Z. & Mian, M. A. K. Genetic divergence in the field pea (_Pisum sativum_ L.). _Annals Bangladesh
Agric._ 6, 1–6 (1996). Google Scholar * Kumar, T. N. V. _et al._ Studies on genetic variability, heritability and genetic advance in garden pea (_Pisum_ _sativum_ L.) varieties. _Int. J.
Curr. Microbiol. Appl. Sci._ 8, 3032–3038 (2019). Article Google Scholar Download references ACKNOWLEDGEMENTS The authors sincerely thank Bangladesh Agricultural Research Institute (BARI)
for providing research facilities and financial support for this study. They also thank pulses research team members of Pulses Research Centre, Ishurdi, for their kind assistance in the
proper execution of these trials at their fields and for recording observations on field pea reaction meticulously. The authors would like to extend their sincere appreciation to the
Researchers Supporting Project Number (RSP2024R194), King Saud University, Riyadh, Saudi Arabia. AUTHOR INFORMATION AUTHORS AND AFFILIATIONS * Pulses Research Centre, Bangladesh Agricultural
Research Institute, Ishurdi, Pabna, 6620, Bangladesh Mohammad Golam Azam * Department of Genetics and Plant Breeding, Faculty of Agriculture, Bangabandhu Sheikh Mujibur Rahman Agricultural
University, Gazipur, 1706, Bangladesh Umakanta Sarker * Department of Genetics and Plant Breeding, Faculty of Agriculture, Bangladesh Agricultural University, Mymensingh, 2202, Bangladesh
Mohammad Amir Hossain * Pulses Research Sub-Station, Bangladesh Agricultural Research Institute, Gazipur, 1701, Bangladesh A. K. M. Mahabubul Alam * Agronomy Division, Regional Agricultural
Research Station, Bangladesh Agricultural Research Institute, Pabna, 6620, Bangladesh Mohammad Rafiqul Islam * Department of Agronomy, Iowa State University, Ames, IA, 50010, USA Nazmul
Hossain * Department of Botany and Microbiology, College of Science, King Saud University, Riyadh, Saudi Arabia Saud Alamri Authors * Mohammad Golam Azam View author publications You can
also search for this author inPubMed Google Scholar * Umakanta Sarker View author publications You can also search for this author inPubMed Google Scholar * Mohammad Amir Hossain View author
publications You can also search for this author inPubMed Google Scholar * A. K. M. Mahabubul Alam View author publications You can also search for this author inPubMed Google Scholar *
Mohammad Rafiqul Islam View author publications You can also search for this author inPubMed Google Scholar * Nazmul Hossain View author publications You can also search for this author
inPubMed Google Scholar * Saud Alamri View author publications You can also search for this author inPubMed Google Scholar CONTRIBUTIONS M.G.A. and U.S. initiated the research work and
conceived the study; M.G.A. and U.S. performed the experiments; M.G.A. and U.S. performed statistical analysis; M.G.A., U.S., M.A.H., A.K.M.M., M.R.I., N.H., and S.A. drafted, edited,
interpreted data, and prepared the manuscript. U.S., N.H., and S.A. contributed to revising the manuscript and English editing the revised manuscript. CORRESPONDING AUTHOR Correspondence to
Umakanta Sarker. ETHICS DECLARATIONS COMPETING INTERESTS The authors declare no competing interests. ADDITIONAL INFORMATION PUBLISHER'S NOTE Springer Nature remains neutral with regard
to jurisdictional claims in published maps and institutional affiliations. SUPPLEMENTARY INFORMATION SUPPLEMENTARY INFORMATION. RIGHTS AND PERMISSIONS OPEN ACCESS This article is licensed
under a Creative Commons Attribution 4.0 International License, which permits use, sharing, adaptation, distribution and reproduction in any medium or format, as long as you give appropriate
credit to the original author(s) and the source, provide a link to the Creative Commons licence, and indicate if changes were made. The images or other third party material in this article
are included in the article's Creative Commons licence, unless indicated otherwise in a credit line to the material. If material is not included in the article's Creative Commons
licence and your intended use is not permitted by statutory regulation or exceeds the permitted use, you will need to obtain permission directly from the copyright holder. To view a copy of
this licence, visit http://creativecommons.org/licenses/by/4.0/. Reprints and permissions ABOUT THIS ARTICLE CITE THIS ARTICLE Azam, M.G., Sarker, U., Hossain, M.A. _et al._ Phenotypic
diversity in qualitative and quantitative traits for selection of high yield potential field pea genotypes. _Sci Rep_ 14, 18561 (2024). https://doi.org/10.1038/s41598-024-69448-7 Download
citation * Received: 18 February 2024 * Accepted: 05 August 2024 * Published: 09 August 2024 * DOI: https://doi.org/10.1038/s41598-024-69448-7 SHARE THIS ARTICLE Anyone you share the
following link with will be able to read this content: Get shareable link Sorry, a shareable link is not currently available for this article. Copy to clipboard Provided by the Springer
Nature SharedIt content-sharing initiative