Play all audios:
ABSTRACT The COVID-19 outbreak put a significant pressure on limited healthcare resources. The specific number of people that may be affected in the near future is difficult to determine. We
can therefore deduce that the corona virus pandemic’s healthcare requirements surpassed available capacity. The Internet of Things (IoT) has emerged an crucial concept for the advancement
of information and communication technology. Since IoT devices are used in various medical fields like real-time tracking, patient data management, and healthcare management. Patients can be
tracked using a variety of tiny-powered and lightweight wireless sensor nodes which use the body sensor network (BSN) technology, one of the key technologies of IoT advances in healthcare.
This gives clinicians and patients more options in contemporary healthcare management. This study report focuses on the conditions for vacating beds available for COVID-19 patients. The
patient’s health condition is recognized and categorised as positive or negative in terms of the Coronavirus disease (COVID-19) using IoT sensors. The proposed model presented in this paper
uses the ARIMA model and Transformer model to train a dataset with the aim of providing enhanced prediction. The physical implementation of these models is expected to accelerate the process
of patient admission and the provision of emergency services, as the predicted patient influx data will be made available to the healthcare system in advance. This predictive capability of
the proposed model contributes to the efficient management of healthcare resources. The research findings indicate that the proposed models demonstrate high accuracy, as evident by its low
mean squared error (MSE), root mean squared error (RMSE), and mean absolute error (MAE). SIMILAR CONTENT BEING VIEWED BY OTHERS HEART FAILURE PATIENTS MONITORING USING IOT-BASED REMOTE
MONITORING SYSTEM Article Open access 06 November 2023 SMART OXYGEN MONITORING IN HOSPITALS: A PILOT STUDY DURING COVID-19 Article Open access 25 January 2025 A NOVEL HEALTH MONITORING
SYSTEM FOR VITAL SIGNS USING IOT Article Open access 19 August 2024 INTRODUCTION Because of the potential for SARS coronavirus to spread, it is critical to separate healthcare services for
COVID and non-covid patients. Treating both groups in the same facility could result in the infection spreading rapidly. However, this approach requires extensive testing with many
individuals and the availability of hospitals with critical care infrastructure that can be turned into COVID facilities. The high dependency unit (HDU) and intensive care unit (ICU) should
have more beds in the COVID facilities. As a result, ventilators, vital monitors, pulse oximeters, infusion pumps, non-invasive ventilators, and a continual supply of oxygen are in high
demand. Aside from treating moderate to severe symptomatic patients, another important consideration is the infrastructure to reduce the burden on already overburdened healthcare facilities
caused by asymptomatic or mildly infected cases, which account for nearly 80% of infected patients. All over the world, life expectancy has grown steadily and has been affected by this
disease outbreak. In the last few decades, the COVID-19 pandemic has resulted in a significant increase in critically ill older people and other patients1. Ensuring a good standard of life
for older people has become a major social problem. Innovative healthcare innovations and resources are being enabled by the rapid proliferation of information and communication
technologies, which promise to address the ex-listing issues. IoT has evolved as one of the most influential connectivity concepts of the twenty-first century and industry 4.02. Because of
its interaction and computational capacities, all artifacts in our everyday lives are part of the web in the IoT world. IoT broadens and expands the definition of the Internet3. IoT enables
seamless interactions between various types of devices, such as medical sensors, video surveillance, and household appliances4. As a result, IoT has become more productive in various
sectors, including health services or healthcare systems. IoT in healthcare refers to a variety of low-cost sensors (wearable, implanted, and environmental) that enable older people to
access current medical healthcare services from anywhere, at any time5. Furthermore, it significantly increases the quality of life of elderly patients and other patients who need urgent
treatment. One of the most imperative technologies is the IoT-oriented, modern health system in the body sensor network (BSN)6. It is essentially a series of low- and lightweight wireless
sensor networks that control the functions of the human body and the environment. BSN nodes are used to gather confidential information (critical to life) and can function in extreme
conditions in the healthcare system. BSN has made patient tracking possible by improving its use in healthcare applications. Several wireless health studies and initiatives have recently
been suggested ensuring a continuous patient tracking process for the health monitoring system, in-ambulatory, in-clinical and open-air environment7. The body sensor network allows contact
with the base station between invasive procedures. An on-body network of sensor systems, on the other hand, enables the communication between the wearable and the non-invasive sensors8. When
a BSN Care server collects data from the local processing unit from an individual (which uses several bio-sensors), the BSN server then feeds and analyses the BSN data into the database9.
Depending on the level of anomalies, it could then communicate with the family members, the local doctor, or even an emergency department of a regional health facility10. When a person (not
necessarily a patient) wears multiple biosensors on their body, the BSN server receives regular updates via local processing units from these sensors11. These data are used to find the
severity in the patients and reflect the requirements of early-stage treatment of the patients; this leads to the need for the availability of beds and ventilators in that particular health
care location. LITERATURE REVIEW This section discusses the various literatures reviewed in the same field. The three parameters has been considered for the literature review analysis, and
the same has been discussed in the Table 1, and these are High dimentional data, demographic information, and hospital admission management.As, in the context of COVID-19 healthcare
management, high-dimensional data, demographic information, and hospital admission management play crucial roles in optimizing patient care and resource allocation. High-dimensional data
refers to complex datasets with numerous features, such as medical history, symptoms, lab results, imaging scans, and real-time monitoring from IoT healthcare devices. This data helps in
predicting disease severity, identifying high-risk patients, and improving treatment strategies using AI and machine learning. Demographic information, including age, gender, ethnicity,
socioeconomic status, and pre-existing conditions, is essential for understanding vulnerable populations, tracking infection trends, and prioritizing vaccination efforts, which also adds the
weitage into the dataset for getting better results. It enables healthcare providers and policymakers to design targeted interventions for different demographic groups. Hospital admission
management, on the other hand, involves tracking bed and ventilator availability, ICU occupancy, and patient discharge planning. Efficient management of hospital resources during COVID-19
ensures that healthcare systems are not overwhelmed, improves patient flow, and enhances overall care delivery. AI-driven forecasting models can leverage these factors to predict patient
surges, optimize resource allocation, and support data-driven decision-making in pandemic response efforts and also for deciding on many more healthcare-related queries. Table 1 presents the
parameters selected for performing the literature review. Various machine learning and artificial intelligence techniques have been extensively utilized to analyze vast amounts of
COVID-19-related data, enabling accurate predictions of disease evolution, patient risk assessment, and healthcare resource optimization. These advanced computational methods focuses on
high-dimensional datasets, incorporating medical history, laboratory-tests findings, imaging results, and real-time patient monitoring to enhance diagnostic accuracy and treatment
strategies. Additionally, AI-driven models assist in forecasting infection trends, identifying potential outbreaks, and optimizing hospital admission management to prevent healthcare system
overload. A comprehensive discussion and detailed analysis of these methodologies, along with their impact on COVID-19 healthcare management, have been presented and systematically
highlighted in Table 2. Liew et al.12 utilized Random Forest (RF), XGBoost, and AdaBoost on a selection of 14 parameters to enhance predictive modeling. Similary, in another research article
by Xiang et al.13 applied SHAP (Shapley Additive Explanations) values to quantify the impact of each variable on predictions, with non-normal data reported using the median and
interquartile range (IQR), while normal data were expressed as mean ± standard deviation (SD). Likewise, Park et al.14 developed and validated a Random Forest-based machine learning model to
predict delirium in hospitalized COVID-19 patients. A neural network-based fusion approach was introduced by Farahat et al.15, where Gibbs energy estimates from three Markov–Gibbs models
were combined to optimize patient decision-making. Elaraby et al.16 designed a cloud-based platform leveraging modern AWS services to ensure high availability, elasticity, coverage,
configurability, and reliability. Meanwhile, Cai et al.17 employed Deep Long Short-Term Memory (LSTM) models to capture dynamic changes in disease severity, clinical outcomes, and Spike
antibody levels. In an effort to enhance interpretability, Solayman et al.18 incorporated Explainable Artificial Intelligence (AI) using the LIME (Local Interpretable Model-agnostic
Explanations) framework to provide transparency in prediction results. For classification tasks, Li et al.19 developed a Gradient Boosting Decision Tree (GBDT) and Logistic Regression (LR)
model for binary classification. Hasan et al.20 focused on forecasting COVID-19 trends using data acquisition techniques and the ARIMA model to predict active cases, positive case rates, and
death rates. Additionally, Famiglini et al.21 demonstrated the effectiveness of the Support Vector Machine (SVM) model, which exhibited strong performance in discrimination, calibration,
and utility. To address segmentation, diagnosis, and prediction challenges, Liu et al.22 employed widely used Convolutional Neural Network (CNN) models, including ResNet, DenseNet, VGG,
Inception, EfficientNet, U-Net, V-Net, and U-Net++. Lastly, Xu et al.23 assessed model performance using tenfold cross-validation and external tests, where datasets were divided into 9 parts
for training and 1 part for validation, ensuring robust evaluation. These studies collectively contribute to the growing body of research aimed at utilizing AI-driven methodologies for
improving COVID-19 diagnosis, prediction, and patient management. MOTIVATION AND NOVELTY The coronavirus disease (COVID-19) outbreak has spread globally, posing a significant threat to
global healthcare organizations. Due to this, the healthcare systems in India are facing lots of problems. As every work is done using a manual process. The Invention of IoT can prove to be
a complete factor for the Indian healthcare organization. This motivated us to come up with a proposed scheme. The scheme monitors the patient’s current health recovery process without the
physical presence of the human being. The scheme manages the total count of available beds and ventilators in the healthcare system. Also, it calculates how many patients can be accommodated
in the healthcare organizations for better services, helping the elderly patients get managed treatment in the hospital. RESEARCH CONTRIBUTION The role of disease prevention and control is
more difficult as the COVID-19 epidemic has spread across the world. In this paper, we present a technological framework for reacting to the COVID-19 epidemic from a health informative
perspective to include theoretical and practical references to other countries on how health information technology can respond to the COVID-19 epidemic for various public health emergencies
and disasters. IoT is used to identify the availability of beds and ventilators in healthcare organizations. Hence, the following are the contributions of this research paper based on the
proposed framework IOT-BVM. The proposed approach smoothly solved the allotment of beds in the healthcare organization. The availability of the beds supports the emergency services if the
patient’s information is present in advance, informs the healthcare systems regarding their capacity, and makes the information available on demand.The IoT-based framework and its analysis
system will quickly emanate messages to the required person to decide on a time. The performance of the proposed scheme is validated against the mentioned methodologies. ORGANIZATION In this
section, the introduction of the research article has been presented, encompassing an in-depth discussion of the literature review, motivation, and contributions. “Methodology” section
focuses on the methodology, providing a comprehensive overview. Subsequently, “Proposed framework and its analysis” section elaborates on the proposed architecture, including its flowchart
and algorithms, followed by a discussion of the experimental results. In “Conclusion” and “Future work” sections, the conclusion and future directions have been addressed, concluding with
the references. METHODOLOGY IoT-based bright pulse oximeter: A physician can track a patient remotely using an oximeter connected to an Internet of Things (IoT) device. This acts as a
real-time warning system that can warn patients if they’re in danger. IoT-based body temperature measurement device (temperature sensor): The unit is small and convenient, and it runs on a
3.3 V battery cell. We can forecast a time series using the ARIMA model by looking at the past values of the series. A time series is a set of measurements taken at regular intervals.
Forecasting is the next step in the process, and it involves predicting the series’ future values. The fundamental business planning, sourcing, and development activities are all guided by
forecasting24. Any forecasting errors can affect the entire supply chain or any business context. As a result, it’s essential to get the predictions right to save money and achieve success.
A time series can now be divided into two forms of forecasting25. Univariate Time Series Forecasting is when you use only the past values of a time series to estimate future matters.
Multi-Variate Time Series Forecasting is when you use predictors other than the series (also known as exogenous variables) to forecast. ARIMA, which stands for “Auto-Regressive Integrated
Moving Average,” is a classification method that “explains” a particular time series based on its previous values, i.e., its hick-ups and stagnated. Prediction error, results in an equation
that can be used to forecast future information. An ARIMA model is represented by 3 terms: a, b, and c. Where a= the AR term’s sequence, b= the MA term’s sequence and c= the number of
differences that must be present in order for the time series to become stationary. A pure Auto Regressive (AR only) model is one in which _X__t_ is solely determined by its own lags.
_X__t_, in other words, is a feature (or function) of the lags of _X_′_t_. $$X_{t} = \alpha + \beta_{1} X_{t - 1} + \beta_{2} X_{t - 2} + \cdots + \beta_{p} X_{t - p} + \varepsilon_{1}$$ (1)
where _X__t_1 is the series’ lag1, _β_ is the lag1 coefficient calculated by the model, and _α_ is the intercept term estimated by the model. A pure Moving Average (MA only) model, on the
other hand, is one in which _X__t_ is solely determined by the lagged forecast errors. $$X_{t} = \alpha + \varepsilon_{t} + \phi_{{1}} \varepsilon_{t - 1} + \phi_{{2}} \varepsilon_{t - 2} +
\cdots + \phi_{q} \varepsilon_{t - q}$$ (2) The errors of the autoregressive models of the corresponding lags are represented by the error terms. The errors _ε__t_ and _ε__t−_1 are the
results of the Equations (3) and (4). $$X_{t} = \beta_{{1}} X_{t - 1} + \beta_{{2}} X_{t - 2} + \cdots + \beta_{0} X_{0} + \varepsilon_{t}$$ (3) $$X_{t - 1} \beta_{{1}} X_{t - 2} +
\beta_{{2}} X_{t - 3} + \cdots + \beta_{0} X_{0} + \varepsilon_{t - 1}$$ (4) AR and MA were the models of the ARIMA. So here’s what an ARIMA model’s equation looks like. An ARIMA model is
one in which the time series has been differenced at least once to make it stationary, and the AR and MA terms have been combined. The equation is presented in Equation (5). $$X_{t} = \alpha
+ \beta_{{1}} X_{t - 1} + \beta_{{2}} X_{t - 2} + \cdots + \beta_{p} Xt - p\varepsilon_{t} + \phi_{{1}} \varepsilon_{t - 1} + \phi_{{2}} \varepsilon_{t - 2} + \phi_{{3}} \varepsilon_{t - 3}
+ \cdots + \phi_{q} \varepsilon_{t - q}$$ (5) The second model, which has been utilized for predicting future patient admissions, has been computed and analyzed using the Transformer model.
The implementation process has been systematically carried out, ensuring that the model’s parameters and configurations are optimized for accurate predictions. Furthermore, the
effectiveness of the Transformer model has been evaluated based on its ability to process sequential data and capture complex patterns within the dataset. It has the following layers: *
_Data preparation and embeddings_ The original Transformer design relies on embeddings to represent discrete tokens. For a time-series application, numerical values are normalized and then
projected into a continuous embedding space. A linear transformation is frequently used to map each time-step value into an embedding vector. Positional information, which is critical for
sequence modeling, is preserved by adding positional encodings. These encodings impose an ordering on the input data, ensuring that temporal relationships are recognized by the model. *
_Encoder module_ The encoder is composed of multiple layers, each containing a multi-head self-attention mechanism and a position-wise feed-forward network. Within each encoder layer,
self-attention computes the relevance of each time step to every other time step in the input sequence. This operation is facilitated by query, key, and value projections, which are combined
to form attention scores. Multi-head attention extends this process by allowing multiple sets of projections to capture different types of temporal dependencies simultaneously. After the
attention sublayer, a feed-forward network is applied to each embedding vector independently. Residual connections and normalization are included to stabilize training and retain information
from earlier layers. * _Decoder module (Adapted for Regression)_ In a standard Transformer, the decoder generates outputs step by step for language modeling tasks. For time-series
regression, the decoder can be configured to receive a shifted version of the target sequence (e.g., previous time steps or placeholder values) to predict subsequent values. The decoder
follows a structure similar to the encoder but incorporates an additional cross-attention mechanism. This mechanism uses the encoder outputs as keys and values while the decoder states serve
as queries, allowing the model to focus on relevant information from the encoded sequence. The final output is often produced by a linear layer that maps the decoder’s hidden states to
numeric predictions rather than discrete tokens. * _Training objective_ Since the goal involves predicting continuous patient counts, a regression loss function such as mean squared error or
mean absolute error is employed. Backpropagation is used to adjust the parameters within the encoder-decoder blocks, including attention weights, feed-forward layers, and embedding
transformations. Gradient-based optimization algorithms, such as Adam, are commonly utilized to achieve stable convergence. * _Temporal attention and long-range dependencies_ A primary
advantage of this architecture lies in its ability to capture long-range dependencies without relying solely on recurrent connections. By computing attention scores across all time steps
simultaneously, the model can learn complex temporal relationships in patient count data, which may include seasonal trends or abrupt changes. Multi-head attention further refines these
relationships by enabling the model to attend to different aspects of the sequence in parallel. * _Inference and forecast generation_ Once the model has been trained, forecast values are
produced by feeding the most recent observed data (or previously predicted outputs) into the encoder-decoder structure. The decoder iteratively predicts subsequent time steps until the
desired forecast horizon is reached. In practice, teacher forcing or scheduled sampling can be applied during training to balance stability and predictive accuracy. The transformer model
architecture has been discussed in the result section. PROPOSED MODEL AND ALGORITHMS The world’s current COVID-19 pandemic requires a patient safety policy that places a greater focus on
epidemiology, particularly identifying effective population-based developmental and learning programs and addressing the consequences26. The healthcare facilities and programs are still in
the early stages of growth, with skill shortages, sickness absence, insufficient facilities, and low-quality care among the challenges27,28. Even though the government’s determination and
the National Health Mission, sufficient and sustainable healthcare remains a mirage29. The rural healthcare system is beset by a persistent shortage of medical practitioners, which
negatively affects the overall accessibility of care for rural residents30. In certain places, the healthcare infrastructure is insufficient or unprepared to deal with the pandemic like
COVID-19 transmission31,32. To deal with such issues33,34 and to solve the problem, the proposed scheme has been implemented in this research paper. The utilization of IoT devices
significantly contributed to patient monitoring during the COVID-19 pandemic. Smart sensors were employed to continuously measure vital health parameters such as body temperature, oxygen
levels, heart rate, and respiratory function. Data collected through wearable devices and remote monitoring systems were transmitted to healthcare professionals, enabling timely medical
responses. By facilitating remote assessments, these technologies helped reduce direct patient contact, thereby lowering the risk of virus transmission and their will not be any direct
contacts with the patients. Cloud-based platforms were used for data storage and analysis, supporting predictive insights and early detection of health deterioration. AI-driven algorithms
were integrated into IoT systems to identify irregularities and notify medical personnel, ensuring swift intervention. Additionally, automated medication dispensers and intelligent inhalers
were implemented to enhance treatment adherence. IoT-enabled tracking mechanisms further assisted in contact tracing and monitoring quarantine compliance. As a result, hospital resources
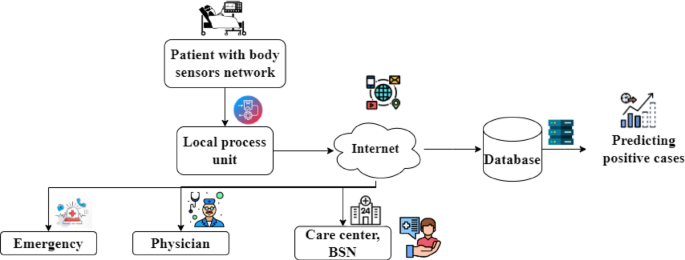
were effectively managed, and patient care was significantly enhanced throughout the pandemic35. Figure 1 depicts the architecture of the IoT-based healthcare management system for the
benefit of the patients and as well as for the hospital management system. Here the patient’s health is being monitored using the body area sensor network. For the sake of simplicity, only
parameters are being considered here, i.e., the patients’ body temperature and oxygen level through the IoT devices. This information is then passed to the Local Process Unit (LPU). After
that, the data is passed via the Internet to the various stakeholders of the healthcare management systems, such as such emergency ward, physician, and care center of the BSN, where the
parameters related to the patient’s details are maintained and observed for any credulity of the patients. The illustrated architecture is composed of several layers, each intended to manage
patients who use IoT devices during the COVID-19 period. In the first layer, body sensors are placed on individuals to collect vital signs. The readings are then received and filtered by a
local processing unit. Next, the data are transferred via the internet to a central repository, where they are stored in a database. Critical cases are flagged, and positive results are
tracked automatically. This information is then shared with healthcare services, such as emergency departments, physicians, and care centers, to enable ongoing monitoring. One notable
advantage of this layered design is its ability to provide real-time updates on patient health, which supports faster intervention and more informed clinical decisions. In addition, the need
for in-person visits can be reduced, lowering the potential for virus transmission. The architecture can also be scaled up if the number of patients increases, offering flexibility in times
of high demand. However, certain drawbacks must be acknowledged. A reliable internet connection is required for seamless data flow, and any disruption can affect timely updates. Moreover,
patient privacy must be protected through robust data security measures36. Costs related to installing and maintaining sensors, databases, and other infrastructure can also be considerable.
Despite these challenges, the layered approach continues to offer valuable support for remote patient care and broader public health initiatives. Fig. 1 shows the architecture of the
proposed IOT-BVM scheme. The working of the proposed scheme, IOT-BVM, is expressed in flowcharts 1 and 2. Figure 2 depicts the working mechanism of flowchart 1 and the operations of the
process that is being undergone inside the hospital management. Initially, the details of the patients are identified who are presently admitted to the hospital. The patients are being
monitored using the IoT-based environment, and it is being checked whether or not the temperature and oxygen level are in the correct range. If it’s not proper, continuous monitoring will be
done. If the monitored information results in the details that indicate that the patients are being recovered and if they have completed the 14 days of the isolation period, then they are
to be in the process of getting discharged from the hospital, and its information must be passed to the stakeholders of the hospital system. The outcome of this algorithm is 1 the total
number of available beds and is denoted as “V”, The algorithm 1 represents herein. The time complexity of the algorithm 1 can be analyzed by looking at the steps involved in the procedure.
Let n represent the number of hospitalized patients. In Step 3, retrieving the details of the patients is a constant-time operation, O(1), since it’s just an input data retrieval. In Step 4,
fetching the IoT-based body temperature (T) and oxygen level readings (O) for each patient requires iterating through each patient’s data. This operation takes O(n) time, where nn is the
number of patients, because it involves fetching and storing data for all patients. Step 5 consists of checking each patient’s body temperature and oxygen level. The comparison of these
values is a constant-time operation, O(1), for each patient. If a patient meets the specified conditions (temperature < 99°F and oxygen level > 96%), the algorithm either discharges
the patient or continue’s monitoring based on whether the isolation period has passed. This decision-making process also takes constant time, O(1), per patient. If the conditions are not
met, an alarm is generated and the hospital management is notified, which is again an O(1) operation. Since these steps are executed for each patient, Step 5 has a time complexity of O(n).
Finally, Step 6 involves repeating the evaluation process until all patients are discharged. Since each patient is processed only once, the overall time complexity of this loop remains O(n).
Thus, considering all steps together, the total time complexity of the algorithm is O(n), where nn is the number of hospitalized patients. This indicates that the algorithm’s execution time
increases linearly with the number of patients, making it a highly efficient solution for managing patient data in real time. The system performance of this algorithm can be evaluated based
on its efficiency, responsiveness, and scalability. In terms of efficiency, the algorithm performs well because it operates in linear time, O(n). Each step of the procedure involves
essential operations, such as retrieving data, comparing patient conditions, and triggering the necessary actions based on those comparisons. As the number of patients increases, the
system’s performance remains proportional to the data size, making it well-suited for managing larger datasets without excessive delays. Regarding responsiveness, the algorithm is designed
to make decisions promptly. It evaluates each patient’s condition and, based on the results, either discharges the patient, continues monitoring, or raises an alarm. This ensures that the
hospital management system can respond quickly to any changes in a patient’s condition, improving patient care and hospital workflow. The ability to react immediately is crucial for
real-time healthcare applications, where fast decision-making can directly impact patient outcomes. In terms of scalability, the algorithm is capable of handling an increasing number of
patients without significant performance degradation. Since the time complexity is linear, the system scales efficiently with the number of patients. For very large datasets, the processing
time will increase proportionally, but the algorithm will still function adequately as long as the hospital’s infrastructure is equipped to manage the additional data. Finally, in terms of
resource utilization, the algorithm relies mainly on data retrieval and condition checks, both of which are low-complexity operations. This results in minimal resource consumption, making
the system efficient in terms of CPU and memory usage. However, as the dataset grows, additional infrastructure might be needed to handle the increased data processing load. Hence, the
algorithm offers efficient performance with linear time complexity, ensuring that it can handle the increasing scale of patient data without significant delays. Its quick decision-making
process enhances responsiveness, and its scalability makes it suitable for use in larger hospitals or healthcare facilities. Overall, the system is designed to perform effectively in
real-time environments, balancing efficiency, scalability, and resource usage. Flowchart 2 is the subpart of the proposed scheme and is represented in Fig. 3. Figure 3 depicts the scenario
where the comparison of the available beds (V) and the positive cases and its prediction of the Confirmed cases (A) are taken into consideration in that particular region. Then this is
compared to get the idea that the vacant beds are available in enough away so that the patients can be admitted and will be given good services by the healthcare systems. In case the
available beds are not present, then the nearby hospital vacancies beds data is to be identified so that the patients can be accommodated in the hospitals; the same is depicted in Algorithm
2. The outcome of the mentioned approach solves the problem of managing the patients in this pandemic situation. The services can be improved as the data will be available in advance, and
the hospital management will have enough time to arrange the physicians, medical devices, staff, and vacant beds. This will also aid the healthcare systems to be prepared in advance with the
availability of medical equipment. The following section discusses the performance evaluations of the proposed scheme. The time complexity of the algorithm 2 can be analyzed by evaluating
the operations involved in each step. Let n represent the number of critical COVID-19 patients and mm represent the number of available vacant beds in the region. In Step 3, retrieving the
details of the COVID-19 patients for a specified region is an O(1) operation, assuming the data is readily available. Step 4 involves assigning the number of critical patients (denoted as A)
from the retrieved data, which is a simple assignment and thus takes constant time, O(1). In Step 5, the algorithm compares the number of critical patients A with the available vacant beds
VV. This comparison is a constant-time operation, O(1). If the number of critical patients is less than the available beds, the algorithm allocates beds by admitting the patients to
hospitals in the region, which again takes constant time, O(1). However, if the number of critical patients exceeds the available beds, the algorithm needs to identify hospitals with vacant
beds, which requires scanning the list of hospitals. This step takes O(m) time, where mm is the number of hospitals. Once the hospitals with available beds are identified, assigning patients
to these hospitals takes O(1) per patient. Finally, Step 6 involves repeating the process until all patients are discharged. Since each patient is evaluated once, this loop runs O(n) times.
Given that the algorithm may require scanning all hospitals in the worst case, the overall time complexity of the algorithm is O(n⋅m), where n is the number of critical patients and mm is
the number of hospitals. This time complexity suggests that as the number of critical patients and hospitals increases, the algorithm’s execution time will scale accordingly. The system
performance of this algorithm can be assessed in terms of efficiency, responsiveness, and scalability. In terms of efficiency, the algorithm performs well for smaller datasets, as most
operations are constant-time, O(1), including retrieving data and assigning patients to hospitals. The primary area where performance may degrade is when identifying hospitals with available
beds, which requires scanning the list of hospitals. As the number of hospitals grows, this step can become a bottleneck, increasing the overall time complexity to O(n⋅m). Therefore, while
the algorithm is efficient for smaller datasets, its performance may decrease with a larger number of hospitals or patients. In terms of responsiveness, the algorithm ensures quick
decision-making when allocating beds to critical patients. If the number of critical patients is less than the number of vacant beds, they can be admitted to the available hospitals in the
region, which ensures that patients are admitted promptly. If there are more critical patients than vacant beds, the algorithm identifies nearby hospitals with available beds and directs
patients accordingly. This ensures that the system is responsive and that no critical patient is left without attention, making it highly suitable for real-time applications in healthcare
settings. Regarding scalability, the algorithm can handle a growing number of patients, but its scalability is affected by the number of hospitals in the region. As the number of hospitals
increases, the algorithm’s performance may suffer due to the need to scan a larger list of hospitals for available beds. This means that while the algorithm is scalable to a degree, it may
require optimizations, such as indexing hospitals or clustering them based on location or availability, to improve efficiency when the number of hospitals or patients grows significantly.
Lastly, in terms of resource utilization, the algorithm is generally efficient, as it primarily performs basic comparisons and assignments. However, the process of identifying vacant beds in
hospitals can be resource-intensive, especially if the list of hospitals is large. As the dataset grows, the system may need more resources to manage the increased computational load.
Therefore, the algorithm is suitable for smaller-scale applications, but for larger datasets, it might require infrastructure improvements or optimization techniques to ensure optimal
performance. Hence, while the algorithm offers an efficient and responsive solution for allocating beds to critical patients, its time complexity of O(n⋅m) makes it less efficient as both
the number of patients and hospitals increases. The system performs well for smaller datasets but may face challenges with scalability and resource usage when handling larger volumes of
data. To ensure better performance at scale, optimizations such as data indexing or improved searching algorithms could be considered. PROPOSED FRAMEWORK AND ITS ANALYSIS The world’s current
COVID-19 Pandemic requires a patient safety policy that places a greater focus on epidemiology, particularly identifying effective population-based developmental and learning programs and
addressing the consequences36. The healthcare facilities and programs are still in the early stages of growth, with skill shortages, sickness absence, insufficient facilities, and
low-quality care among the challenges. However, the government’s determination and the National Health Mission that adequate and sustainable healthcare remain a mirage. Keeping these things
in the mind, the said approach is proposed. In this section, the performance evaluation has been discussed and is as follows. Figures 4 and 5 represents the conventional (X-ray image to see
the impact of the infection) methods to identify the criticalness of the patient’s health. But every time doing the X-ray of the target patients is not good for their health. Hence,
monitoring the parameters such as oxygen level and temperature is another solution implemented using IoT-based devices and theories. IoT (Internet of Things) can also be used to further
automate the process of hospital management and patient monitoring37. Using wearable body sensors, e.g., pulse oximeters and temperature sensors, patients’ vital signs can be monitored
continuously in real time38. The sensors send data wirelessly to a central gateway, which processes and aggregates the data before sending it to a decision-support system. The cloud system
then runs the decision logic described, e.g., checking if the patient’s temperature is below 99°F and oxygen levels above 96%. If these are the criteria, the system automatically checks if
the 14-day isolation period has elapsed. After confirmation, it sends a discharge notification, updates the hospital bed management system to indicate the newly released bed, and informs the
concerned staff. If the vitals of the patient exceed the safe threshold, the IoT system automatically raises an alarm, alerting hospital management through SMS, email, or dashboard alerts.
This is an automated process that saves time wasted in manual checks, reduces human error, and allows timely intervention. Further, the merging of IoT data with electronic health records
(EHR) and hospital management systems allows enhanced resource planning and trend analysis. Overall, IoT deployment automates the entire process, allowing better patient care, operational
efficiency, and bed turn-over rates without compromising on high accuracy for monitoring critical health parameters. Table 3 below indicates the various aspects of the IoT based patients
monitoring system. The results are based on the historical data taken through the KAGGLE. Figure 6 shows the plot of patients who were admitted to the hospitals. The dataset utilized in this
research was sourced from Kaggle and provides a comprehensive view of key COVID-19 metrics, offering crucial insights for understanding the progression and impact of the pandemic. The
dataset contains several time-series plots that capture important trends over time, each serving a specific purpose in analyzing the dynamics of the pandemic. One of the key visualizations
is the plot of patients admitted to hospitals, which illustrates the fluctuations in hospital admissions throughout the observed period. This plot is essential in understanding how
healthcare facilities were impacted as the number of cases surged. Additionally, the dataset includes a plot of recovered cases, which provides a clear picture of the recovery trends and
helps to evaluate the effectiveness of treatment and healthcare interventions during different phases of the pandemic. A plot of the death rate within the hospital is also included, offering
critical insights into the severity of the disease and the challenges faced by healthcare systems. Moreover, the dataset tracks the total test results and the increasing number of cases,
showing the relationship between testing efforts and the rise in reported cases. This is particularly important for understanding how testing infrastructure scaled and its role in detecting
the spread of the virus. Finally, the dataset presents a plot of COVID-19 positive cases, reflecting the overall trajectory of the virus in the population and providing an essential context
for understanding how the pandemic evolved over time. Together, these time-series plots offer a rich dataset for analyzing the various facets of the COVID-19 pandemic, and they form the
foundation for our research, enabling a detailed exploration of trends, correlations, and patterns within the data. The preprocessing of the dataset was carried out using several essential
steps to ensure its suitability for machine learning (ML) and deep learning (DL) models. First, we began by handling missing data. For any rows with missing values, we applied imputation
techniques, such as mean or median imputation, to replace missing numerical data. Rows with excessive missing information were removed to maintain the dataset’s integrity. Categorical
features were transformed using one-hot encoding to convert non-numeric values into a format compatible with machine learning algorithms. Next, the focus has been given on normalizing
numerical features. We used Min–Max scaling to ensure that all numerical values fell within a uniform range (0 to 1), preventing any one feature from disproportionately influencing model
training due to differences in scale. Given that the dataset includes time-series data, it was critical to preserve the chronological order of the observations. We formatted the data to
ensure it accurately reflected the temporal dependencies in the dataset. For time-series forecasting, we used a sliding window approach to create sequences of past data points to predict
future outcomes. This allowed the models to capture the dynamic trends over time, such as hospital admissions, recoveries, and death rates. Feature engineering played a key role in enriching
the dataset. We created lag features, capturing past values of vital variables like patient admissions and recoveries, which help the models account for historical trends and dependencies.
Additional temporal features, such as day-of-week or month, were also generated to capture any seasonal patterns. Finally, the dataset was split into training and testing subsets, typically
using an 80/20 split. K-fold cross-validation was implemented to evaluate the models robustly, ensuring they were not overfitting to any particular subset of the data. By preprocessing the
dataset in these ways, we ensured that it was ready for modelling. RESULTS AND DISCUSSIONS _Test bed setup for experimental evaluation_ The experimental evaluations were conducted on the
environment equipped with an Intel(R) Xeon(R) CPU E5-2620 v2 operating at 2.10 GHz, featuring 6 physical cores and 12 logical processors. The system was supported by 128 GB of DDR4 memory.
Storage was configured with five 300 GB drives. For GPU-based computations, an NVIDIA Tesla K80 graphics card with 128 GB memory capacity was utilized. The dataset used here was downloaded
from the publicly hosted COVID-19 time series data by the Center for Systems Science and Engineering (CSSE) at Johns Hopkins University, URL:
https://github.com/CSSEGISandData/COVID19/tree/master/csse_covid_19_data/csse_covid_19_time_series. Cumulative confirmed United States cases from the dataset were extracted. After
preprocessing, there was data aggregation by date, and the cumulative case counts were converted to daily new cases by differencing two consecutive days’ values. Through this, analysis of
the spread of COVID-19 over time was made in a more defined manner. Preprocessing was then followed by a split of the dataset into the training and the testing set by an 80/20 ratio. A
sliding window approach was used for the generation of sequence, where for each input, there were 10 consecutive days of daily new case counts in an attempt to predict the next day’s value.
These were reshaped accordingly to fit into the input parameters of deep learning models. The model development was centered on three deep learning architectures: LSTM, GRU, and Transformer.
Hyperparameter tuning was used for each of the models in order to provide optimal performance, and evaluation included metrics such as Mean Absolute Error (MAE), Root Mean Squared Error
(RMSE), and Loss. The LSTM model was constructed with 64 units of memory, dropout of 0.2 to prevent overfitting, and trained for over 50 epochs with the Adam optimizer at learning rate
0.0001. The Mean Squared Error (MSE) as the loss function was employed. The GRU model also employed a similar structure, swapping the LSTM layer for a GRU layer but utilizing the same
hyperparameters such as the number of units, dropout rate, optimizer, and loss function. Mechanisms with 4 attention heads that permit the simultaneous attention of different components of
the input sequence. A light Transformer was created with the hyperparameters tuned including the number of layers, embedding size, and dropout rate. Training was conducted for 50 epochs
using the Adam optimizer and MSE loss function. Throughout the training phase, there was a consistent drop in loss over epochs, and the models were exhibiting increasingly better
performance. After training, the models were tested on the test set specified. The Transformer model demonstrated better results on all metrics of evaluation, closely followed by the LSTM
and GRU models. Visual plots were created to represent the intercorrelations of the evaluation metrics. Graphical plots of MAE vs. Loss, RMSE vs. Loss, and RMS vs. Loss revealed similar
trends, justifying the seen hierarchy of performance between the models. Moreover, values for the x-axis and y-axis were easily identified and shown for each graph to enhance
interpretability. The thorough evaluation pointed out that deep learning models, particularly the Transformer model, hold enormous potential in forecasting trends in COVID-19 cases,
demonstrating considerable enhancements over conventional sequential models. _Discussion on Hyperparameter Selection and Tuning_ In the LSTM model, a number of hyperparameters were selected
with care to maximize performance and avoid overfitting. In particular, the usage included the utilization of a total of 64 LSTM units, which allowed for a balance between learning capacity
and computational cost. This number of units was empirically selected to provide sufficient memory capacity without making the model excessively complicated. In another effort to enhance
generalization, a dropout rate of 0.2 was utilized, where 20% of the neurons were randomly dropped out during training, thereby minimizing the chances of overfitting. The model was trained
for 50 epochs, a time period which was selected based on observation of the trend in loss, such that this number of iterations allowed for sufficient accommodation of temporal patterns
without inducing overfitting. A batch size of 32 was utilized, as it was discovered to offer the best balance between computational cost and training stability. The Adam optimizer, with a
learning rate of 0.0001, was utilized due to its adaptive learning characteristics and ability to deal with sparse gradients, features highly sought after in time series forecasting
activities. Model optimization was conducted using the Mean Squared Error (MSE) loss function, which is generally known for suitability in regression tasks, where large prediction errors
were given a proportionately larger penalty. The same hyperparameters were used in the GRU model for consistency and to allow fair comparisons. The setup of the GRU network was 64 units, a
reflection of the structure of the LSTM network because the same number has been found to offer an optimal balance between training time and model performance. Another 0.2 dropout rate was
applied to prevent overfitting. Training was carried out for 50 epochs, with a batch size of 32, to allow for uniform updating of the gradients and efficient memory management. The Adam
optimizer, using a learning rate of 0.0001, offered fast convergence and responsiveness to the changing learning needs of the GRU model. Like the LSTM network, the MSE loss function was used
to reduce the gap between the real and predicted values, with accuracy in regression tasks in mind. For the Transformer model, some modifications were made to accommodate its architecture,
the same has been depicted in Fig. 4. The model used 4 attention heads, which allowed it to attend to various sections of the sequence data simultaneously, thereby capturing complex
interdependencies well. Two multi-head attention layers were utilized, balancing between depth and computational tractability. A hidden size of 128 was chosen to offer sufficient
representational capacity, enabling the model to learn complex patterns without overfitting. A dropout rate of 0.2 was applied uniformly to further generalize the model. Training was carried
out for 50 epochs, and a batch size of 32 was utilized, just like in the recurrent models. The Adam optimizer with a learning rate of 0.0001 facilitated efficient and adaptive optimization
during training. MSE was once again used as the loss function to maintain uniformity across models as well as to appropriately penalize large prediction errors using PyTorch or TensorFlow
can be provided for time-series forecasting with transformers. DISCUSSIONS OF THE RESULT ACHIEVED: The performance of the deep learning models—LSTM, GRU, and Transformer—was evaluated based
on their Mean Absolute Error (MAE), Root Mean Squared Error (RMSE), and Loss values after training and testing over the COVID-19 daily new cases dataset and the same has been depicted in the
Fig. 5, 6, 7, 8, 9, and 10. The figigure indicates the values as, the LSTM model achieved a MAE of 4213.76, a RMSE of 6050.09, and a corresponding Loss value of 78,426,017.38. These values
suggest that while the LSTM was reasonably effective in capturing the temporal dependencies of the COVID-19 daily new cases, there were still notable prediction errors. Mathematically, the
RMSE being higher than the MAE indicates that larger errors occurred occasionally because RMSE penalizes larger errors more than MAE. Similarly, the GRU model achieved a MAE of 4580.59, a
RMSE of 7061.71, with a Loss value of 91,656,112.95. The GRU’s MAE and RMSE were slightly higher than the LSTM’s, which suggests that while the GRU was able to model the temporal structure
to some extent, it underperformed relative to the LSTM model. The difference between MAE and RMSE for GRU also points toward the occurrence of significant errors on some days, negatively
impacting the model’s reliability. In contrast, the Transformer model achieved a MAE of 4018.71, a RMSE of 5838.42, with a Loss value of 67,516,675.40. These numerical results demonstrate a
superior performance in comparison to both the LSTM and GRU models. The MAE was the lowest among the three models, indicating that the Transformer made the smallest errors on average.
Furthermore, the RMSE for the Transformer was also the lowest, highlighting that the Transformer was not only minimizing average errors but also ensuring that extreme prediction deviations
were fewer compared to LSTM and GRU. Mathematically, the following observations has been observed: MAE comparison:\({\text{MAE}}_{{{\text{Transformer}}}} < {\text{MAE}}_{{{\text{LSTM}}}}
< {\text{ MAE}}_{{{\text{GRU}}}}\). Substituting the actual values: 4018.71 < 4213.76 < 4580.59. RMSE comparison:\({\text{RMSE}}_{{{\text{Transformer}}}} < {\text{
RMSE}}_{{{\text{LSTM}}}} < {\text{ RMSE}}_{{{\text{GRU}}}}\). Substituting the actual values: 5838.42 < 6050.09 < 7061.71. This mathematically validates that the Transformer model
yielded consistently lower errors both in terms of MAE and RMSE. In addition, considering the Loss values, which indicates the Mean Squared Error (MSE), the Transformer again achieved a
minimum value (67,516,675.40), followed by LSTM (78,426,017.38) and GRU (91,656,112.95). A lower loss confirms that the model’s predictions were closer to the actual values on average.
_Visual Interpretation of Results_ The plots of MAE vs. Loss and RMSE vs. Loss further corroborated the numerical observations. In these graphs, the Transformer’s data points were
consistently located lower than those of LSTM and GRU models, visually indicating better performance. The MAE vs. Loss graph showed a near-linear trend for the Transformer, implying that its
error reduction was consistently aligned with minimizing loss. Similarly, the RMSE vs. Loss plot depicted that the Transformer maintained lower root mean squared deviations compared to
other models. The fine mini-grid style used in the graphs enabled a clearer visualization of minor variations in performance, and the x- and y-axis values extracted demonstrated a visible
gap where the Transformer’s metrics outperformed others.Thus, based on the mathematical analysis of MAE, RMSE, and Loss, and the visual evidence from the plotted graphs, it can be
conclusively proven that the Transformer model provided the most accurate and reliable forecasts for daily COVID-19 new cases. This superiority can be attributed to the Transformer’s ability
to capture complex long-range dependencies in the data without the sequential bottlenecks that hinder recurrent architectures like LSTM and GRU. The same has been depicted in the Table 4 To
statistically compare the performance of the deep learning models (LSTM, GRU, and Transformer) with regard to the Mean Absolute Error (MAE), Root Mean Squared Error (RMSE), and Loss, a
pair-wise comparison through a statistical test such as the paired t-test or Wilcoxon signed-rank test can be done. The test would identify if the differences in the measures of performance
between the models that are being observed are statistically significant or by chance. Because these models are tested on the same dataset, a paired t-test would be suitable to compare their
performance on each of the metrics.First, the null hypothesis (H₀) can be stated as “there is no significant difference between the MAE, RMSE, and Loss values of the models,” and the
alternative hypothesis (H₁) would be that “there is a significant difference between the performance of at least one model.” The paired t-test would then compare the MAE, RMSE, and Loss
between the models pairwise (LSTM vs. GRU, LSTM vs. Transformer, and GRU vs. Transformer) for each measure. Since the Transformer model performed better than both LSTM and GRU in all three
measures (lower MAE, RMSE, and Loss), the outcome of these tests will most likely have large differences, particularly between the Transformer and the other two models. The Statistical
significance can be tested using a _p_-value cutoff (usually _p_ < 0.05). If the _p_-value is less than this value for a particular metric comparison, the null hypothesis can be rejected,
meaning that the performance difference is statistically significant. For instance, if the Transformer-LSTM comparison has a _p_-value less than 0.05 for the MAE or RMSE, we can safely
conclude that the performance of the Transformer model is considerably superior to LSTM in terms of prediction accuracy and error reduction. Additionally, effect size measures like Cohen’s d
may also be computed to quantify the size of the difference in performance. The larger the value of Cohen’s d, the larger the difference in model performance would be, thereby
substantiating the argument that the Transformer model performs better than LSTM and GRU. According to the numeral discrepancies shown in the MAE, RMSE, and Loss values, the statistical
testing and effect size calculation provided strong evidence to affirm the performance superiority of the Transformer model in estimating COVID-19 daily new cases. Visual evidence from the
graphs shown, based on which the Transformer consistently outperforms, is that which confirms these statistical findings and supports the ability of the model to tackle intricate dependency
in the data. _Challenges_ The findings obtained through this study bring forth a number of challenges from the perspective of model performance and interpretation. As much as the Transformer
model outperformed both the LSTM model and the GRU model by way of MAE, RMSE, and Loss, an observation was made that there were huge errors committed in the prediction, especially where the
models were dealing with complex patterns in the COVID-19 daily new cases dataset. The LSTM model, though efficient in handling temporal dependencies, had greater MAE and RMSE values than
the Transformer, which implies that greater prediction errors were experienced during certain periods. This indicates that the ability of the model to generalize over various trends was
compromised, resulting in deviations from true values. The GRU model also suffered from the same problems, with greater MAE and RMSE than the LSTM, indicating that GRU was unable to capture
the temporal dynamics with the same precision. The vast disparity between the MAE and RMSE for LSTM and GRU also indicated that sporadic sheer errors were severely punished by the RMSE,
which affected their overall usability. Such models, limited by their sequential natures, could have struggled with learning long-distance dependencies without experiencing large errors when
sudden changes in the data, like spikes or sudden drops, were present. The Transformer model, however, although uniformly demonstrating better performance compared to all other models, also
struggled to reduce prediction errors to a degree that would be deemed negligible in real-world use. Regardless of its capacity for capturing long-distance dependencies and the lower Loss
figures, even predictions by the Transformer showed fluctuations which could potentially undermine real-world forecast accuracy. Such challenges are multiplied by the erratic and complicated
nature of the data on the COVID-19 pandemic, making precise prediction especially troublesome. In addition, while the graphical results do indeed show convincing outperformance of the
Transformer model, it is a challenge to interpret and graph results across various measures (MAE, RMSE, and Loss) and thus ensure the most important performance measures are emphasized.
These challenges necessitate further tuning of model designs and further development of different approaches, like ensemble learning or composite models, for even better, more precise
prediction of dynamic datasets like COVID-19 cases. CONCLUSION In this research paper, the prediction of new COVID-19 cases on a daily basis was tackled with the implementation of deep
learning models, i.e., LSTM, GRU, and Transformer models. Following appropriate preprocessing of the dataset and input sequence preparation, the models were created, trained, and tested
using standard performance measures such as MAE, RMSE, and Loss. The findings show that the Transformer model outperformed the LSTM and GRU models in all evaluation metrics. The capacity to
learn complex temporal relationships without the constraint of processing sequential data was a significant strength. Visual examination of the models’ performance also corroborated the
findings, with the Transformer recording lower error values and showing improved generalization on new data. It can be concluded from the experimental findings that Transformer-based models
offer a very efficient solution to time series forecasting problems such as COVID-19 case prediction. The findings show that future research in epidemic forecasting can benefit a great deal
from the use and extension of Transformer models. FUTURE WORK This section highlights the future work on COVID-19 datasets and also highlights the privacy and data security challenges in
healthcare IoT frameworks. * _Integration of Heterogeneous Data Sources_44 Future efforts must focus on merging data from diverse origins—such as hospital electronic health records, public
health databases, social determinants, and real-time IoT sensor feeds. This integration enables comprehensive analyses, facilitates cross-validation of insights, and supports more accurate
predictive models. By combining structured and unstructured data, researchers can capture a fuller picture of COVID-19 dynamics, ultimately leading to improved public health responses. *
_Standardization of Data Collection Protocols_45 Uniform data collection methods are critical to ensure consistency and interoperability. Establishing standard operating procedures across
healthcare institutions minimizes variability in data quality. Consistent protocols allow datasets from various regions and sources to be compared effectively, reducing errors during data
aggregation and enabling robust multi-center research collaborations. * _Advanced Anonymization Techniques_46 Given the sensitive nature of health data, it is imperative to develop
sophisticated anonymization methods that safeguard individual identities while preserving data utility. Techniques such as differential privacy, k-anonymity, and synthetic data generation
can help maintain confidentiality. Future work should focus on balancing data utility with privacy, ensuring that analytical insights remain valid without exposing personal information. *
_Real-Time Analytics Frameworks_28 Implementing frameworks capable of processing and analyzing data in real time is crucial for timely decision-making during health crises. These systems
would monitor outbreak trends as they develop, allowing public health officials to deploy resources more effectively. Future frameworks should support streaming data inputs from various
sources, thus enabling rapid response strategies during emerging outbreaks. * _Interoperability of IoT Devices_47 Healthcare IoT ecosystems consist of numerous devices—from wearable monitors
to smart sensors—each potentially using different communication protocols. Ensuring that these devices can seamlessly share data is essential. Future research should promote the development
of universal standards and middleware solutions that bridge protocol differences, thus fostering an integrated and responsive healthcare network. * _Scalable Data Infrastructure_48 As
COVID-19 datasets grow in volume and complexity, the underlying infrastructure must scale accordingly. Cloud computing and distributed systems can support high-volume data processing and
storage. Future infrastructure development should focus on flexibility and scalability, ensuring that both current and future data needs are met without compromising performance or
reliability. * _Enhanced Predictive Modeling_49 Machine learning and statistical models are vital for forecasting outbreak trends and resource requirements. Future work should refine these
models to incorporate evolving data streams and emerging viral variants. Continuous model validation and updates are necessary to ensure that predictions remain accurate over time, thus
enhancing preparedness for future waves or pandemics. * _Secure Data Sharing Protocols_50 Facilitating the secure exchange of data between institutions is paramount for collaborative
research. Developing robust protocols that encrypt data during transmission and authenticate users can help prevent unauthorized access. Future initiatives should work towards establishing
standardized, secure data sharing agreements that protect sensitive information while fostering innovation and collaboration. * _Privacy-Preserving Data Mining_51 Privacy-preserving
techniques—such as federated learning and secure multiparty computation—allow multiple entities to analyze data collectively without the need for centralization. These methods minimize the
risk of large-scale breaches by keeping raw data at its source. Future work should focus on refining these approaches to ensure they are both secure and effective in yielding actionable
insights. * _Robust Encryption for Data Protection_52 Protecting healthcare data at rest and in transit requires state-of-the-art encryption standards. Employing strong encryption algorithms
and regularly updating them in response to emerging vulnerabilities is essential. Future initiatives should also explore end-to-end encryption protocols specifically tailored for IoT
networks to ensure that sensitive information remains confidential. * _Dynamic Consent Management Systems_53 Patient consent for data usage should be adaptable to changes over time. Dynamic
consent models allow individuals to modify their data sharing preferences as circumstances or regulatory frameworks evolve. Future systems must integrate user-friendly interfaces and secure
mechanisms for consent management, ensuring that patients retain control over their personal health information throughout its lifecycle. * _Real-Time Intrusion Detection_37,54 With the
growing number of connected devices, healthcare IoT networks are increasingly vulnerable to cyberattacks. Real-time intrusion detection systems (IDS) can monitor network traffic, identify
suspicious behavior, and alert administrators instantly. Future efforts should prioritize the development and deployment of IDS that are optimized for the unique characteristics of
healthcare environments. * _Blockchain-Based Data Integrity_41,55 Blockchain technology offers a decentralized approach to recording data transactions in an immutable ledger. By
incorporating blockchain, healthcare systems can verify the authenticity and integrity of data, reducing the risk of tampering. Future applications may include tracking data provenance and
ensuring that each transaction is securely recorded, thereby enhancing overall trust in the system. * _Compliance with Global Privacy Regulations_56 Data handling practices must adhere to
international privacy regulations, such as GDPR, HIPAA, and other regional standards. Achieving and maintaining compliance can be challenging due to differing requirements across
jurisdictions. Future work should focus on developing adaptive compliance frameworks that automatically adjust to regional regulatory changes, ensuring that privacy standards are
consistently met. * _Continuous Risk and Vulnerability Assessments_57 Cyber threats evolve constantly, necessitating regular vulnerability assessments and risk evaluations. Ongoing security
audits can identify weak points within the system and prompt timely countermeasures. Future initiatives should implement automated risk assessment tools that continuously monitor system
integrity and flag potential security breaches before they occur. * _Ethical Integration of Artificial Intelligence_58 The application of AI in healthcare requires a strong ethical
foundation to prevent biases and ensure equitable treatment of all patient groups. Integrating ethical guidelines into AI development can help mitigate risks associated with discriminatory
practices. Future work should emphasize transparency, fairness, and accountability in AI systems, ensuring that these technologies serve all communities without prejudice. * _Adaptive
Security Measures Against Evolving Threats_59 The cybersecurity landscape is dynamic, with new threats emerging regularly. Security systems must be designed to adapt rapidly to these
changes. Future security strategies should include machine-learning-based threat detection and automated patch management systems, ensuring that defenses are continuously updated to
counteract novel attack vectors. * _Ensuring Data Accuracy and Validation_60 Reliable analysis hinges on the accuracy of the underlying data. Ensuring data quality involves rigorous
validation processes, regular audits, and the use of error-detection algorithms. Future work should focus on developing standardized validation protocols and employing cross-verification
techniques to maintain the integrity of COVID-19 datasets. * _Cost-Effective Security Implementations_37,61 While robust security measures are essential, they must also be economically
viable—especially for smaller healthcare providers with limited budgets. Future research should explore cost-effective solutions that do not compromise on security. This may include
open-source security tools, cloud-based security services, and scalable security architectures that can be tailored to the financial constraints of various institutions. * _User Education
and Training_62 The human factor remains one of the most significant vulnerabilities in data security. Regular training programs can equip healthcare personnel with the necessary skills to
recognize and mitigate security threats. Future initiatives should develop comprehensive education campaigns that emphasize best practices in data handling, cyber hygiene, and incident
response, thereby reducing the risk of human-induced breaches. * _Edge Computing for Reduced Latency_63 Processing data at the edge of the network—closer to where it is generated—can
significantly reduce latency and enhance the speed of critical decision-making. Edge computing enables real-time data analysis, which is particularly valuable in time-sensitive healthcare
scenarios. Future work should investigate integrating edge devices with centralized systems to create a hybrid architecture that balances speed and data centralization. * _Resilient Backup
and Recovery Systems_64 Ensuring data continuity in the event of system failures or cyberattacks requires robust backup and recovery protocols. These systems must be designed to restore data
quickly and accurately, minimizing downtime and preventing data loss. Future efforts should focus on creating resilient backup architectures that incorporate redundancy, regular testing,
and automated recovery processes. * _Adoption of Standardized Security Frameworks_40,65 The implementation of industry-recognized security frameworks—such as ISO/IEC 27001 or NIST—can
provide a systematic approach to managing data security risks. Standardized frameworks ensure that best practices are followed consistently across all levels of an organization. Future work
should encourage the adoption of these frameworks to streamline security processes and foster a culture of continuous improvement in risk management. * _Cross-Sector Collaboration on Data
Security_66 The complexity of healthcare IoT systems often necessitates collaboration between public institutions, private enterprises, and technology vendors. Such cross-sector partnerships
can drive the development of innovative security solutions and promote shared learning. Future initiatives should focus on creating collaborative networks that facilitate knowledge
exchange, joint research projects, and the pooling of resources to tackle common security challenges. * _Continuous Monitoring and Auditing Mechanisms_42,67 Ongoing surveillance of data
access and usage is essential for early detection of anomalies and ensuring regulatory compliance. Automated monitoring systems, coupled with periodic audits, can help identify suspicious
activity and trigger prompt remedial actions. Future work should invest in advanced auditing tools that leverage artificial intelligence to continuously scan for deviations from established
security norms, thereby maintaining the integrity of healthcare IoT ecosystems. DATA AVAILABILITY The datasets generated during and/or analysed during the current study are not publicly
available but are available from the corresponding author on reasonable request. REFERENCES * Konwar, A. N. & Borse, V. Current status of point-of-care diagnostic devices in the Indian
healthcare system with an update on COVID-19 pandemic. _Sens. Int._ 1, 100015 (2020). Article PubMed PubMed Central Google Scholar * Prasad, V. K. & Bhavsar, M. D. Monitoring and
prediction of SLA for IoT based cloud. _Scalable Comput. Pract. Exp._ 21(3), 349–358 (2020). Article Google Scholar * Javaid, M. & Khan, I. H. Internet of Things (IoT) enabled
healthcare helps to take the challenges of COVID-19 Pandemic. _J. Oral Biol. Craniofacial Res._ 11(2), 209–214 (2021). Article Google Scholar * Prasad, V. K., Tanwar, S. & Bhavsar, M.
D. Advance cloud data ana- lytics for 5G enabled IoT. In _Blockchain for 5G-Enabled IoT_ 159 (Springer, 2021). Chapter Google Scholar * Rana, A. K., Salau, A. O., Sharma, S., Tayal, S.
& Gupta, S. _Internet of Things: Energy, Industry, and Healthcare_ 1–330 (CRC Press, 2021). https://doi.org/10.1201/9781003140443. Book Google Scholar * Rout, N. K. et al. Estimation
of COVID-19 secondary effects on cardiac anomalies using deep transfer learning approach. _Sādhanā_ 50, 91. https://doi.org/10.1007/s12046-025-02739-5 (2025). Article CAS Google Scholar *
Schwickert, L. et al. Fall detection with body-worn sensors. _Z. Für Gerontol. Und Geriatr._ 46(8), 706–719 (2013). Article CAS Google Scholar * He, J., Geng, Y. & Pahlavan, K.
Modeling indoor TOA ranging error for body mounted sensors. In _2012 IEEE 23rd International Symposium on Personal, Indoor and Mobile Radio Communications-(PIMRC)_. (IEEE, 2012). * Mancini,
M. et al. Mobility lab to assess balance and gait with synchronized body-worn sensors. _J. Bioeng. Biomed. Sci._ https://doi.org/10.4172/2155-9538.S1-007 (2011). Article PubMed PubMed
Central Google Scholar * Horak, F. B. & Mancini, M. Objective biomarkers of balance and gait for Parkinson’s disease using body-worn sensors. _Mov. Disord._ 28(11), 1544–1551 (2013).
Article PubMed PubMed Central Google Scholar * Otto, C., Milenkovic, A., Sanders, C. & Jovanov, E. System architecture of a wireless body area sensor network for ubiquitous health
monitoring. _J. Mob. Multimed._ 1(4), 307–326 (2006). Google Scholar * Liew, C.-H., Ong, S.-Q. & Ng, D.-E. Utilizing machine learning to predict hospital admissions for pediatric
COVID-19 patients (PrepCOVID-Machine). _Sci. Rep._ 15(1), 3131 (2025). Article CAS PubMed PubMed Central Google Scholar * Xiang, Z. et al. Machine learning based prediction models for
the prognosis of COVID-19 patients with DKA. _Sci. Rep._ 15(1), 2633 (2025). Article CAS PubMed PubMed Central Google Scholar * Park, H. Y. et al. Application of machine learning for
delirium prediction and analysis of associated factors in hospitalized COVID-19 patients: A comparative study using the Korean Multidisciplinary cohort for delirium prevention (KoMCoDe).
_Int. J. Med. Inform._ 195, 105747 (2025). Article PubMed Google Scholar * Farahat, I. S. et al. An AI-based novel system for predicting respiratory support in COVID-19 patients through
CT imaging analysis. _Sci. Rep._ 14(1), 851 (2024). Article ADS CAS PubMed PubMed Central Google Scholar * Elaraby, M. E., Ewees, A. A. & Anter, A. M. A robust IoT-based cloud
model for COVID-19 prediction using advanced machine learning technique. _Biomed. Signal Process. Control_ 87, 105542 (2024). Article Google Scholar * Cai, J. et al. Developing deep LSTMs
with later temporal attention for predicting COVID-19 severity, clinical outcome, and antibody level by screening serological indicators over time. _IEEE J. Biomed. Health Inform._ 28, 4204
(2024). Article PubMed Google Scholar * Solayman, S., Aumi, S. A., Mery, C. S., Mubassir, M. & Khan, R. Automatic COVID-19 prediction using explainable machine learning techniques.
_Int. J. Cogn. Comput. Eng._ 4, 36–46 (2023). Google Scholar * Li, S. et al. Development and external evaluation of predictions models for mortality of COVID-19 patients using machine
learning method. _Neural Comput. Appl._ 35, 1–10 (2023). CAS Google Scholar * Hasan, I., Dhawan, P., Rizvi, S. A. & Dhir, S. Data analytics and knowledge management approach for
COVID-19 prediction and control. _Int. J. Inf. Technol._ 15(2), 937–954 (2023). PubMed Google Scholar * Famiglini, L., Campagner, A., Carobene, A. & Cabitza, F. A robust and
parsimonious machine learning method to predict ICU admission of COVID-19 patients. _Med. Biol. Eng. Comput._ https://doi.org/10.1007/s11517-022-02543-x (2022). Article PubMed PubMed
Central Google Scholar * Liu, T., Siegel, E. & Shen, D. Deep learning and medical image analysis for COVID-19 diagnosis and prediction. _Annu. Rev. Biomed. Eng._ 24(1), 179–201 (2022).
Article CAS PubMed Google Scholar * Xu, W. et al. Risk factors analysis of COVID-19 patients with ARDS and prediction based on machine learning. _Sci. Rep._ 11(1), 2933 (2021). Article
ADS CAS PubMed PubMed Central Google Scholar * Singh, S., Parmar, K. S. & Kumar, J. Development of multi-forecasting model using Monte Carlo simulation coupled with wavelet
denoising-ARIMA model. _Math. Comput. Simul._ 230, 517–540 (2025). Article MathSciNet MATH Google Scholar * Wang, X., Feng, M., Qiu, J., Jinjin, Gu. & Zhao, J. From news to forecast:
Integrating event analysis in llm-based time series forecasting with reflection. _Adv. Neural. Inf. Process. Syst._ 37, 58118–58153 (2025). Google Scholar * Prasad, V. K. et al. ABV-COVID:
An ensemble forecasting model to predict availability of beds and ventilators for COVID-19 like pandemics. _Ieee Access_ 10, 74131–74151 (2022). Article PubMed Google Scholar * He, Y. et
al. Foundation model for advancing healthcare: Challenges, opportunities and future directions. _IEEE Rev. Biomed. Eng._ 18, 172 (2024). Article Google Scholar * Sharma, N. & Kaushik,
P. Integration of AI in healthcare systems—A discussion of the challenges and opportunities of integrating AI in healthcare systems for disease detection and diagnosis. In _AI in Disease
Detection: Advancements and Applications_ 239–263 (Wiley, 2025). Chapter Google Scholar * Fernandez-Gonzalo, R., Schneider, S., Heer, M. & Liphardt, A. M. The search for the ultimate
exercise countermeasure to preserve crew health and ensure mission success in long-duration spaceflight. _Exp. Physiol._ https://doi.org/10.1113/EP091737 (2025). Article PubMed Google
Scholar * Golestani, R., Farahani, F. K. & Peters, P. Exploring barriers to accessing health care services by young women in rural settings: A qualitative study in Australia, Canada,
and Sweden. _BMC Public Health_ 25(1), 213 (2025). Article PubMed PubMed Central Google Scholar * Tan, C. Y., Jang, S. T., Lam, S. M., An, A. Q. & Lo, U. K. Teaching and learning
challenges due to the COVID-19 pandemic: A systematic review. _Educ. Res. Rev._ 47, 100667 (2025). Article Google Scholar * Stoltenberg, A. S., Ranieri, V., Dahlen, H. K. N., Nastouli, E.,
SAFER Investigators Byott Matt 9 Edwards Sarah JL 8 Frampton Daniel 10 Gilson Richard 11 Hayward Andrew 12 Heaney Jude 9 Houlihan Catherine 9 Lorencatto Fabiana 4 Manley Ed 13 Michie Susan
4 Spyer Moira 9 Vora Nina 11 Walker Naomi 13 Nastouli Eleni 4 5, Roger Almvik, Sarah JL Edwards, and Sunjeev K. Kamboj. Perceived coercion amongst healthcare workers during the COVID-19
pandemic. _Sci. Rep_. 15 (1), 4701 (2025). * Roos, P. et al. Protecting oneself while supporting the organisation: A longitudinal exploratory study of healthcare workers’ coping strategies
and organisational resilience processes in the first year of the COVID-19 pandemic. _Saf. Sci._ 181, 106702 (2025). Article Google Scholar * Papa, A. Gaps in mental health care–Seeking
among health care providers during the COVID-19 pandemic—United States, September 2022–May 2023. In _MMWR. Morbidity and Mortality Weekly Report_ 74 (2025). * Komasawa, M. et al.
Determinants maintaining healthcare personnel’s motivation during COVID-19 pandemic in Uganda. _Sci. Rep._ 15(1), 3373 (2025). Article CAS PubMed PubMed Central Google Scholar *
Khadidos, A. O., Manoharan, H., Khadidos, A. O., Selvarajan, S. & Singh, S. Synthetic healthcare data utility with biometric pattern recognition using adversarial networks. _Sci. Rep._
15(1), 9753 (2025). Article CAS PubMed PubMed Central Google Scholar * Fuladi, S. et al. A reliable and privacy-preserved federated learning framework for real-time smoking prediction
in healthcare. _Front. Comput. Sci._ 6, 1494174 (2025). Article Google Scholar * Selvarajan, S. et al. Diagnostic behavior analysis of profuse data intrusions in cyber physical systems
using adversarial learning techniques. _Sci. Rep._ 15(1), 7287 (2025). Article CAS PubMed PubMed Central Google Scholar * Fuladi, S. et al. Linear regressive weighted Gaussian kernel
liquid neural network for brain tumor disease prediction using time series data. _Sci. Rep._ 15(1), 5912 (2025). Article Google Scholar * Natarajan, M., Bharathi, A., Varun, C. S. &
Selvarajan, S. Quantum secure patient login credential system using blockchain for electronic health record sharing framework. _Sci. Rep._ 15(1), 4023 (2025). Article CAS PubMed PubMed
Central Google Scholar * Ghadi, Y. Y. et al. The role of blockchain to secure internet of medical things. _Sci. Rep._ 14(1), 18422 (2024). Article CAS PubMed PubMed Central Google
Scholar * Ghadi, Y. Y. et al. Enhancing patient healthcare with mobile edge computing and 5G: Challenges and solutions for secure online health tools. _J. Cloud Comput._ 13(1), 93 (2024).
Article Google Scholar * Mazhar, T. et al. Analysis of integration of IoMT with blockchain: Issues, challenges and solutions. _Discover Internet Things_ 4(1), 1–36 (2024). Article Google
Scholar * Batta, P. Advancements and challenges in multimodal data fusion for bioinformatics AI. In _Multimodal Data Fusion for Bioinformatics Artificial Intelligence_ 1–12 (Wiley, 2025).
Google Scholar * Ganatra, H. A. Machine learning in pediatric healthcare: Current trends, challenges, and future directions. _J. Clin. Med._ 14(3), 807 (2025). Article CAS PubMed PubMed
Central Google Scholar * Natarajan, A. & Shanthi, N. Optimizing healthcare big data privacy with scalable subtree-based L-Anonymization in cloud environments. _Wirel. Netw._ 31, 1–16
(2025). Article Google Scholar * Rahman, Md Habibur, Tanjila Islam, Mohammad Hamid Hasan Amjad, Md Shihab Sadik Shovon, Md Estehad, Md Rahatul Ashakin Chowdhury, Bayazid Hossain, Proshanta
Kumar Bhowmik, Md Nurullah, & Rahman, A. Impact of Internet of Things (IoT) on Healthcare in transforming patient care and overcoming operational challenges. * Tlemçani, K. et al.
Empowering Diabetes management through blockchain and edge computing: A systematic review of healthcare innovations and challenges. _IEEE Access_ 13, 14426 (2025). Article Google Scholar *
Olalekan Kehinde, A. Leveraging machine learning for predictive models in healthcare to enhance patient outcome management. _Int. Res. J. Mod. Eng. Technol. Sci._ 7(1), 1465 (2025). Google
Scholar * Ogundokun, R.O., Lukman, A.F., Kibria, G.B.M., Awotunde, J.B. & Aladeitan, B.B Predictive modelling of COVID-19 confirmed cases in Nigeria. _Infect. Disease Model_. 5, 543–548
(2020). * Mehla, R., Garg, R. & Khan, M. A. Privacy-preserving solution for data sharing in IoT based smart consumer electronic devices for healthcare. _IEEE Trans. Consum. Electron._
https://doi.org/10.1109/TCE.2025.3540642 (2025). Article Google Scholar * Kothai, G., Harish, P., Ajinesh, D. & Sathyanarayanan, V. Optimizing data privacy and scalability in health
monitoring: Leveraging, encryption, blockchain, and cloud technologies. In _Critical Phishing Defense Strategies and Digital Asset Protection_ 245–270 (IGI Global Scientific Publishing,
2025). Chapter Google Scholar * Lay, W., Gasparini, L., Siero, W. & Hughes, E. K. A rapid review of the benefits and challenges of dynamic consent. _Res. Ethics_ 21(1), 180–202 (2025).
Article Google Scholar * Naghib, A., Gharehchopogh, F. S. & Zamanifar, A. A comprehensive and systematic literature review on intrusion detection systems in the internet of medical
things: Current status, challenges, and opportunities. _Artif. Intell. Rev._ 58(4), 1–88 (2025). Article Google Scholar * Arya, S., Aggarwal, S. & Ansar, S. A. Transforming healthcare
with blockchain and digital twins: innovations in IoMT for smart hospitals. In _Blockchain and Digital Twin for Smart Hospitals_ 497–510 (Elsevier, 2025). Chapter Google Scholar * Prasad,
V.K. et al. CIA-CVD: cloud based image analysis for COVID-19 vaccination distribution. _J. Cloud Comput._ 12, 163. https://doi.org/10.1186/s13677-023-00539-y (2023). * Czekster, R. M.,
Webber, T., Furstenau, L. B. & Marcon, C. Dynamic risk assessment approach for analysing cyber security events in medical IoT networks. _Internet Things_ 29, 101437 (2025). Article
Google Scholar * ElHassan, B. T. & Arabi, A. A. Ethical forethoughts on the use of artificial intelligence in medicine. _Int. J. Ethics Syst._ 41(1), 35–44 (2025). Article Google
Scholar * Deon, L. & Best, T. Zero trust security and cloud security: A modern approach to cyberattack prevention. (2025). * Rahim, M. J., Afroz, A. & Akinola, O. Predictive
analytics in healthcare: Big data, better decisions. _Int. J. Sci. Res. Mod. Technol._ 4(1), 1–21 (2025). Google Scholar * Surya, N. & Someshwar, H. P. Low-Cost telerehabilitation in
low-and middle-income countries (LMICs): Overcoming barriers to access and improving healthcare delivery. _NeuroRehabilitation_ https://doi.org/10.1177/10538135241303349 (2025). Article
PubMed Google Scholar * Davids, J. A. & Hughes, M. A usability study of a set of multidisciplinary professional standards for health professions educators within a healthcare setting.
_Discov. Med._ 2(1), 1–17 (2025). Article Google Scholar * Anand, J. & Karthikeyan, B. Dynamic priority-based task scheduling and adaptive resource allocation algorithms for efficient
edge computing in healthcare systems. _Results Eng._ 25, 104342 (2025). Article Google Scholar * Oluwagbade, E. & Odumbo, O. R. Building resilient healthcare distribution networks:
Adapting to crises, securing supplies and improving scalability. (2025). * Misra, P., Panigrahi, N., Gopal Krishna Patro, S., Salau, A. O. & Aravinth, S. S. PETLFC: Parallel ensemble
transfer learning based framework for COVID-19 differentiation and prediction using deep convolutional neural network models. _Multimed. Tools Appl._ 83(5), 14211–14233.
https://doi.org/10.1007/s11042-023-16084-4 (2024). Article Google Scholar * Penttilä, V., den Hond, F., Fougère, M. & Solitander, N. Decontesting corporate responsibility for
collaboration: A case study of a cross-sector coalition lobbying for human rights regulation. _Bus. Soc._ https://doi.org/10.1177/00076503251317253 (2025). Article Google Scholar *
Kathole, A. B., Mirge, A. S. & Jadhao, A. P. Advancing electronic medical data protection through blockchain innovation. In _Blockchain and Digital Twin for Smart Hospitals_ 193–205
(Elsevier, 2025). Chapter Google Scholar Download references FUNDING Authors declare no funding for this research. AUTHOR INFORMATION AUTHORS AND AFFILIATIONS * Computer Science
Department, Institute of Technology, Nirma University, Ahmedabad, India Vivek Kumar Prasad & Divyang Yadav * Department of Computer Science, Rajendra University, Balangir, Odisha, India
Debabrata Dansana * School of Engineering, Sreenidhi University, Hyderabad, Telangana, 501301, India S. Gopal Krishna Patro * Department of Electrical/Electronics and Computer Engineering,
Afe Babalola University, Ado-Ekiti, Nigeria Ayodeji Olalekan Salau * NIST Institute of Science and Technology (Autonomous), Berhampur, India Brojo Kishore Mishra * Saveetha School of
Engineering, Saveetha Institute of Medical and Technical Sciences, Chennai, Tamil Nadu, India Ayodeji Olalekan Salau * Chitkara University Institute of Engineering and Technology, Chitkara
University, Rajpura, Punjab, India Ayodeji Olalekan Salau Authors * Vivek Kumar Prasad View author publications You can also search for this author inPubMed Google Scholar * Debabrata
Dansana View author publications You can also search for this author inPubMed Google Scholar * S. Gopal Krishna Patro View author publications You can also search for this author inPubMed
Google Scholar * Ayodeji Olalekan Salau View author publications You can also search for this author inPubMed Google Scholar * Divyang Yadav View author publications You can also search for
this author inPubMed Google Scholar * Brojo Kishore Mishra View author publications You can also search for this author inPubMed Google Scholar CONTRIBUTIONS Vivek Kumar Prasad:
Conceptualization, Methodology, Software, Writing- Original draft preparation Debabrata Dansana: Data curation, Visualization, Investigation. S Gopal Krishna Patro: Investigation,
Visualization, Investigation. Ayodeji Olalekan Salau: Data curation, Methodology, Writing- Reviewing, Editing and Validation. Divyang Yadav: Data curation, Visualization, Investigation.
Brojo Kishore Mishra: Validation. CORRESPONDING AUTHOR Correspondence to Ayodeji Olalekan Salau. ETHICS DECLARATIONS COMPETING INTERESTS The authors declare no competing interests.
ADDITIONAL INFORMATION PUBLISHER’S NOTE Springer Nature remains neutral with regard to jurisdictional claims in published maps and institutional affiliations. RIGHTS AND PERMISSIONS OPEN
ACCESS This article is licensed under a Creative Commons Attribution-NonCommercial-NoDerivatives 4.0 International License, which permits any non-commercial use, sharing, distribution and
reproduction in any medium or format, as long as you give appropriate credit to the original author(s) and the source, provide a link to the Creative Commons licence, and indicate if you
modified the licensed material. You do not have permission under this licence to share adapted material derived from this article or parts of it. The images or other third party material in
this article are included in the article’s Creative Commons licence, unless indicated otherwise in a credit line to the material. If material is not included in the article’s Creative
Commons licence and your intended use is not permitted by statutory regulation or exceeds the permitted use, you will need to obtain permission directly from the copyright holder. To view a
copy of this licence, visit http://creativecommons.org/licenses/by-nc-nd/4.0/. Reprints and permissions ABOUT THIS ARTICLE CITE THIS ARTICLE Prasad, V.K., Dansana, D., Patro, S.G.K. _et al._
IoT-based bed and ventilator management system during the COVID-19 pandemic. _Sci Rep_ 15, 19163 (2025). https://doi.org/10.1038/s41598-025-03144-y Download citation * Received: 11 January
2025 * Accepted: 19 May 2025 * Published: 31 May 2025 * DOI: https://doi.org/10.1038/s41598-025-03144-y SHARE THIS ARTICLE Anyone you share the following link with will be able to read this
content: Get shareable link Sorry, a shareable link is not currently available for this article. Copy to clipboard Provided by the Springer Nature SharedIt content-sharing initiative
KEYWORDS * COVID-19 * Health care * IoT * Body sensor network * Cloud computing * Prediction * ARIMA model * Trasnformer