Play all audios:
ABSTRACT To scientifically evaluate the dynamic operational efficiency, spatial differences, as well as the formation mechanisms of the urban Innovation Ecosystem within the Yellow River
Basin is highly important for the high-quality development of China. In the present research, both the economic circulation theory with the Innovation Ecosystem and the Data Envelopment
Analysis – Malmquist Productivity Index (DEA-Malmquist) model were adopted to analysis the database from 59 cities along the Yellow River Basin. In parallel, the kernel density estimation,
the Gini coefficient, and Panel Vector Autoregression (PVAR) model were applied for further comparison. The results revealed that the dynamic operational efficiency of the Innovation
Ecosystem within the Yellow River Basin exhibited an obvious fluctuating downwards trend. The efficiency of spatial distribution in the upstream and midstream basins shows a left-skewed and
polarized pattern, whereas the downstream basins exhibited a right-skewed distribution with less pronounced polarization. The results also revealed that the overall Gini coefficients for
dynamic operational efficiency (TFP) and technical efficiency (EFF) in the Yellow River Basin tended to convergence, whereas those for technological change (TECH) are of an increasing trend.
Moreover, the hypervariable density emerged as the primary factor driving disparities in TFP, TECH, and EFF within the basin. Furthermore, the relationships among TFP, TECH, and EFF were
featured with the regional heterogeneity. In the midstream areas, there existed a self-improvement mechanism for the TFP, TECH, as well as the EFF. However, there was a stronger
self-improvement mechanism for TECH but a self-weakening mechanism for TFP and EFF in the downstream regions. SIMILAR CONTENT BEING VIEWED BY OTHERS EXPLORING THE INNOVATION POTENTIAL OF
URBAN SPACE AT THE MICRO SCALE: A CASE STUDY OF SUZHOU’S MAIN URBAN AREA Article Open access 25 January 2025 SPATIO-TEMPORAL EVOLUTION AND DRIVING FACTORS OF GREEN INNOVATION EFFICIENCY IN
THE CHINESE URBAN TOURISM INDUSTRY BASED ON SPATIAL MARKOV CHAIN Article Open access 09 May 2024 A QUASI-NATURAL EXPERIMENTAL STUDY ON ENTERPRISE INNOVATION DRIVEN BY URBAN AGGLOMERATION
POLICIES IN CHINA Article Open access 26 June 2023 INTRODUCTION The development of Innovation is the most important core for the knowledge economy, which is regarded as the primary driving
force for progress. The Innovation development generally provides some new growth opportunities and essential support for societal advancement and high-quality development of the local
economic1. With the deepening implementation of innovation-driven strategies, the Innovation Ecosystem, as a crucial platform that promotes knowledge creation, technology transfer, and
industrial upgrading, has emerged as a new driving force for regional innovation development. The efficient Innovation Ecosystem is thus generally believed to be the cornerstone for
achieving economic growth and societal progress. By facilitating the rapid exchange of knowledge and promoting open information sharing, the Ecosystem encourages the integration of
innovation ideas. It also boosts entrepreneurial energy and enthusiasm through via the financial support, policy incentives, and technological services. An efficient Innovation Ecosystem
serves as a critical driver for accelerating technological progress and fostering regional economic prosperity. It not only speeds up the development and application of new technologies but
also pushes the boundaries of innovation. Furthermore, it elevates regional innovation capacity and competitiveness through attracting top talent and capital, which contributes to the
achievement of the high-quality economic development and promotes the regional coordination2. The academic community has yet to reach a consensus on the definition of Innovation Ecosystem
Dynamic operational efficiency. However, most scholars agree that it refers to the ability and effectiveness of an Innovation Ecosystem to transform innovation inputs into outputs over a
specific period through the synergistic interactions among its various entities and elements3,4,5. This concept reflects a comprehensive evaluation of the Ecosystem’s performance in resource
allocation, collaborative innovation, and knowledge flow. For example, Liao Kaicheng5 takes the social Ecosystem as a logical starting point, integrating, evolving, and advancing the
operational characteristics of natural and social Ecosystems. On this basis, he analogizes the concept of Innovation Ecosystem dynamic operational efficiency. Chen Yizao6 using the
innovation value chain as a framework, constructs a regional Innovation Ecosystem encompassing four Innovation clusters: “policy Innovation environment, original Innovation R&D,
technological Innovation application, and technological Innovation services,” and measures its Innovation Ecosystem operational efficiency. Building on these conceptualizations, this study,
grounded in economic circulation theory, constructs an Innovation Ecosystem framework that includes inputs (Innovation resources, Market environment, and Consumer demand) and outputs
(Innovation patent outcomes and industrial value-added benefits). The DEA-Malmquist method is employed to assess the efficiency of value transformation within the Innovation elements. The
Yellow River Basin, recognized as the cradle of Chinese civilization, stands as a pivotal region of cultural heritage and economic significance in terms of the agriculture, energy, and other
heavy industries. Spanning a vast area, this region is also famous for its abundant natural resources and diverse industrial structure, marked by distinct intraregional and interregional
connectivity7. With the increasing attention given by the government to the development of the central and western regions and the application of the “14 th Five-Year Plan”, the Yellow River
Basin has ushered in new opportunities, particularly in promoting regional coordinated development and industrial transformation and upgrading associated with enormous potential.
Nevertheless, the Basin faces challenges due to the uneven distribution of Innovation resources and underdeveloped mechanisms for technological Innovation8. These issues have historically
impeded the region’s capacity for Innovation development9. Traditional industries in the Yellow River Basin face significant pressure to transform and upgrade, with technological Innovation
emerging as a critical driver for enhancing competitiveness and achieving high-quality development10. A thorough investigation into the Innovation Ecosystem operational efficiency of the
Innovation Ecosystem in this region is of paramount importance. On one hand, it facilitates the optimization of resource allocation, improves resource utilization efficiency, and promotes
industrial upgrading and economic transformation, thereby enhancing competitiveness11. On the other hand, it helps narrow regional disparities, fosters coordinated regional development,
strengthens knowledge and technology exchange, and collectively addresses challenges12. Furthermore, the research outcomes can provide valuable support for government decision-making and
optimize Innovation policies. Given this context, this study focuses on the Yellow River Basin, employing the DEA-Malmquist index method to dynamically evaluate the Innovation Ecosystem
operational efficiency of the Innovation Ecosystem across 59 prefecture-level cities from 2009 to 2023. The basin is divided into three regions: the upstream, midstream and the downstream
(Table 1). The upper reach (e.g., Xining, Lanzhou) is characterized by abundant water resources and unique ecological environments, serving as a critical water conservation area with
potential for clean energy development. The middle reach (e.g., Yinchuan, Hohhot, Xi’an) features diverse topography, including agriculturally rich areas like the Hetao Plain and
ecologically fragile zones like the Loess Plateau, while also being a significant energy production base. The lower reach (e.g., Zhengzhou, Jinan) is relatively flat, densely populated, and
economically advanced, with strong agricultural and industrial foundations, but faces challenges such as water scarcity and ecological pressures. Using kernel density estimation, this study
assesses the spatiotemporal evolution characteristics of the Innovation Ecosystem operational efficiency in the Yellow River Basin. The Gini coefficient is applied to explore regional
disparities in efficiency and their influencing factors. Finally, a PVAR model is utilized to analyze the intrinsic operational mechanisms of the Innovation Ecosystem in the Yellow River
Basin. LITERATURE REVIEW An Ecosystem is a unified entity formed through the interaction and interdependence of biological communities and their abiotic environment within a specific time
and space. It performs critical functions, including material cycling, energy flow, information transfer, and ecological services13. Due to the analogous characteristics of Ecosystems and
social systems, scholars have adapted the Ecosystem concept to the social sciences. In the 1990 s, the U.S. government, in its report Science in the National Interest, compared the science
and technology enterprise to an Ecosystem rather than a production line. Concurrently, Moore introduced the “business Ecosystem” concept, framing enterprises as “species” within an Ecosystem
and emphasizing co-evolution among participants14. As research advanced, the theory of Innovation Ecosystem expanded from business to broader Innovation contexts. This concept subsequently
attracted significant academic attention. For example, scholars have defined and extended the Innovation Ecosystem from diverse perspectives. Huang Lucheng15,16 proposed the “regional
technological Innovation Ecosystem,” describing it as a dynamic and complex system formed by the interaction and interdependence of technological Innovation entities and their environments
within a specific spatial scope. Wu Jinxi17 further elaborated on the concept, defining an Innovation Ecosystem as a relatively stable and closed organizational structure shaped by the
mutual dependence and collaboration of multiple Innovation entities and elements. Additionally, Etzkowitz and Leydesdorff18 introduced the “Triple Helix” Innovation theory, emphasizing the
role of interactions among universities, industries, and governments in shaping Innovation systems. Following the evolution of these core concepts, research has expanded to specific regions,
with detailed explorations into the construction of indicator systems and the application of research methodologies. A key research focus is the scope of investigation. He et al.19 explored
the impact of coordinated agglomeration between financial and manufacturing industries on manufacturing Innovation efficiency across 11 provinces along the Yangtze River Economic Belt. Sun
et al.20 utilized gravity-standard deviation ellipse and Dagum Gini coefficient methods to revel the spatiotemporal differentiation characteristics of green Innovation development in the
Inner Mongolia Yellow River Ecological Economic Belt. Another research carried by Fan Yufeng Ma et al.21 concentrated on the Beijing-Tianjin-Hebei urban agglomeration. They adopted the
super-efficiency SBM model and ML index to analyse Innovation efficiency within this urban cluster. Similarly, Liu et al.22 investigated the high-tech industries in the Pearl River Delta,
employing the DEA-Malmquist index and ESDA model to measure Innovation efficiency and empirically analyse the in-behind driving factors. Li Ying et al.23 analyzed the spatial evolution of
industrial technology Innovation efficiency in the Guangdong-Hong Kong-Macao Greater Bay Area from a dynamic perspective, employing the Malmquist index. Similarly, Yuan Rong et al.24
investigated the spatial differentiation and influencing factors of technological Innovation efficiency in the Yangtze River Delta region, utilizing a super-efficiency SBM model combined
with the Malmquist index. In terms of quantitative methods, initial research primarily focused on qualitative descriptions of various elements within Innovation Ecosystem. As studies
progressed, scholars began to develop quantitative evaluation systems. Some studies on constructing evaluation index systems for Innovation Ecosystem dynamic operational efficiency are based
on production function theory. For instance, Wang Yin and Sun Yi et al.25 developed an evaluation framework for Innovation Ecosystem based on the dual characteristics classification and
Innovation mechanisms. Ou Guangjun et al.26 assessed the capabilities of Innovation Ecosystem through the design of indicators and evaluation systems, emphasizing the importance of openness
and population structure dimensions. Yan Li27 introduced Innovation environment variables into Innovation inputs, constructing a relatively comprehensive model for evaluating Innovation
efficiency, and was the first to propose the combined use of principal component analysis and DEA methods to measure regional Innovation efficiency in China. Su Yaohua and Li Quan28 divided
the Innovation process into two stages—research and development, and achievement transformation—to build an indicator system, and employed stochastic frontier analysis to estimate the
Innovation efficiency of high-tech industries. He et al.29 constructed an industrial evaluation index system based on three stages: assimilation, growth, and utilization. This system was
applied to measure the Innovation Ecosystem dynamic operational efficiency of 15 high-tech industries in China, identifying potential pathways for improvement. Liao et al.5 created an
evaluation index system with 87 indicators on the basis of Innovation input-output theory. Their study investigated regional disparities in dynamic operational efficiency and the formation
mechanisms across China. In a related approach, Fan et al.30 established an index system focusing on technological research and development, environmental support, and results
transformation. This system was utilized to evaluate and analyse the determinants of green technological Innovation efficiency in 82 cities along the Yellow River Basin. In terms of
measurement of Innovation Ecosystem dynamic operational efficiency, data envelopment analysis (DEA) and stochastic frontier analysis (SFA) are domestically and internationally applied. Liu
et al.31 employed a multiperiod network DEA model to evaluate enterprise-level efficiency in technological Innovation, R&D, and outcome transformation within enterprises. Lu et al.32
applied a panel threshold model to analyze how foreign direct investment (FDI) and economic development levels influence agricultural technological Innovation in China. Fan et al.33 employed
a super-efficiency SBM model to assess the efficiency of green technological Innovation in Chinese industry. They highlighted how the misallocation of R&D resources affects this
efficiency. Wang et al.34 utilized SBM-DEA to study China’s green Innovation efficiency, regional differences, and spatial convergence characteristics. Zhang et al.35 implemented a
three-stage DEA-Malmquist approach to evaluate the dynamic and static Innovation efficiency of listed CNC machine tool companies. Li et al.36 measured green Innovation efficiency in the
manufacturing sector across 11 provinces and cities along the Yangtze River Economic Belt using a super-efficiency SBM model that accounts for undesirable outputs. Zhao et al.37 assessed the
green Innovation efficiency across 30 provinces in China from 2000 to 2020, utilizing the SBM-DDF-GML model. Kang Xia et al.38 applied the coefficient of variation method and the global
Malmquist-GML index to evaluate the efficiency of science and technology development in China’s coastal land-sea coordination plans between 2006 and 2015. Their analysis also highlighted
regional variations among these plans. There are several limitations in terms of regional Innovation Ecosystem dynamic operational efficiency. First, most studies related to regional
Innovation Ecosystem dynamic operational efficiency focus on the provincial level, with insufficient exploration at the municipal level. Second, input indicators predominantly emphasize
funding and manpower, overlooking the Innovation value generated during the Innovation chain development process. This narrow input-output perspective leads to an incomplete evaluation
system. Third, the existing literature has mostly concentrated on the efficiency of Innovation systems in a single region or industry, with limited analyses of spatial structures and
evolutionary patterns of regional Innovation efficiency. Finally, most studies emphasize the overall operational efficiency of the Innovation Ecosystem while inadequately addressing regional
disparities. In particular, the roles of both intrinsic factors and dynamic relationships have not been comprehensively integrated into a unified framework for analysis. In light of these
limitations, further research to develop a more comprehensive and detailed evaluation system for regional Innovation Ecosystem is thus requested. The potential contributions of the present
research are as follows: First, it integrates the concept of the Innovation Ecosystem is integrated with economic circular theory upon the municipal scale. This integration establishes a
research framework called the “Innovation Ecosystem operation chain”, which emphasizes the close connection and synergistic effects of various stages in the Innovation process is
established; Second, it develops a comprehensive evaluation index system termed as “the Innovation chain”, which consists of the Innovation research and development, the outcome promotion,
and the application segment. By considering dynamic interactions within the system, it provides a novel perspective and method for assessing Innovation Ecosystem dynamic operational
efficiency. Third, it employs the PVAR model to investigate the dynamic relationships and interactions between the Innovation Ecosystem dynamic operational efficiency of the Innovation
Ecosystem and its decomposed variables in the Yellow River Basin. The importance of understanding and utilizing these inherent mechanisms in practice is emphasized, aiming to promote the
sustainable development of the Innovation Ecosystem in the Yellow River Basin and the comprehensive revitalization of the regional economy through data-driven decision support. Overall, this
study not only expands the theoretical understanding of the intrinsic driving mechanisms of the Innovation Ecosystem, but also provides a powerful analytical tool closely linked to
practical applications. It provides valuable guidance for Innovation practices in the Yellow River Basin and beyond, enhancing the understanding and utilization of Innovation Ecosystem
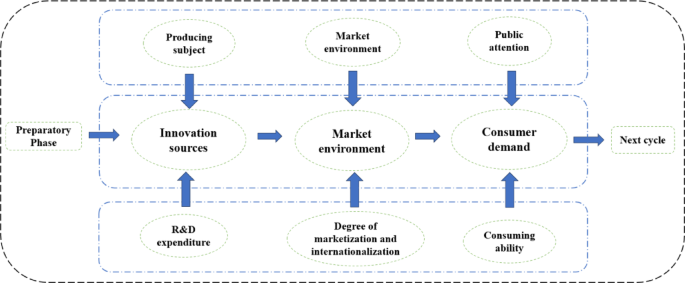
dynamics for sustainable development and regional economic growth. RESEARCH DESIGN THEORETICAL MECHANISM OF EVALUATION INDEX SYSTEM Based on economic circular theory, we constructed an
Innovation Ecosystem that encompasses input-output dynamics (Table 2). The input system comprises three dimensions: “Innovation sources”, “Market environment” and “Consumer demand” (Table
3). The output system includes “Innovation patent achievements” and “industrial value-added benefits”, measured by the number of patents granted and industrial added value, respectively. As
can be seen from Table 2, “Innovation sources” refers to the origin or foundation of Innovation, serving as the initial driving force for Innovation activities. It is primarily realized
through the active participation of production entities (e.g., enterprises, research institutions) and investments in R&D expenditures. As the core force of Innovation, production
entities, combined with sufficient financial support, constitute the starting point of Innovation; “Market environment” represents the ecological and contextual conditions in which
Innovation occurs, determining whether Innovation can proceed smoothly and sustainably. Key factors such as market conditions, marketization level, and internationalization degree provide
essential ecological support for Innovation activities; and “Consumer demand” emphasizes external driving forces in Innovation, particularly the role of public attention and consumer
capacity in promoting Innovation. These factors provide stronger momentum for Innovation activities and reflect the extent to which Innovation outcomes are successfully integrated into
markets and society. The theory of Innovation Ecosystem is inspired by ecological studies, which employ biological metaphors to illustrate the structure, dynamics, and interactions among
participants. In particular, their connection to the external environment in Innovation activities. Correspondingly, the Innovation activities of the Innovation Ecosystem are divided into
three stages (i.e., the Innovation sources, Market environment and Consumer demand), and the operational framework of which is illustrated in Fig. 1 for reference. RESEARCH METHODS
MEASUREMENT OF THE INNOVATION ECOSYSTEM DYNAMIC OPERATIONAL EFFICIENCY OF THE INNOVATION ECOSYSTEM This study employs the DEA-Malmquist index to assess the Innovation Ecosystem dynamic
operational efficiency of the Innovation Ecosystem in the Yellow River Basin. The Malmquist index method, grounded in Data Envelopment Analysis (DEA), is a non-parametric approach for
evaluating dynamic performance. It captures the efficiency evolution of decision-making units over time39. Its fundamental principle is as follows: Assume there are _n_ decision-making units
over _t_ production periods, with (\(\:{X}_{r}^{t+1}\),\(\:{Y}_{r}^{t+1})\) representing the inputs and outputs for the _r__th_ decision-making unit in period _t_ + 1. Let
\(\:{D}_{r}^{t}\)(\(\:{X}_{r}^{t+1}\), \(\:{Y}_{r}^{t+1}\)) denote the Innovation Ecosystem dynamic operational efficiency change of decision-making unit _r_ in period _t_ + 1 based on the
production frontier at time _t_. The Malmquist total factor productivity index for the _r__th_ decision-making unit from time _t_ to _t_ + 1 is calculated as follows:
$$\:{M}_{r}={\left[{M}_{r}^{t}\:{*}\:{M}_{r}^{t+1}\right]}^{\frac{1}{2}}={\left[\frac{{D}_{r}^{t}\left({X}_{r}^{t+1}, {Y}_{r}^{t+1}\right)}{{D}_{r}^{t}\left({X}_{r}^{t},
{Y}_{r}^{t}\right)}{*}\:\frac{{D}_{r}^{t+1}\left({X}_{r}^{t+1}, {Y}_{r}^{t+1}\right)}{{D}_{r}^{t+1}\left({X}_{r}^{t}, {Y}_{r}^{t}\right)}\right]}^{\frac{1}{2}}$$ (1) A value of
\(\:{M}_{r}\)>1 indicates an increase in Innovation Ecosystem dynamic operational efficiency from period _t_ to _t_ + 1, while a value less than 1 suggests a decrease. TFP can be further
decomposed into two parts: EFF and TECH, with the formula: $$M_{r}={\rm EFF*TECH}=\:\frac{{D}_{r}^{t+1}\left({X}_{r}^{t+1}, {Y}_{r}^{t+1}\right)}{{D}_{r}^{t}\left({X}_{r}^{t},
{Y}_{r}^{t}\right)}* \:{\left[\frac{{D}_{r}^{t}\left({X}_{r}^{t}, {Y}_{r}^{t}\right)}{{D}_{r}^{t+1}\left({X}_{r}^{t}, {Y}_{r}^{t}\right)}*\:\frac{{D}_{r}^{t}\left({X}_{r}^{t+1},
{Y}_{r}^{t+1}\right)}{{D}_{r}^{t+1}\left({X}_{r}^{t+1}, {Y}_{r}^{t+1}\right)}\right]}^{\frac{1}{2}}$$ (2) Herein, EFF > 1 implies an improvement in technical efficiency, whereas a value
less than 1 indicates a decline. Similarly, TECH > 1 signifies technological advancement, while a value less than 1 indicates technological regression. SPATIAL DISTRIBUTION OF THE
INNOVATION ECOSYSTEM DYNAMIC OPERATIONAL EFFICIENCY Kernel density estimation is a non-parametric statistical technique to estimate the probability density function of a set of data. By
generating a continuous probability density curve, it visualizes the distribution of a random variable. This method effectively reveals the temporal evolution patterns of TFP, TECH, and EFF
in the upper, middle, and downstream of the Yellow River Basin. The mathematical formulations are as follows: $${\rm
f(y)}=\:\frac{1}{N\text{h}}\sum\:_{j=1}^{N}K\left(\frac{{y}_{j}-\stackrel{-}{y}}{h}\right)$$ (3) $${\rm K(y)}\:\frac{1}{\surd\:\left(2\varPi\:\right)}{\rm exp}(\:-\frac{{y}^{2}}{2})$$ (4)
Where (f(y)) represents the density function of the random variable y, N and j denote the number of sample points and basin units, K(·) is the kernel function, and h is the bandwidth40. The
kernel function value, (K(y; h)), decreases as the distance between the point to be estimated, y, and the sample points increases. This means that the probability density estimate of a point
is larger when there are more sample points near it, and vice versa. MEASUREMENT OF SPATIAL DIFFERENCES This study utilizes the Dagum Gini coefficient decomposition method41 to analyze the
spatial heterogeneity of TFP, TECH, and EFF in the upper, middle, and downstream of the Yellow River Basin. This approach decomposes the overall difference into three components:
intraregional differences, interregional differences, and trans-variation density. The mathematical expression for this decomposition is as follows: $$\:\text{G}={G}_{w}+{G}_{nb}+{G}_{t}$$
(5) $${\rm G}=\:\frac{\sum\:_{j=1}^{k}\sum\:_{\text{h}=1}^{k}\sum\:_{i=1}^{{n}_{j}}\sum\:_{r=1}^{{n}_{h}}|{m}_{ji}-{m}_{hr}|}{2\mu\:{n}^{2}}$$ (6)
$$\:{G}_{w}=\sum\:_{j=1}^{k}{G}_{jj}{p}_{j}{s}_{j}$$ (7) $$\:{G}_{jj}=\frac{\sum\:_{i=1}^{{n}_{j}}\sum\:_{r=1}^{{n}_{h}}|{m}_{ji}-{m}_{jr}|}{{n}_{j}{n}_{h}({\mu\:}_{j}+{\mu\:}_{h})}$$ (8)
$$\:{G}_{nb}=\sum\:_{j=2}^{k}\sum\:_{\text{h}=1}^{j-1}{G}_{jh}({p}_{j}{s}_{h}+{p}_{h}{s}_{j}){D}_{jh}$$ (9)
$$\:{G}_{t}=\sum\:_{j=2}^{k}\sum\:_{\text{h}=1}^{j-1}{G}_{jh}({p}_{j}{s}_{h}+{p}_{h}{s}_{j})(1-{D}_{jh})$$ (10) $$\:{G}_{jh}=\frac{{d}_{jh}-{p}_{jh}}{{d}_{jh}+{p}_{jh}}$$ (11)
$$\:{d}_{jh}={\int\:}_{0}^{\infty\:}d{F}_{j}\left(m\right){\int\:}_{0}^{m}\left(m-x\right)d{F}_{h}\left(x\right)$$ (12)
$$\:{p}_{jh}={\int\:}_{0}^{\infty\:}d{F}_{h}\left(m\right){\int\:}_{0}^{m}\left(m-x\right)d{F}_{j}\left(x\right)$$ (13) Here, k represents the number of basins,\(\:{n}_{j}\)(\(\:{n}_{h}\))
denotes the number of cities within the jth(hth) basin, and \(\:{m}_{ji}\)(\(\:{m}_{hr}\)) represents the Innovation Ecosystem dynamic operational efficiency of the Innovation Ecosystem in
the ith(rth) city within the jth(hth) basin. \(\:\mu\:\) indicates the average Innovation Ecosystem dynamic operational efficiency of the Yellow River Basin. \(\:{G}_{w}\) represents the
contribution of within-basin differences, \(\:{G}_{nb}\) represents the contribution of between-basin differences, and \(\:{G}_{t}\) represents the contribution of super-dense density.
\(\:{p}_{j}\)=\(\:{n}_{j}\)/n, \(\:{s}_{j}\)=\(\:{n}_{j}{\mu\:}_{j}\)/n\(\:\mu\:\), where \(\:{G}_{jj}\) represents the intra-group Gini coefficient for the jth city group, \(\:{G}_{jh}\)
represents the interregional Gini coefficient between the jth and hth city groups, and \(\:{D}_{jh}\) represents the relative impact of Innovation Ecosystem dynamic operational efficiency
between the jth and hth city groups. MEASUREMENT OF THE OPERATIONAL MECHANISM OF INNOVATION ECOSYSTEM DYNAMIC OPERATIONAL EFFICIENCY The Panel Vector Autoregression (PVAR) model is a
multivariate time series analysis method based on the Vector Autoregression (VAR) model, which was firstly introduced by Holtz Eakin et al. (1988)42. This model integrates time series data
from multiple variables into a unified panel dataset, facilitating the exploration of causal relationships and the prediction of future trends. Unlike conventional VAR models, the PVAR model
treats all variables as endogenous, eliminating the need for predefined causal assumptions. It examines the influence of each variable and its lagged terms on other variables within the
system. The PVAR model overcomes two significant limitations of traditional VAR models: the necessity for extensive time series data and the inability to account for individual
heterogeneity. By utilizing panel data, it incorporates both individual and time effects, thereby enhancing its analytical rigor. in the present research, a PVAR model43 was constructed to
investigate the dynamic relationships between TFP, TECH, and EFF, with the specific formula listed in below:
$$\:{y}_{i,t}={\beta\:}_{0}+{\sum\:}_{m=1}^{p}{\alpha\:}_{m}{y}_{i,t-m}+{f}_{i}+{d}_{i}+{\mu\:}_{i,t}$$ (14) The PVAR model captures the dynamic relationships between TFP, TECH, and EFF. In
the model, the vector \(\:{y}_{i,t}\)represents the combination of TFP, TECH, and EFF, \(\:{\beta\:}_{0}\) represents the intercept, \(\:{\alpha\:}_{p}\) represents the coefficient matrix,
\(\:{y}_{i,t-m}\) represents the lag of all endogenous variables up to order m, \(\:{f}_{i}\) and \(\:{d}_{i}\) represent the fixed effects and time effects respectively, and
\(\:{\mu\:}_{i,t}\) represents the random disturbance term. INDEX SELECTION AND DATA SOURCE Following the research carried by Kang and Li44, this study utilizes the range transformation
method to normalize individual indicator. The entropy method is subsequently applied to determine the weights of these indicators. The normalization values of corresponding tertiary
indicators fare weighted and aggregated to compute the results for primary and secondary indicators, as summarized in Table 3. This study evaluates the dynamic operational efficiency of the
Innovation Ecosystem across 59 prefecture-level cities within the Yellow River Basin. The data utilized in this research, such as: “Innovation” index and “Technology” index are sourced from
the official website of Baidu Index Query(https://index.baidu.com_);_ Marketization index, Foreign investment utilization amount are sourced from the EPS database
(https://www.epsnet.com.cn_)._ Number of regular higher education institutions, Full-time teachers in regular higher education institutions, Students in regular higher education
institutions, Research and technical personnel, Education personnel, Number of enterprises above designated size, Average number of employees on duty, Marketization index, Foreign investment
utilization amount, Resident consumption level, Government consumption level are sourced from the _City Statistical Yearbooks_; Per capita GDP, Education expenditure, Science expenditure,
Proportion of tertiary industry added value are sourced from the _Urban Statistical Bulletins_. Where data for specific city indicators are missing, they are filled using either exponential
smoothing or interpolation methods. EMPIRICAL ANALYSIS MEASUREMENT AND ANALYSIS OF THE INNOVATION ECOSYSTEM DYNAMIC OPERATIONAL EFFICIENCY OF THE INNOVATION ECOSYSTEM IN CITIES ALONG THE
YELLOW RIVER BASIN. OVERVIEW DESCRIPTION The Malmquist index method was adopted in this section to calculate TFP, TECH, and EFF of the Innovation Ecosystem in cities along the Yellow River
Basin from 2009 to 2023. Owing to space constraints, only the efficiency values for the years 2009, 2014, 2019, and 2023 are presented here. The specific results are provided in Table 4;
Fig. 2. From 2009 to 2023, the TFP in the Yellow River Basin decreased from 0.945 to 0.898, representing a notable decline. During the same period, the TECH and EFF remained relative
stability. This divergence indicates stagnant technological advancement and efficiency improvements have constrained productivity growth, reflecting reduced Innovation-driven production
efficiency and suboptimal resource allocation. Meanwhile, the policymakers may need to prioritize both the resource management and technological Innovation strategies to drive sustainable
regional development. It is in 2009 that the effective rate of TFP, defined as the proportion of areas with efficiency values greater than 1, stood at 37%. This metric revealed a distinct
spatial efficiency gradient, with the upper basin demonstrating superior performance compared to the middle and lower reaches, reflecting significant regional disparities in Innovation
capacity. By 2014, the effective rate had declined to 24%, indicating a substantial decline in the dynamic operational efficiency. This downward trend highlights the urgent need to optimize
the Innovation environment and boost the vitality of Innovation efforts. The period from 2019 to 2023 witnessed the development pattern in the Yellow River Basin evolved. Initially, the
middle reaches had efficiency advantages, whereas the upper and lower reaches struggled. Over time, the development became more balanced across the upper, middle, and lower reaches. However,
this shift also highlighted ongoing challenges in resource allocation and technological Innovation. These findings suggest that achieving coordinated basin-wide development will require
targeted policy interventions and structural reforms to strengthen Innovation Ecosystem and optimize resource distribution. The effective rates of TECH in 2009 and 2014 remained consistently
low at 14% and 15%, respectively. By 2019, TECH in the upstream region had increased, reflecting significant progress in technological Innovation that positively impacted the region’s
economic development and competitiveness. By 2023, TECH experienced basin-wide enhancement, indicating that Innovation entities actively developed new models and technologies to strengthen
regional Innovation capabilities. This progress underscores the growth adaptability and technology absorption capacity of Innovation entities, as well as the positive impact of policy
guidance in driving regional Innovation Ecosystem dynamic operational efficiency. It should be noted that the effective rate of EFF’s Innovation Ecosystem dynamic operational efficiency in
2009 reached 49%, demonstrating widespread improvement across all streams of the basin. Between 2014 and 2019, this rate increased from 27 to 42%, accompanied by a spatial transformation
from an “upper-middle stream dominance” pattern to a “middle-lower stream leadership” structure in the Yellow River Basin. This shift revealed the growth from the upper and middle reaches to
the middle and lower reaches, demonstrating the potential and advantages of the middle and lower reaches in Innovation and efficiency increase. By 2023, the development of EFF in the Yellow
River Basin faced significant challenges. Inefficiencies were prevalent across the upstream, middle stream, and downstream. These issues highlighted deficiencies in management practices and
institutional frameworks. This revealed a disconnection between technological Innovation and practical application within the basin. Optimizing the Innovation management system is now
crucial. Enhancing technical efficiency is essential for promoting an efficient and sustainable development of the Innovation Ecosystem. TEMPORAL EVOLUTION PATTERNS AND SPATIAL DISTRIBUTION
CHARACTERISTICS OF THE DYNAMIC OPERATIONAL EFFICIENCY OF THE INNOVATION ECOSYSTEM IN THE YELLOW RIVER BASIN Kernel density functions visually depict the temporal evolution patterns and
spatial distribution characteristics of variables. Therefore, this study utilizes Gaussian kernel density estimation to analyse the Innovation Ecosystem dynamic operational efficiency of the
Innovation Ecosystem in the Yellow River Basin. Three-dimensional kernel density evolution maps of the overall Yellow River Basin (Fig. 3) and the upstream (Fig. 4), midstream (Fig. 5), and
downstream (Fig. 6) of the Innovation Ecosystem dynamic operational efficiency of the Innovation Ecosystem were generated via MATLAB 2023. From the perspective of TFP, the Yellow River
Basin, including its upstream and midstream, displays a left-skewed kernel density curve during the study period. Peak characteristics alternate between unimodal and bimodal patterns,
indicating TFP decline and increasing polarization. However, the downstream region shows the opposite trend, with no significant polarization. The peak states of the Yellow River Basin and
the upper, middle, and downstream transitions from “low and flat” or “low and sharp” to “high and sharp”. This transition suggests reduced regional disparities and a convergence trend in
TFP. In terms of TECH, the Yellow River Basin and its middle to downstream regions display right-skewed kernel density curves, primarily unimodal. This indicates a rising trend in TECH with
no significant polarization. All three regions exhibit similar shifts in peak distribution shifts, pointing to increasing regional disparities in TECH. The upstream, however, shows the
opposite development trend with distinct peak states and characteristics. Specifically, the regional differences in TECH in the upstream initially narrow but later widen, accompanied by
emerging polarization. During the study period, both the entire basin and the downstream show a trend of rightward movement in the distribution of EFF. However, their peak states displayed
spatially opposite evolutionary patterns. This indicates the increased EFF within these regions, their regional differences are developing in opposite directions. Specifically, the regional
differences decreased across the basin but increased in the downstream. A polarization emerged gradually in the basin but declined downstream. Both the upstream and midstream experienced the
declined EFF trend with polarization signs. The spatial distribution narrowed progressively in the upstream, while the midstream differences weakened initially before intensifying. REGIONAL
DIFFERENCE EVOLUTION CHARACTERISTICS OF THE DYNAMIC OPERATIONAL EFFICIENCY OF THE URBAN INNOVATION ECOSYSTEM IN THE YELLOW RIVER BASIN This study applied the Dagum Gini coefficient
decomposition method to examine the spatial difference evolution characteristics of the Innovation Ecosystem dynamic operational efficiency of the Innovation Ecosystem across the Yellow
River Basin. Figures 7 and 8 present the temporal trends of the Gini coefficients (GTFP, GTECH, GEFF) for TFP, TECH, and EFF from 2009 to 2023. These figures compare patterns in the entire
basin with those in its upper, middle, and downstream regions. ANALYSIS OF INTRAREGIONAL DISPARITIES Regional disparity analysis in Fig. 7 reveals three key patterns. Both the GTFP and GEFF
exhibit a “decrease-increase-decrease” trend, with annualized rates of −3.532% and − 2.775%, respectively. This pattern suggests progressive narrowing of TFP and EFF gaps among basin cities.
Conversely, GTECH shows fluctuating growth (0.0078% annual rate) from 2009 to 2023, indicating widening TECH disparities. Mean values further clarify these trends: GTFP (0.108) closely
approximates GEFF (0.106), demonstrating aligned spatial divergence patterns for these metrics. Notably, GEFF changes emerge as the dominant factor in GTFP variation, while GTECH changes
exert comparatively minor influence. Figure 8 illustrates the evolution of intraregional disparities in TFP, TECH, and EFF within the Innovation Ecosystem of the Yellow River Basin from 2009
to 2023. The upstream region shows declining disparities, with GTFP and GEFF decreasing at annual average rates, respectively. Conversely, GTECH increases at an annualized rate of 0.028%,
indicating widening TECH disparities. Mean disparity values reveal a clear hierarchy: GTFP (0.1297) > GEFF (0.1186) > GTECH (0.0692). The parallel trends observed between TFP and EFF
suggest that GEFF fluctuations predominantly drive GTFP variations. This pattern highlights Innovation Ecosystem dynamic operational efficiency as a critical determinant of total factor
productivity dynamics in the upstream region. During the fourteen years, the midstream region of the Yellow River Basin showed decreasing disparities in TFP, TECH and EFF. The observed
average annual decline rates reached − 0.02497%, −0.01537% and − 0.02374%, respectively. It indicates gradual improvement in balanced development across these three indicators. Mean values
of GTFP, GTECH, and GEFF measured 0.0986,0.0644 and 0.1036 respectively. Disparity magnitudes followed the order: EFF > TFP > TECH. The parallel evolution of TFP and EFF metrics
suggest that fluctuations in GEFF predominantly drive variations in GTFP. The downstream region exhibited negative annual growth rates in green total factor productivity (GTFP) components,
with mean declines of −0.02497% (TFP), −0.01537% (TECH), and − 0.02374% (EFF), signaling progressive convergence among these metrics. Notably, synchronicity emerged between intraregional
GTFP and GEFF fluctuation patterns, revealing coordinated spatial dynamics of TFP and EFF. This covariation strongly implies GEFF variations constitute the principal driver of GTFP
fluctuations in the basin’s lower reaches. In conclusion, the TFP, TECH, and EFF in the upstream, midstream, and downstream of the Yellow River Basin exhibit spatial heterogeneity.
Critically, metrics exhibit the spatial convergence, with EFF variations serving as the primary driver of TFP divergence dynamics. This causal asymmetry establishes a cascade-type
interdependency between the two factors, wherein localized EFF fluctuations propagate disproportionately through the productivity system—a phenomenon analogous to a “butterfly effect” in
regional economic-environmental linkages. INTERREGIONAL DIFFERENCE ANALYSIS Table 5 delineates divergence dynamics in TFP, TECH, and EFF of the across urban Innovation Ecosystem in the
Yellow River Basin. It is from 2009 to 2023 that TFP’s annual average growth rate was negative across the regions, signaling a convergence in disparities. Spatial decomposition highlights
elevated disparity coefficients between upper-middle (0.1262) and upper-lower (0.1296) strata, surpassing middle-lower differentials (0.1098). This tiered disparity structure underscores
systemic productivity gaps isolating upstream regions, attributable to compounded deficits in technological Innovation infrastructure and resource mobility efficiency. The annual average
growth rates of TECH between the upper-middle and upper-lower streams were positive, indicating an expansion in their degrees of differentiation. Conversely, the degree of differentiation
between the middle and lower reaches exhibited a narrowing trend. The dynamic evolution trends and mean values between the upper-middle, upper-lower, and middle-downstream are approximately
equal, showing a similar convergence in TECH disparities between regions. EFF disparities displayed accelerated convergence, with upper-middle, upper-lower, and middle-lower strata recording
annualized decline rates of −3.741%, −3.879%, and − 1.505%, respectively. This indicates that the convergence rate between the upper-middle and upper-lower streams was faster than that
between the middle-lower streams. Analysis of the mean values revealed that the interregional differences between the upper-middle and upper-lower streams were greater than those between the
middle-lower streams. In summary, the degree of differentiation in TFP between the upper-middle and upper-lower reaches displayed a converging trend, whereas TECH demonstrated
countervailing divergence. The differences in TFP and EFF were similar between the upper-middle and upper-lower reaches and were greater than those between the middle-lower streams.
Crucially, the convergence rate between the upper-middle and upper-lower stream was more significant than that between the middle-lower streams. DISPARITY SOURCES AND CONTRIBUTION ANALYSIS
As quantified in Table 6 and visualized in Fig. 9, the sources and contributions of regional differences in TFP, TECH, and EFF within the Innovation Ecosystem of the Yellow River Basin
exhibits distinct drivers of regional productivity disparities. The hyper density (HD) contributed 43.757% to overall TFP differences, making it the primary source of variation.
intraregional differences (IN) contributed 31.428%, while interregional differences (BT) had an average contribution of 24.816%. Significant variability was observed in the contribution
rates of HD and BT during the study period. HD’s contribution to TECH differences fluctuated between 22% and 61%, whereas BT’s contribution ranged from 4 to 48%. In contrast, IN’s
contribution to TECH differences remained stable at approximately 32.831%. With respect to the dynamic changes in contribution rates, BT had the largest average contribution to overall EFF
differences but showed a decreasing trend. IN’s contribution to EFF differences exhibited minor changes, whereas HD’s contribution to EFF differences displayed an oscillating upwards trend.
HD’s contribution decreased from 42.07% in 2009 to 32.492% in 2014, then increased to 33.081% in 2018, and finally reached 43.871% in 2023. It has been well identified that the HD is the
principal factor affecting the fluctuations in TFP, TECH, and EFF differences in the Yellow River Basin. This observation indicates a high degree of overlap and interaction among the upper,
middle, and down streams. IN maintained stable contributions (29–33%), demonstrating persistent subregional Innovation inertia. Considering that the smallest impact of BT, reducing HD
differences within the upper, middle, and lower regions is believed to be crucial to improve the Innovation Ecosystem dynamic operational efficiency of the Yellow River Basin. ANALYSIS OF
THE FORMATION MECHANISM OF REGIONAL DIFFERENCES IN THE DYNAMIC OPERATION EFFICIENCY OF THE INNOVATION ECOSYSTEM IN THE YELLOW RIVER BASIN To further explore the systemic inter-dependencies
of the Innovation Ecosystem within the Yellow River Basin, it is important to understand that TECH and EFF are derived from the decomposition of the TFP index, indicating a certain level of
interdependence among them. The logical relationship among TFP, TECH, and EFF is depicted in Fig. 10. Given that the PVAR model allows each component to be an endogenous variable, the vector
autoregression (PVAR) model was adopted in the present research to empirically test the interaction mechanisms among TFP, TECH, and EFF. ASSESSING VARIABLE STATIONARITY AND GRANGER
CAUSALITY To validate the PVAR model’s parameter estimation, stationarity testing was conducted with the application of five different methods—LLC, IPS, HT, ADF-Fisher, and PP-Fisher. These
tests were systematically applied to TFP, TECH, and EFF across the upper, middle, and downstream reaches of the Yellow River Basin. As shown in Table 7, all variables satisfy the
stationarity requirement at the 1% significance level across all five methods. This robust confirmation of data stationarity ensures the reliability of subsequent model estimations and
statistical inferences. To improve model specification and predictive performance, this study employs Granger causality test to examine the causal relationships between TFP, TECH, and EFF.
The model framework incorporates optimal lag selection based on three established information criteria, such as the Bayesian information criterion (BIC), Akaike information criterion (AIC),
and Hannan-Quinn information criterion (HQIC) for each reaches of the Yellow River Basin. The empirical results, including lag order selection and causality analysis, are systematically
presented in Tables 8 and 9. Table 8 presents the optimal lag order determined by three information criteria across regions. The analysis identifies a first-order lag for upstream regions,
while midstream and downstream regions show second-order lags as optimal. The Granger causality test results reveal varied interactions among TFP, TECH, and EFF across different basins.
Upstream regions demonstrate no detectable Granger causality among the three variables (i.e., TFP, TECH, and EFF). In contrast, midstream region shows bidirectional Granger causality between
TECH and EFF, with unidirectional causality from TFP to TECH. Downstream regions also show comprehensive bidirectional causality among TFP, TECH, and EFF. PVAR MODEL ANALYSIS OF THE
OPERATIONAL EFFICIENCY OF THE INNOVATION ECOSYSTEM IN THE YELLOW RIVER BASIN Because the absence of significant Granger causality relationships between TFP and TECH or EFF in the upstream,
there are no significant interactions or mechanisms among TFP, TECH, and EFF in the upper region. Based on these findings the analysis focuses on the PVAR model results for the interactions
among TFP, TECH, and EFF in the middle and downstream. The results are presented in Table 10. The analysis identifies distinct temporal dynamics in regional productivity drivers. When TFP
serves as the dependent variable, significant second-period lag effects from TECH and first-period lag effects from TFP, TECH, and EFF emerge in downstream regions (_p_ < 0.10 and _p_
< 0.05, respectively). These temporal dependencies are not observed in midstream regions. When TECH is the dependent variable, the development of TECH demonstrates consistent sensitivity
to historical TFP levels. Both first and second-period lagged TFP significantly influence current TECH in midstream and downstream regions. Lagged TECH and EFF, significant at the 5% and 1%
levels, respectively, positively influence the current TECH, TFP contributing further positive impacts. When EFF is the dependent variable, lagged TECH and EFF (two periods) in the midstream
regions show weak negative correlations with current EFF, while TFP maintains a significant positive relationship. Downstream regions reveal more complex dynamics, with both first and
second-period lagged TFP, TECH, and EFF demonstrating significant positive and negative effects on EFF improvement (_p_ < 0.01). In the midstream region, TFP, TECH, and EFF demonstrate
self-enhancing mechanisms. Throughout the development of TFP, technological progress and economies of scale exhibit counteracting effects on TFP development. The advancement of TFP is driven
by opposing forces: positive contributions from TECH and negative influences from EFF. Furthermore, TECH development promotes EFF improvement, whereas EFF growth exerts a suppressive effect
on TECH, indicating that TECH plays a core strengthening role in the development of TFP. DISCUSSION This study assesses the Innovation Ecosystem dynamic operational efficiency of the
Innovation Ecosystem in the Yellow River Basin, aiming to identify strategies for boosting regional Innovation competitiveness and achieving equitable resource allocation. Using city-level
data, we analyzed the Ecosystem’s efficiency, spatiotemporal patterns, regional disparities, and underlying mechanisms. Results show a fluctuating decline in the Innovation Ecosystem dynamic
operational efficiency of the region’s Innovation Ecosystem. Compared to the Yangtze River Economic Belt, the Yellow River Basin lags in Innovation resource aggregation and allocation
efficiency, with weaker Ecosystem synergy45. Specifically, the Yangtze River Economic Belt outperforms in transforming scientific achievements and fostering Innovation-driven
entrepreneurship, supported by robust Innovation platforms and higher input-output efficiency46. Relative to the Beijing-Tianjin-Hebei region, the Yellow River Basin operates at a lower
Innovation level47, with notable gaps in R&D investment intensity48. Meanwhile, the Guangdong-Hong Kong-Macao Greater Bay Area surpasses the Yellow River Basin in Innovation
infrastructure and resource availability49, leveraging its internationalized, market-driven, and collaborative Ecosystem to achieve greater Innovation efficiency and vitality. Although the
Innovation Ecosystem dynamic operational efficiency of Innovation Ecosystem has been extensively discussed, limited research has been carried out in specific geographical regions, such as at
the municipal level in the Yellow River Basin. Moreover, the existing literature predominantly focuses on static analyses of Innovation Ecosystem dynamic operational efficiency, which
generally neglects the dynamic interactions that underpin these systems. This study addresses these gaps by introducing the DEA-Malmquist model to dynamically assess the Innovation Ecosystem
dynamic operational efficiency of the Innovation Ecosystem in the Yellow River Basin. Different from previous research, this work expands the scope of Innovation efficiency measurement from
a narrow “input-output” framework to a comprehensive “Innovation Ecosystem operation chain.” This chain spans the entire Innovation process, including innovation sources, market
environment, consumer demand. Through kernel density estimation and the Gini coefficient, this study further reveals spatial patterns and regional disparities in Innovation Ecosystem dynamic
operational efficiency. The application of the PVAR model deepens the understanding of the dynamic relationships among TFP, TECH, and EFF, as well as regional heterogeneity. By integrating
these approaches, this study not only advances the theoretical understanding of Innovation Ecosystem but also provides actionable insights and policy recommendations for enhancing Innovation
capabilities and promoting high-quality development of regional Innovation competitiveness in the Yellow River Basin. It should also be noted that there are still some certain limitations
of this research. The analysis of 59 cities in the Yellow River Basin may not fully capture the diverse characteristics of Innovation Ecosystem across China. A more extensive and
representative dataset would be required for broader and deeper investigations. Additionally, this research did not thoroughly examine other potential factors influencing Innovation
Ecosystem dynamic operational efficiency, such as social and cultural elements, shifts in policy environments, and external drivers like education, talent development, and digital
infrastructure. Future studies should explore the relationships between these variables and the Innovation Ecosystem dynamic operational efficiency of Innovation Ecosystem to provide a more
comprehensive understanding. CONCLUSION AND POLICY RECOMMENDATIONS In the present research, the Innovation Ecosystem dynamic operational efficiency of Innovation Ecosystem in 59 cities
within the Yellow River Basin from 2009 to 2023 was initially evaluated via the utilization of the DEA-Malmquist model. Subsequently, the efficiency distributions, regional disparities, and
operational mechanisms of these Ecosystems were further investigated with the application of the kernel density estimation, the Gini coefficient, as well as the PVAR model. This analysis
yielded the following research findings: (1) The Innovation Ecosystem dynamic operational efficiency of the Innovation Ecosystem in the Yellow River Basin within the study period exhibited a
fluctuating decline, primarily driven by a decrease in technological efficiency. Spatial analysis revealed distinct regional patterns: the upstream and midstream regions displayed a
left-skewed distribution with significant polarization, while the downstream region showed a right-skewed distribution with less polarization. (2) The Gini coefficients for Innovation
Ecosystem dynamic operational efficiency and technical efficiency in the Yellow River Basin’s Innovation Ecosystem shows convergence, whereas the coefficient for technological change
increases. TFP and EFF exhibit spatial convergence across upstream, middle, and downstream regions. The convergence rates of TFP, TECH, and EFF were higher between upstream-midstream and
upstream-downstream regions compared to midstream-downstream regions. Hypervariable density emerged as a key factor influencing disparities in TFP, TECH, and EFF. (3) Technical efficiency,
technological change, and dynamic efficiency interacted with significant regional heterogeneity. In the upstream region, no significant relationships were observed among TFP, TECH, and EFF.
The midstream region displays a self-reinforcing mechanism for TFP, TECH, and EFF, with mutual reinforcement between EFF and TECH. In the downstream region, TECH exhibited a strong
self-reinforcing mechanism, whereas TFP and EFF exhibit self-weakening mechanisms. On the basis of these research findings, the following policy recommendations are proposed: (1) Efforts
should be given to integrate advanced management methods and Innovation technologies to improve EFF, while simultaneously developing suitable application frameworks to maximize the potential
of new technologies. This approach will drive the advancement of TECH and foster an organic synergy, resonance, and mutual reinforcement between TECH and EFF, ultimately promoting the
growth of total factor productivity (TFP). (2) Cities such as Qingdao, Dingxi, and Jining, which are near the efficiency frontier, should serve as benchmarks to inspire regions with lower
dynamic operational efficiency. Conversely, cities like Ordos, Yantai, and Yulin, which exhibit weak technological progress efficiency, can improve by optimizing the application of
Innovation technologies and scientific management methods, fostering positive interactions between the two. Meanwhile, cities such as Hebi, Luohe, and Shizuishan, where technical efficiency
lags, can enhance their performance by scaling up industrial operations and implementing Innovation resource policies. These measures would significantly bolster the overall Innovation
Ecosystem dynamic operational efficiency in the Yellow River Basin. (3) Regions within the Yellow River Basin should capitalize on their unique advantages and engage in cooperative
initiatives with neighboring areas. Establishing a comprehensive system for technological Innovation and application can enhance information-sharing mechanisms and improve the efficient
utilization of Innovation ideas and resources. This approach optimizes resource allocation across regions, strengthens the Innovation mindset and motivation of key stakeholders, and fosters
positive interactions between Innovation entities and their environments. Such efforts will effectively drive the high-quality development of Innovation Ecosystem dynamic operational
efficiency. DATA AVAILABILITY The dataset used and/or analyzed in this study is uploaded as supplementary material or obtained from the corresponding author upon reasonable request.
REFERENCES * Simone, M. & Marco, T. Endogenous growth and technological progress with innovation driven by social interactions. _Econ. Theor._ 65, 293–328 (2018). Article MathSciNet
Google Scholar * Ma, L. Study on regional financial innovation, technological progress Bias and high quality economic development. _Applied Math. Nonlinear Sciences_ 9 (2024). * Ke, Y.
Research on the operational efficiency of regional innovation Ecosystem——Take Guangdong Province as an example. _Price:Theory Pract._ 166–170.
https://doi.org/10.19851/j.cnki.CN11-1010/F.2021.01.39 (2021). * Hong, W. Operating efficiency of the innovation ecosystem of college students’ start-ups based on three-stage DEA model %J.
_J. Comput. Methods Sci. Eng._ 23, 485–498 (2023). Google Scholar * Liao, K., Zhang, Y. & Du, Q. Research on the decomposition and formation mechanism of regional differences in the
dynamic operating efficiency of China’s regional innovation ecosystem. _Sci. Sci. Manage. S &T_. 43, 94–116 (2022). Google Scholar * Chen, Y., Huang, S. & Wang, S. The operational
efficiency of the regional innovation ecosystem in China: A study based on the perspective of innovation value chain. _Sci. Res. Manage._ 43, 11–19.
https://doi.org/10.19571/j.cnki.1000-2995.2022.07.002 (2022). Article CAS Google Scholar * Huifang, L., Xiaoyi, S., Pengwei, Y. & Xiaoqing, D. Study on the evolution of multiple
network resilience of urban agglomerations in the yellow river basin. _Sustainability_ 14, 11174–11174 (2022). Article Google Scholar * Hu, B., Guo, P. & Gao, M. Enhancing high-quality
development in regional innovation ecosystems. _Physics Chem. Earth_ 132 (2023). * Wangmin, L. Research on the efficiency of green innovation in cities in the yellow river basin. _IOP Conf.
Series: Earth Environ. Sci._ 647, 012145 (2021). Google Scholar * Gao, J., Hua, G., Huo, B. & Digital Technology Green innovation, and High-Quality economic development: mechanism
analysis and empirical evidence. _Journal Knowl. Economy_, 1–37 (2024). * Mingzhen, S., Pei, Y., Rui, Z. & Yanyan, G. Sci-tech innovation, industrial structure transformation and
economic development: an empirical study based on Province panel data of China. _J. Comput. Methods Sci. Eng._ 24, 193–200 (2024). Google Scholar * Yu, Y., Liao, J., Wang, X. & Zhu, W.
Identifying the drivers of new product development performance change in China’s high-tech industry: A two-stage production-theoretical decomposition analysis. _Expert Syst. Appl._ 261,
125513–125513 (2025). Article Google Scholar * Ouyang, Z., Wang, X. & Miao, H. A primary study on Chinese terrestrial ecosystem services and their ecological-economic values. _Acta
Ecol. Sinica_, 19–25 (1999). * F, M. J. Predators and prey: A new ecology of competition. _Harvard Business Rev._ 71, 75–86 (1993). Google Scholar * Huang, L. Stability mechanism of
regional technological innovation ecosystem. _R&D Management_, 48–52 (2003). * Huang, L. On the regulation mechanism of regional technological innovation ecosystem. _Journal Syst.
Science_, 68–71 (2004). * Wu, J. The connotation,characteristics and implications of innovation ecosystem. _Stud. Sci. Sci._ 32, 44–51. https://doi.org/10.16192/j.cnki.1003-2053.2014.01.010
(2014). Article Google Scholar * Etzkowitz, H. & Leydesdorff, L. The dynamics of innovation: from National systems and mode 2 to a triple Helix of university–industry–government
relations. _Res. Policy_. 29, 109–123 (2000). Article Google Scholar * He, Z., Cai, X. & Pan, H. Synergistic agglomeration of finance and manufacturing in Yangtze river economic belt
and its impact on innovation efficiency of manufacturing. _Resour. Environ. Yangtze Basin_. 32, 895–904 (2023). Google Scholar * Sun, J. & Huang, S. Spatial and Temporal divergence and
convergence tests of green innovation development in the yellow river basin: empirical findings from the yellow river Eco-economic belt in inner Mongolia. _Scientific Decis. Making_, 159–174
(2023). * Fan, Y., Ma, Y. & Yu, R. Innovation efficiency and measurement of High-quality development level and analysis of coupling coordination of Beijing-Tianjin-Hebei urban
agglomeration. _Stat. Decis._ 39, 128–133. https://doi.org/10.13546/j.cnki.tjyjc.2023.22.023 (2023). Article CAS Google Scholar * Liu, Z. & Dong, H. Spatial and Temporal Evolution
Mechnism and Driving Factors of Innovation Efficiency of High-tech Industry Cluster in Nine Cities in the Pearl River Delta Region. _The World of Survey and Research_, 3–15, (2023).
https://doi.org/10.13778/j.cnki.11-3705/c.2023.04.001 * Li, Y., Zhang, P. & Zeng, Y. Research on the efficiency of industrial technological innovation and its Space-time evolution in the
greater Bay area of Guangdong-Hong Kong-Macao. _J. Industrial Technol. Econ._ 39, 21–27 (2020). Google Scholar * Yuan, R., Cao, X. & Zeng, G. Spatial differentiation and driving
factors of technological innovation efficiency in the Yangtze river Delta. _World Reg. Stud._ 32, 155–166 (2023). Google Scholar * Wang, Y., Sun, Y., Wang, D. & Hu, H. Discrimination of
ambidextrous capabilities of innovation ecosystem and analysis of its evolution path:based on a Cross-case study from 1998 to 2018. _East. China Economic Manage._ 34, 29–42.
https://doi.org/10.19629/j.cnki.34-1014/f.191217005 (2020). Article Google Scholar * Ou, G., Lei, L., Ren, F. & Wang, L. Quantitative relationship between innovative input,innovative
output and innovative environment of innovation ecosystem in High-tech zone. _Sci. Technol. Manage. Res._ 36, 172–177 (2016). Google Scholar * Yan, L. Empirical study on the evaluation
index system of regional innovation efficiency in China. _J. Manage. World_. 174–175. https://doi.org/10.19744/j.cnki.11-1235/f.2012.05.016 (2012). * Su, Y. & Li, Q. Research on the
Spatial differentiation and influencing factors of technological innovation efficiency in the Yangtze river Delta region. _Stat. Decis._ 40, 106–111.
https://doi.org/10.13546/j.cnki.tjyjc.2024.09.018 (2024). Article Google Scholar * He, Y., Zhang, S. & Lin, T. Research on efficiency measurement of China’s high-tech industry
innovation ecosystem and its improvement path. _Syst. Engineering-Theory Pract._ 44, 546–562 (2024). Google Scholar * Fan, C. & Sun, G. The evaluation of green technology innovation
efficiency and its influencing factors in the yellow river basin under the carbon peaking and carbon neutrality goals. _J. Econ. Water Resour._ 42, 21–27 (2024). Google Scholar * Liu, D.,
Huang, J. & Zheng, Y. The influencing mechanism of technological innovation efficiency of listed logistics enterprises in China: based on the threshold perspective of government
subsidies and equity concentration. _Sci. Technol. Manage. Res._ 43, 117–127 (2023). CAS Google Scholar * Lu, A. & Ma, C. F. D. I. Economic development level and agricultural
technology innovation efficiency —Based on the perspective of the Two-stage threshold effect. _World Agric._ 78–90. https://doi.org/10.13856/j.cn11-1097/s.2023.05.007 (2023). * Fan, D. &
Jia, M. Research on the impact of R&D resource mismatch on the efficiency of industrial green technology innovation: based on the threshold effect of digital economy. _Sci. Res.
Manage._ 45, 95–104. https://doi.org/10.19571/j.cnki.1000-2995.2024.06.010 (2024). Article CAS Google Scholar * Wang, J. & Zhang, L. Regional differences and Spatial convergence of
green innovation efficiency in China. _Ecol. Econ._ 39, 81–86 (2023). CAS Google Scholar * Zhang, C., Liu, W., Qiu, Y. & Evaluation of Technological Innovation Efficiencies of CNC
Machine Tools Listed Enterprises and the Impact of National Science and Technology Major Projects. Based on Three-Stage DEA model and Malmquist productivity index. _Sci. Sci. Manage. S
&T_. 45, 47–61 (2024). CAS Google Scholar * Li, G., Zhang, X. & Tian, A. Spatial and Temporal differentiation of green innovation efficiency in manufacturing industry based on
Super-SBM-ESDA and Tobit model: taking the Yangtze river economic belt as an example. _Ecol. Econ._ 40, 67–79 (2024). CAS Google Scholar * Zhao, X., Li, S. & Huang, T. New measurement
and spatio-temporal heterogeneity of regional green innovation efficiency in China %J environment, development and sustainability. 1–36 (2024). * Xia, K., Guo, J., Han, Z., Dong, M. &
Xu, Y. Analysis of the scientific and technological innovation efficiency and regional differences of the land–sea coordination in China’s coastal areas %J. _Ocean Coast. Manag._ 172,
157–165 (2019). Article Google Scholar * Yongfeng, Z., Zilong, W. & Jie, Y. Applying an improved three-stage DEA model to evaluate the innovation resource allocation efficiency in
industrial enterprises. _Kybernetes_ 52, 6417–6439 (2023). Article Google Scholar * Qiguang, A., Yongkai, W., Qinggang, M., Ruoyu, W. & Qian, X. Research on the coupling coordination
characteristics and convergence of digital finance and regional sustainable development: evidence from Chinese City clusters. _Sci. Rep._ 14, 16006 (2024). Article Google Scholar * She,
Q., Qian, J. & He, L. Research on the relationship of coupling coordination between digitalization and green development. _Sci. Rep._ 14, 19569–19569 (2024). Article CAS PubMed PubMed
Central Google Scholar * Holtz-Eakin, Douglas, Newey, W. & Rosen, H. S. Estimating vector autoregressions with panel data. _Econometrica: J. Econometric Society_, 1371–1395 (1988). *
43 Wang, Z., Chen, H. & Divigalpitiya, P. How does ICT development in resource-exhausted cities promote the urban green transformation efficiency? Evidence from China. _Sustainable
Cities Soc._ 115, 105835–105835 (2024). Article Google Scholar * Kang, Y., Li, C. & Zhu, Y. High-Quality development assessment and Spatial differentiation of urban agglomeration in
the yellow river basin. _Ecol. Econ._ 39, 86–91 (2023). Google Scholar * Duan, W. et al. Comparative analysis of science and technology innovation competitiveness in the yellow river basin.
_Bull. Chin. Acad. Sci._ 39, 957–970. https://doi.org/10.16418/j.issn.1000-3045.20240524010 (2024). Article Google Scholar * Liu, D., Chen, Y., Hu, Y., Tan, T. & Xuan, Z. The
status,demand,and future thinking of science,technology and innovation development in the Yangtze river economic belt. _Sci. Technol. Progress Policy_. 42, 152–160 (2025). Google Scholar *
Li, X. & Yao, M. Research on energy level measurement and Spatiotemporal evolution of innovation ecosystem in National major strategic regions. _Acad. Forum_. 46, 90–102.
https://doi.org/10.16524/j.45-1002.2023.04.009 (2023). Article Google Scholar * Shen, L. & Zhang, H. Distribution dynamic evolution, regional differences and causes identification of
China’s financial innovation level. _Stat. Decis._ 40, 128–133. https://doi.org/10.13546/j.cnki.tjyjc.2024.19.022 (2024). Article Google Scholar * Yang, Q., Liu, X. & Sun, S.
Spatiotemporal pattern and convergence test of China’s scientific and technological innovation efficiency. _J. Quant. Technological Econ._ 38, 105–123.
https://doi.org/10.13653/j.cnki.jqte.2021.12.006 (2021). Article Google Scholar Download references ACKNOWLEDGEMENTS This research was supported by Henan Province University Humanities and
Social Sciences Research Project (Grant No.2023-ZZJH-079). AUTHOR INFORMATION AUTHORS AND AFFILIATIONS * School of Economics, Zhengzhou University of Aeronautics, Zhengzhou, 450046, Henan,
China Xiaoni Kong & Shuliang Jin * School of Geology and Mining Engineering, Xinjiang University, Urumqi, 830000, Xinjiang, China Hongchao Zhao Authors * Xiaoni Kong View author
publications You can also search for this author inPubMed Google Scholar * Shuliang Jin View author publications You can also search for this author inPubMed Google Scholar * Hongchao Zhao
View author publications You can also search for this author inPubMed Google Scholar CONTRIBUTIONS Kong Xiaoni’s contributions lie in the establishment of the theoretical foundation,
research design, and manuscript review; Jin Shuliang’s contributions are in drafting the initial manuscript, conducting data analysis, and creating figures and charts; Zhao Hongchao’s
contributions involve proofreading the manuscript and solving technical issues. CORRESPONDING AUTHOR Correspondence to Shuliang Jin. ETHICS DECLARATIONS COMPETING INTERESTS The authors
declare no competing interests. ADDITIONAL INFORMATION PUBLISHER’S NOTE Springer Nature remains neutral with regard to jurisdictional claims in published maps and institutional affiliations.
RIGHTS AND PERMISSIONS OPEN ACCESS This article is licensed under a Creative Commons Attribution-NonCommercial-NoDerivatives 4.0 International License, which permits any non-commercial use,
sharing, distribution and reproduction in any medium or format, as long as you give appropriate credit to the original author(s) and the source, provide a link to the Creative Commons
licence, and indicate if you modified the licensed material. You do not have permission under this licence to share adapted material derived from this article or parts of it. The images or
other third party material in this article are included in the article’s Creative Commons licence, unless indicated otherwise in a credit line to the material. If material is not included in
the article’s Creative Commons licence and your intended use is not permitted by statutory regulation or exceeds the permitted use, you will need to obtain permission directly from the
copyright holder. To view a copy of this licence, visit http://creativecommons.org/licenses/by-nc-nd/4.0/. Reprints and permissions ABOUT THIS ARTICLE CITE THIS ARTICLE Kong, X., Jin, S.
& Zhao, H. Spatial differences and formation mechanisms of innovation ecosystem dynamic operational efficiency along the yellow river. _Sci Rep_ 15, 18273 (2025).
https://doi.org/10.1038/s41598-025-03883-y Download citation * Received: 27 November 2024 * Accepted: 22 May 2025 * Published: 25 May 2025 * DOI: https://doi.org/10.1038/s41598-025-03883-y
SHARE THIS ARTICLE Anyone you share the following link with will be able to read this content: Get shareable link Sorry, a shareable link is not currently available for this article. Copy to
clipboard Provided by the Springer Nature SharedIt content-sharing initiative KEYWORDS * Innovation ecosystem * Dynamic operational efficiency * Spatial differences * Mechanism research *
PVAR model