Play all audios:
Bile infarct is a pivotal characteristic of obstructive biliary disease, but its evolution during the disease progression remains unclear. Our objective, therefore, is to explore
morphological alterations of the bile infarct in the disease course by means of multiscale X-ray phase-contrast CT. Bile duct ligation is performed in mice to mimic the obstructive biliary
disease. Intact liver lobes of the mice are scanned by phase-contrast CT at various resolution scales. Phase-contrast CT clearly presents three-dimensional (3D) images of the bile infarcts
down to the submicron level with good correlation with histological images. The CT data illustrates that the infarct first appears on day 1 post-BDL, while a microchannel between the infarct
and hepatic sinusoids is identified, the number of which increases with the disease progression. A 3D model of hepatic acinus is proposed, in which the infarct starts around the portal
veins (zone I) and gradually progresses towards the central veins (zone III) during the disease process. Multiscale phase-contrast CT offers the comprehensive analysis of the evolutionary
features of the bile infarct in obstructive biliary disease. During the course of the disease, the bile infarcts develop infarct-sinusoidal microchannels and gradually occupy the whole
liver, promoting the disease progression.
Bile infarct defined as fields of hepatocyte necrosis under a cholestatic state was first described in 1887 by Jean-Martin Charcot and Albert Gombault, also known as “Charcot-Gombault
necrosis”1. It is one of the characteristic histopathological features of obstructive biliary disease, including biliary atresia in infants, choledocholithiasis and malignancies such as
pancreatic head tumor and cholangiocarcinoma2,3, a group of serious diseases that can lead to biliary fibrosis or cirrhosis and even death if the obstruction is not removed or bypassed in
time4,5. The bile infarct appears at the onset of obstructive biliary disease and plays an important role in the disease progression6; therefore, monitoring the morphological alterations of
the infarct during the course of the disease, preferably in three-dimensional (3D) model, is an essential step in understanding the mechanisms of the disease evolution.
Histology is the gold standard for identifying the bile infarct and observing its microstructure at the cellular level7,8,9, but unfortunately the two-dimensional (2D) nature of the
histology does not allow for a complete representation of the 3D structure of the infarct and an accurate quantification of its morphological changes10,11. In vivo fluorescence microscopy
employing appropriate fluorescent tracers is currently a popular tool for exploring the bile infarct, and researchers have used the system to capture, in real time, the live events of
infarct formation in the liver of the bile duct ligation (BDL) model6,12. Nevertheless, the major limitation of this imaging technique is the depth of detection, which mainly provides
high-resolution images within the surface of the liver13 and cannot detect the evolution of infarcts within the whole liver. To address these limitations, an imaging tool that can not only
capture the infarct structures at a near-histological level but also has the ability to image the intact liver is needed.
Phase-contrast computed tomography (CT) is an X-ray imaging modality in which the phase shift of X-rays passing through matter is used to generate tissue contrast14. Prior work has
demonstrated that phase-contrast CT yields higher contrast in soft tissue than absorption-based X-ray imaging that employs X-ray attenuation as the image contrast15,16. Combined with
synchrotron sources, which have high coherence and super brightness, phase-contrast CT can image soft tissue at micron- or even nanometer-scale resolution17. With the aid of this technique,
the main structures, such as the microvasculature18, hepatic sinusoids19 and bile ducts20 in the liver, can be clearly distinguished on phase-contrast CT images at various scales. Thus,
multiscale synchrotron radiation phase-contrast CT has great potential to comprehensively characterize the evolution of bile infarcts in obstructive biliary disease.
In this study, the livers of a BDL model, a frequently used model of obstructive cholestasis in rodents21, at different time points were imaged using a multiscale synchrotron radiation
phase-contrast CT technique. Subsequently, the evolutionary pattern of bile infarcts and the key morphological mechanism of the infarcts promoting disease progression were revealed.
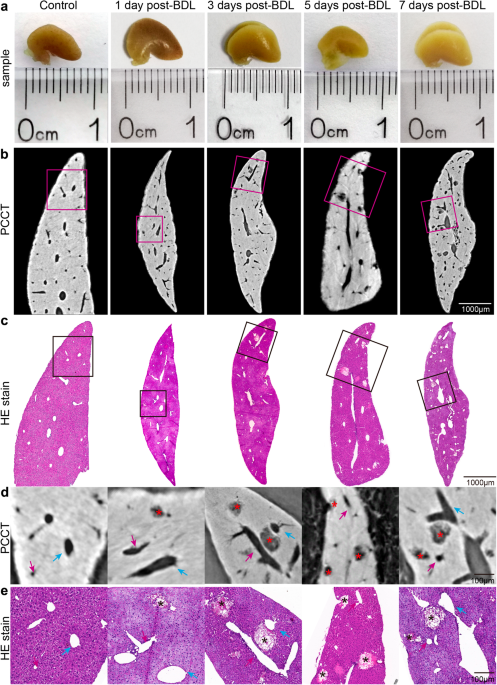
Intact liver lobes in mice from different time points after BDL were imaged by phase-contrast CT with a pixel size of 3.25 µm (Fig. 1a). The CT slices clearly revealed the bile infarcts and
vessels in the livers, and the smallest distinguishable infarct was approximately 10 µm in diameter (Fig. 1b). Additionally, pathological experiments were conducted on the imaged livers to
validate the accuracy of phase-contrast CT in the imaging of bile infarcts (Fig. 1c). The results showed that the size, shape and distribution of the infarcts in the CT data were consistent
with those in the histological findings, which was particularly clear on the enlarged images of the regions of interest (Fig. 1d, e).
a Photographs of intact liver lobes waiting for phase-contrast CT imaging (scale in millimeters). b Phase-contrast CT slices of the livers at 3.25 µm pixel size. c HE-stained histological
sections corresponding to phase-contrast CT slices in (b). d, e Enlarged images of the regions of interest in (b) and (c). Asterisks indicate bile infarcts. The blue arrows represent the
hepatic veins, and the portal veins are indicated by pink arrows.
Although CT slices could provide almost the same structural information as histology, the enormous potential of the phase-contrast CT method lay in 3D visualization and quantitative
analysis, which had been demonstrated in Fig. 2. Based on 3D reconstruction technology, the 3D structures in intact livers from different time points of BDL, such as bile infarcts, vascular
tree and bile ducts, were clearly shown in Fig. 2a. To further observe the association between the infarcts and the peripheral vascular tree, enlarged images were presented in Fig. 2b. The
scenario in the 3D view of the infarcts was similar to variable-sized “mature fruits” (bile infarcts) hanging over the “branches” (portal vein or hepatic vein tree), and an increasing number
of “mature fruits” turned out over time (days after BDL). In addition to 3D observation, quantitative analysis of the infarcts was also performed (Fig. 2c). The number of infarcts had close
to a linear increase, consistent with the 3D images. The increase in the total volume of the infarcts was stronger, almost approaching exponential growth, and that of the 7-days group was 9
times that of the 1-day group. Correspondingly, their volume in the liver lobe showed the same trend as the total volume, implying that they occupied an increasing amount of space in the
liver. For a single infarct, its volume growth was flatter from days 1 to 3 after BDL, with an obviously jump from day 5, after which the growth tended to flatten again. In contrast, the
sphericity of the infarct was progressively reduced, indicating that their shape and surface tended to be irregular and uneven.
a 3D surface reconstruction of bile infarcts (red), hepatic vein (blue), portal vein (purple), and part of the bile duct (green) in intact liver lobes (gray). b Magnifications of rectangles
in (a). c Bar graphs show the number of bile infarcts, total volume of bile infarcts and volume ratio of the bile infarcts in one liver lobe, displayed as means ± SD, and box plots show
volume of a single bile infarct and sphericity of the bile infarct, with horizontal lines representing the maximum, upper quartile, median, lower quartile, and minimum values. *=P