Play all audios:
ABSTRACT BACKGROUND: Through a retrospective analysis of existing FDG PET-MRI images, we recently demonstrated that metformin increases the accumulation of FDG in the intestinal lumen,
suggesting that metformin stimulates glucose excretion into the intestine. However, the details of this phenomenon remain unclear. We here investigate the detailed dynamics of intestinal
glucose excretion, including the rate of excretion and the metabolism of excreted glucose, in both the presence and absence of metformin. METHODS: We quantified intestinal glucose excretion
using newly developed FDG PET-MRI-based bioimaging in individuals with type 2 diabetes, both treated and untreated with metformin. The metabolism of excreted glucose was analyzed through
mass spectrometry of fecal samples from mice intravenously injected with 13C-labeled glucose. RESULTS: Continuous FDG PET/MRI image taking reveals that FDG is initially observed in the
jejunum, suggesting its involvement in FDG excretion. Metformin-treated individuals excrete a significant amount of glucose (~1.65 g h–1 per body) into the intestinal lumen. In individuals
not receiving metformin, a certain amount of glucose (~0.41 g h–1per body) is also excreted into the intestinal lumen, indicating its physiological importance. Intravenous injection of
13C-labeled glucose in mice increases the content of 13C in short-chain fatty acids (SCFAs) extracted from feces, and metformin increased the incorporation of 13C into SCFAs. CONCLUSIONS: A
previously unrecognized, substantial flux of glucose from the circulation to the intestinal lumen exists, which likely contributes to the symbiosis between gut microbiota and the host. This
flux represents a potential target of metformin’s action in humans. PLAIN LANGUAGE SUMMARY People with diabetes have high levels of a specific sugar, glucose, in the blood, which can cause
health problems. Metformin is one of the most widely prescribed drugs to treat diabetes. However, it remains unclear how metformin works. We investigated metformin’s effect on glucose
movement within the body. We found that more glucose moves inside the intestine in individuals taking metformin. The glucose is then digested by gut microbiota. These findings help us not
only understand how metformin works but also reveal a relationship between humans and the gut microbiota which could be helpful for further development of diabetes treatments. SIMILAR
CONTENT BEING VIEWED BY OTHERS GLOBAL 13C TRACING AND METABOLIC FLUX ANALYSIS OF INTACT HUMAN LIVER TISSUE EX VIVO Article Open access 29 August 2024 QUANTITATIVE WHOLE-TISSUE 3D IMAGING
REVEALS BACTERIA IN CLOSE ASSOCIATION WITH MOUSE JEJUNUM MUCOSA Article Open access 07 September 2023 COLON OR SEMICOLON: GUT SAMPLING MICRODEVICES FOR OMICS INSIGHTS Article Open access 02
October 2024 INTRODUCTION Metformin is one of the most widely prescribed antidiabetes drugs worldwide. While the anti-diabetic action of metformin is believed to occur primarily through the
inhibition of hepatic gluconeogenesis1, its underlying mechanisms remain not fully understood. Various biological effects potentially explaining metformin’s action, such as the inhibition of
mitochondrial respiratory complex I and subsequent increase in the AMP/ATP ratio leading to AMPK activation, have been identified1. However, these effects are typically observed only at
concentrations significantly higher than in vivo levels, posing a challenge to their relevance in metformin’s effects2. Conversely, when the drug is orally administered, the intestinal tract
is exposed to high concentrations of metformin, and the drug persists in the intestinal tract for an extended period3. These findings have prompted many researchers to investigate the
intestinal actions of metformin4,5,6,7,8. More than a decade ago, metformin was found to promote the accumulation of radioactivity in the intestine during[18F]fluorodeoxyglucose ([18F]FDG)
positron emission tomography(PET) –computed tomography (CT)9, an imaging modality widely adopted for cancer detection. Given that FDG is a tracer of glucose and that metformin augments
glucose utilization in intestinal cells in rodents10,11, the metformin-induced intestinal accumulation of [18F]FDG in humans was thought to reflect enhanced glucose utilization4. In PET-CT,
however, the images of the two modalities are obtained sequentially, raising the possibility that bowel peristalsis during image acquisition might result in misregistration of CT and PET
images. It has thus been difficult to determine whether the accumulation of [18F]FDG occurs in the intestinal wall or intraluminal space with the use of PET-CT. PET- magnetic resonance
imaging (MRI), in which PET and MRI images are acquired simultaneously, provides better tissue registration, especially for organs prone to movement, as well as better soft-tissue contrast
compared with conventional PET-CT12,13. By exploiting these advantages of [18F]FDG PET-MRI, we recently showed that metformin increases the amount of radioactivity in the intestinal
lumen14,15, indicating that it stimulates the transfer of glucose from the circulation to the intestinal lumen. Whereas this finding implied the existence of a previously unrecognized
glucose flux in humans, it was based on a retrospective analysis of existing images with a semiquantitative measure14,15. Moreover, whereas FDG is commonly used to evaluate glucose flux in
the body16,17,18, the dynamics of glucose and FDG are not entirely identical. To provide further insight into the metformin-induced transfer of glucose from the circulation to the intestine,
we developed a new bioimaging system based on PET-MRI that allows quantitation of glucose flux to the intestinal lumen. We also analyzed metformin-induced changes in the dynamics of glucose
and its derivatives in the intestine with the use of stable isotope (13C)–labeled glucose and mass spectrometry in mice. Our findings reveal that a substantial amount of glucose is
transferred from the circulation to the intestinal lumen, a process enhanced by metformin. Furthermore, the glucose excreted into the intestine is metabolized by gut microbiota, producing
short-chain fatty acids that likely contribute to the symbiosis between gut microbiota and the host. METHODS HUMAN [18F]FDG PET-MRI STUDIES These clinical studies were conducted in
accordance with the Declaration of Helsinki and its amendments. They received approval from the Ethics Committee of Kobe University Hospital (approval nos. A210001, A210010, and C200017) and
were registered with the University Hospital Medical Information Network Clinical Trials Registry (UMIN No. 000043446 and 000045137), and with the Japan Registry of Clinical Trials
(jRCTs051200115), respectively. The inclusion and exclusion criteria for study subjects are shown in Table S1. Blood parameters were evaluated only on the day of the PET-MRI. To evaluate the
site of metformin-induced intestinal FDG excretion, we performed a continuous image acquisition of PET-MRI as an exploratory, single-group study (UMIN No. 000043446). The PET-MRI (Signa
PET/MR, GE Healthcare) was conducted after intravenous administration of [18F]FDG (3.5 MBq/kg) in subjects with T2DM who had been taking metformin at a dose of 1000 mg or more per day for at
least one month and had fasted for at least 6 h. PET and MRI images were acquired continuously for 90 min and every 10 min starting 1 min after [18F]FDG injection, respectively. The
[18F]FDG accumulation in each part of the intestine was evaluated based on SUVpeak, as previously described15. A total of 5 patients were recruited from April 2021 to March 2023. The study
was completed as planned with no deviations or adverse events. To quantitatively evaluate the excretion of FDG into the intestinal lumen, PET-MRI image acquisition was performed in
exploratory, two single-group studies (jRCTs051200115 and UMIN No. 000045137). The PET-MRI was conducted after intravenous administration of [18F]FDG (3.5 MBq/kg) in T2D subjects treated
with metformin at 1000 mg or more per day (jRCTs051200115) or without any dose of metformin (UMIN No. 000045137) for at least one month. For quantitative analysis of [18F]FDG accumulation in
the intestinal wall and lumen, subjects received an intramuscular injection of butylscopolamine (10 mg) 60 min after [18F]FDG administration to reduce peristalsis, and 3D images of the
entire intestine were then acquired using the imaging sequence for MR enterography (MRE)19. [18F]FDG PET images were superimposed on the MRE images to obtain information on the 3D
distribution of radioactivity in the intestine. We also utilized soft-tissues contrast obtained by MRI for discrimination of the wall and lumen using an Advantage Workstation 4.7 (GE
Healthcare), as previously described15. In short, we first segmented the intestinal tracts from the whole MRI image data. The intra-abdominal fat is removed by setting a threshold using the
Fat image of the 2-point Dixon method in MRE. Other structures besides the intestinal tracts are semi-automatically removed using imaging software equipped to the device (Advantage
workstation 3.2, GE HealthCare). Among the remaining bowel structures, regions with high signal intensity on the T2-weighted images of MRE are segmented using a threshold, delineating the
areas of bowel fluid, i.e., the bowel lumen. Among the remaining bowel structures, areas with high signal intensity on the T1-weighted images of the 2-point Dixon method, i.e., highly
concentrated residue (corresponding largely to stool or concentrated intestinal fluid), are removed. The remaining portions are segmented as the bowel wall. A total of 10 subjects with (_n_
= 5) or without (_n_ = 5) metformin treatment were recruited from January 2021 to February 2023 and from October 2021 to March 2023, respectively, and completed the study as planned with no
deviations or adverse events. Some parts of the study were interventional. MICE STUDIES Mice were handled according to the guidelines of, and the study was approved by, the Animal
Experimentation Committee of Kobe University Graduate School of Medicine (approval nos. P180503 and P210104) and the Animal Care and Use Committee of RIKEN Kobe Institute (approval no.
A2021-06). Although it is not well established whether sex differences exist, our previous study found no sex differences in retrospective human analyses. Therefore, mouse experiments were
conducted using males only for simplicity. INTESTINAL [18F]FDG ACCUMULATION IN MICE Male C57BL/6J mice at 5 weeks of age were treated with metformin by adding the drug to drinking water at a
concentration of 3 mg/ml. This resulted in a metformin exposure of approximately 700 mg/day per mouse. Metformin-treated mice at 4 weeks after the onset of drug administration or control
mice were deprived of food for 16 h and then injected in the conscious state with [18F]FDG at a dose of 10 MBq (in 0.1 ml of physiological saline) through a cannula placed in the tail vein.
One hour after the injection, the mice were anesthetized with 3% isoflurane and a blood sample was collected from the right atrium. The intestinal tract was then resected from the pylorus to
the anus and divided into four parts (upper small intestine, lower small intestine, cecum, and colon). The contents of the intestinal tract were collected by washing with 7.5 ml of
physiological saline each for the upper and lower small intestine or with 3 ml each for the cecum and colon. Each intestinal segment, the luminal contents, and the blood sample were weighed
and were measured for radioactivity with a gamma well counter (Wizard 2480, PerkinElmer). Tissue radioactivity was determined as MBq/tissue, with becquerels being determined with the use of
a cross-calibration factor calculated with a dose calibrator and the gamma well counter. For [18F]FDG metabolite analysis by TLC20, intestinal tissue segments and luminal contents were
prepared from mice as described above with the exception that [18F]FDG was administered at a dose of 30 MBq. About 100 mg of the dissected intestinal tissue or luminal contents were
homogenized in an ice-cold solution of 2 M perchloric acid and 4 mM EDTA. The homogenates were centrifuged at 430 × _g_ for 5 min at 4°C, and the resulting supernatants were neutralized with
a solution containing 2 M KOH with 0.3 M MOPS and then centrifuged again, with the new supernatants being subjected to TLC. The samples (2 µl) were spotted at the origin point of a
normal-phase plate (Silica60 HPTLC, Merck), which was then developed with an eluent solvent containing 1-butanol/acetic acid/H2O (2:1:1, v/v/v). The chromatogram was imaged with an image
analyzer (FLA 7000, GE Healthcare Life Sciences), and [18F]FDG and its metabolites were identified on the basis of their retardation factor (_R_f) values (0.7 for [18F]FDG, 0.4 for
[18F]FDG-6-P, 0.2 for [18F]FD-PGL, and 0.1 for [18F]FDG-1,6-P2). The corresponding signal intensities of FDG and its metabolites in each tissue were quantified using image processing
software (MultiGage, Fujifilm, Japan). They were divided by the sum of the signal intensities to calculate the composition ratio. MATHEMATICAL ANALYSIS OF INTESTINAL GLUCOSE EXCRETION RATE
(GER) We generated a compartment model consisting of blood and intestinal lumen compartments (Fig. S1) on the basis of the following assumptions: (1) [18F]FDG and glucose move
unidirectionally from blood to the intestinal lumen and are neither reabsorbed, degraded, nor excreted outside the intestinal tract after the movement into the intestinal lumen, (2) the
fractional rate constant (_k___1_) and (_k___2_) that define the excretion rate is the same for [18F]FDG and glucose, and (3) blood glucose levels remain unchanged from the fasting state
during the test time. If the radioactivity and concentration of [18F]FDG and glucose in the blood at a certain time point _t_ were defined as _R___b_ (_t_) and _C___b_ (_t_), respectively,
the derivative of intraluminal radioactivity [_R___i_ _(t)_] of [18F]FDG and concentration of glucose [_C___i_ (_t_)]were obtained by the following equation:
$${{d}}({R}_{{{\_}}i}(t))/{{{d}}t}=k{{\_}}1{{\cdot }}{R}_{{{\_}}b}(t)$$ (1) $$d({C}_{{{\_}}i}(t))/{dt}={k}_{{{\_}}2}{{\cdot }}{C}_{{{\_}}b}(t)$$ (2) Time integration of both sides of Eq. (1)
yields the following equation: $${R}_{{{\_}}i}(t)={R}_{{{\_}}i}(0)+{k}_{{{\_}}1}{{\cdot }}{0}{\int_{0}^{t}}{R}_{{{\_}}b}(s){ds}={k}_{{{\_}}1}{{\cdot }}{\int_{0}^{t}}{R}_{{{\_}}b}(s){ds}$$
(3) _R___i_ (_t_), which indicates total absolute radioactivity transferred into the intestinal lumen at time _t_, was evaluated by [18F]FDG PET-MRE in humans or by measuring radioactivity
with a gamma counter in mice.\(\,{\int }_{0}^{t}{R}_{{\_b}}\left(t\right){dt}\) was determined by a curve-fitting method based on the radioactivity either associated with the aorta as
assessed by [18F]FDG PET-MRE at 60 and 120 min after [18F]FDG injection in humans or in blood samples collected at 30, 60, and 90 min after [18F]FDG injection in mice. Calculation of _k___1_
is then performed with the following equation: $${k}_{{{\_}}1}={R}_{i}(t)/\int _{0}^{t}{R}_{{{\_}}b}(s){ds}$$ (4) As _k___2_ was assumed to be proportional to _k___1_, GER was calculated as
$${GER} = \, {k}_{{{\_}}2}\times {{{\rm{fasting}}}}\; {{{\rm{blood}}}}\; {{{\rm{glucose}}}}\; {{{\rm{concentration}}}}\times {{{\rm{estimated}}}}\; {{{\rm{total}}}}\; {{{\rm{blood}}}}\;
{{{\rm{volume}}}}\\ ={k}_{{{\_}}1}\times {{{\rm{m}}}}\times {{{\rm{fasting}}}}\; {{{\rm{blood}}}}\; {{{\rm{glucose}}}}\; {{{\rm{concentration}}}}\times {{{\rm{estimated}}}}\;
{{{\rm{total}}}}\; {{{\rm{blood}}}}\; {{{\rm{volume}}}}$$ (5) The reaction constants for glucose and FDG with various proteins, such as enzymes or glucose transporters, are not entirely
identical. Lumped constants have been reported in various species and organs21,22,23,24,25,26,27 (Table S2) whereas the lumped constant in intestinal cells has not been reported. We thus
assumed a lumped constant of 1 (i.e., assuming _k___1_ and _k___2_ are identical) in the current analysis. We used the data of the intraluminal radioactivity at 60 minutes after [18F]FDG
administration. The circulating blood volume (liters) of human (man) was calculated as 0.168H3 + 0.050 W + 0.444, where H is height (meters) and W is weight (kilograms), and that of mice
(milliliters) as 0.072 W, where W is weight (grams)28,29. [13C]GLUCOSE ADMINISTRATION IN MICE Male C57BL/6 J mice at 6 weeks of age were treated (or not) with metformin for 4 weeks as
described above. As indicated, a cocktail of antibiotics (ampicillin at 5 mg/ml, gentamycin at 5 mg/ml, neomycin at 5 mg/ml, metronidazole at 5 mg/ml, and vancomycin at 2.5 mg/ml, all
obtained from Fujifilm Wako) was administered in 200 µl of water by oral gavage daily for the final 7 days of metformin treatment. At 10 weeks of age, the blood glucose level and body mass
of the mice were measured before they were deprived of food for 16 h and then injected with [12C6]glucose (Sigma-Aldrich) or [13C6]glucose (>99% 13C, Cambridge Isotope Laboratories) at a
dose of 0.35 g/kg via the tail vein. The mice were killed and all feces in the colon and rectum were collected at 1 h after glucose injection. SCFA MEASUREMENT SCFAs were extracted from
feces as described previously30, with some modifications. Feces (50 mg) were mixed with 500 μl of 0.5% phosphoric acid, agitated for 20 min with a vortex mixer, subjected to ultrasonic
treatment for 5 min with a Bioruptor II instrument (Sonicbio), and centrifuged at 17,500 × _g_ for 10 min 4 °C. The resulting supernatant was transferred to a new tube, 500 μl of diethyl
ether containing of 4-methylvaleric acid (internal standard) at 10 μg/ml were added, and the mixture was agitated for 5 min and then centrifuged again. The ether layer was transferred to a
vial, with pure water serving as a blank sample to correct for background interference. GC-MS analysis was performed with a 7000 C gas chromatograph equipped with a 7890B inert mass
spectrometer detector and a DB-FFAP capillary column (inner diameter, 0.25 mm; length, 30 m; film thickness, 0.25 μm) (Agilent Technologies), and with hydrogen as the carrier gas. A portion
(1 µl) of the ether layer was injected with a 10-μl syringe and a 7693 A autosampler (Agilent Technologies). The injection was performed in splitless mode, with the injection port
temperature held at 250 °C. The initial oven temperature was maintained at 40 °C for 2 min, increased first at a rate of 5 °C/min to 150 °C and then at 10 °C/min to 240 °C, and then held for
an additional 15 min. The mass spectrometer transfer line, ion source, and quadrupole temperatures were set at 240°, 280°, and 150 °C, respectively. Ionization was performed in the electron
impact mode at 70 eV. Data were acquired at 45.5 min with a 4.5-min solvent delay and with the selected ion monitoring (SIM) mode. The selected ions monitored are listed in Table S3. The
dwell time for an all SIM channel was set at 20 ms. Calibration curves were generated from triplicate analysis of standard solutions at 0.1, 1, and 10 μg/ml, with the ratio of the
chromatographic peak area of each analyte to that of the internal standard being determined. The ratio of 13C to total carbon for each SCFA [13C/total C (%)] was calculated from the mass
spectral isotopic distributions obtained from GC-MS analysis, as described previously31. STATISTICS AND REPRODUCIBILITY Measurements were taken from distinct samples. Quantitative data are
presented as means ± s.e.m. and were compared between or among groups with the two-tailed unpaired Student’s _t_ test or by two-way analysis of variance (ANOVA) with Bonferroni’s post hoc
test, respectively. A _P_ value of <0.05 was considered statistically significant. REPORTING SUMMARY Further information on research design is available in the Nature Portfolio Reporting
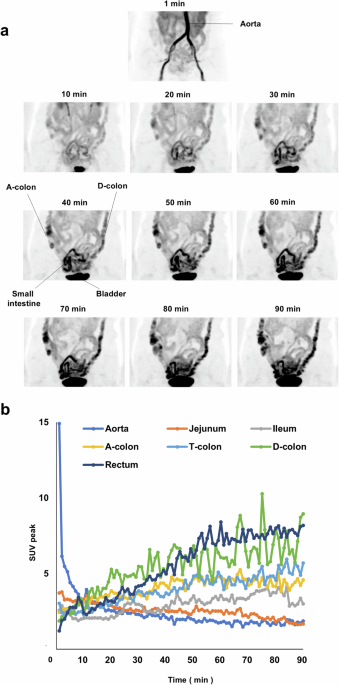
Summary linked to this article. RESULTS FDG IS EXCRETED FROM THE SMALL INTESTINE AND MOVES ALONG THE INTESTINAL TRACT Metformin-induced intestinal accumulation of [18F]FDG during PET-CT is
apparent mainly in the colon9,32. We first investigated the temporal changes in the amount of radioactivity in the intestine after [18F]FDG injection in human subjects. PET-MRI images were
continuously acquired for 90 min after the intravenous administration of [18F]FDG in five individuals with type 2 diabetes (T2D) treated with metformin. The characteristics of these study
subjects and movies of continuous PET-MRI images are shown in Table S4 and Supplementary Movie 1, respectively. Still images of a representative individual at various times after [18F]FDG
injection are also shown in Fig. 1a. Radioactivity was apparent in the small intestine within 10 min after [18F]FDG injection and subsequently increased in amount in the ascending and then
descending colon (Fig. 1a). Close-up examination of the movies revealed that the radioactivity moved along the intestinal tract toward the anus by peristalsis (Supplementary Movie 1).
Temporal changes in the amount of radioactivity in the aorta and portions of the intestine for a representative individual are shown in Fig. 1b. The amount of radioactivity in the jejunum
was initially higher than that in other regions of the intestine at the start of the observation period and then decreased gradually (Fig. 1b). On the other hand, the amount of radioactivity
in other parts of the intestine—including the ileum; the ascending, transverse, and descending colon; and the rectum—increased over time. The temporal changes in radioactivity for the other
study participants showed an essentially similar pattern, with the exception that the amount of radioactivity in the jejunum at the start of the observation period was not the highest among
the intestinal regions in case 2 (Fig. S2). These results thus indicated that intravenously injected [18F]FDG is transferred to the intestinal lumen primarily via the jejunum and then moves
toward the anal end of the intestinal tract. QUANTITATIVE ANALYSIS OF FDG EXCRETION IN THE HUMAN INTESTINE We next attempted to quantify the intraluminal excretion of FDG by developing a
bioimaging system based on PET-MRI. We adopted imaging sequences of magnetic resonance enterography (MRE)19 to generate three-dimensional (3D) images of the entire intestinal tract
(Supplementary Movie 2). We then superimposed the [18F]FDG PET images onto the 3D MRE images to obtain information on the 3D distribution of radioactivity. We termed this imaging sequence
PET-MRE. We performed PET-MRE for individuals with T2D treated or not treated with metformin and evaluated the absolute amount of radioactivity in each part of the intestine with
discrimination between the wall and lumen. The characteristics of these study subjects and corresponding maximum intensity projection (MIP) PET images are shown in Table S5 and in Fig. 2,
respectively. This quantitative analysis revealed that radioactivity was present in the wall and lumen of the intestine in similar amounts in subjects not taking metformin (2.21 ± 0.39 and
1.91 ± 0.39 MBq for the wall and lumen of the entire intestine, respectively) (Fig. 3a and Table S6) In subjects treated with metformin, however, the amount of radioactivity in the lumen was
three to four times as great as that in those not taking the drug, whereas the amount of radioactivity in the wall was similar between the two groups (Fig. 3a and Table S6). The ratio of
FDG excreted in the lumen was 1.18 ± 0.25 and 4.21 ± 0.21 % of the total injected dose, respectively. QUANTITATIVE ANALYSIS OF FDG EXCRETION IN THE MOUSE INTESTINE We next investigated
intestinal FDG dynamics by directly measuring the radioactivity associated with the isolated intestine of mice. C57BL/6 J mice, treated or not with metformin, were injected with [18F]FDG via
the tail vein, the entire intestine was isolated 1 h after the injection, and the radioactivity associated with the wall and contents of different regions of the intestine was measured with
a gamma counter. Blood glucose levels (103.2 ± 10.3 and 99.2 ± 8.6 mg/dl, respectively; means ± s.e.m., _P_ = 0.75 by the two-tailed unpaired Student’s _t_ test) and body weight (22.6 ± 0.2
and 23.3 ± 0.5 g, respectively, _P_ = 0.14) did not differ significantly between the control and metformin-treated mice. Similar to humans, radioactivity was detected in both the wall and
lumen (contents) of the mouse intestine and, with the exception of the upper small intestine, the amount in the lumen was increased three- to fourfold by metformin treatment (Fig. 3b and
Table S6). However, unlike humans, the amount of radioactivity in the wall was also increased by metformin treatment in all parts of the intestine examined. The distribution of radioactivity
in the wall and lumen of the intestine differed substantially between humans and mice under both control and metformin-treated conditions (Fig. 3c). We also examined the relative abundance
of intact and metabolized forms of [18F]FDG in the wall and lumen of the mouse intestine by thin-layer chromatography (TLC) and autoradiography (Fig. S3, Table S7). In the wall of the small
intestine of control mice, both intact and metabolized forms of [18F]FDG were present, with the metabolized forms being predominant. On the other hand, most [18F]FDG (>90%) in the lumen
of the small intestine, where the glucose derivative is excreted in humans (Fig. 1), was present in the intact form (Fig. S3, Table S7), which may reflect the fact that facilitative glucose
transporters transfer only the intact form of FDG33. In the cecum and large intestine, however, most [18F]FDG in both the wall and lumen was present in metabolized forms. We obtained similar
findings with metformin-treated mice. These results suggested that FDG is excreted into the small intestine in the intact form and is then metabolized, possibly by the gut microbiota, as it
moves to the lower intestine. Previous studies found that metformin-induced accumulation of radiolabeled glucose in the intestine was evident only in the wall, not in the contents, for mice
that were anesthetized before tracer administration34,35. Our preliminary experiments showed that anesthesia of mice before [18F]FDG injection reduced the amount of radioactivity detected
in intestinal contents. Given that anesthesia affects hexokinase activity in some organs36,37, it is possible that such treatment attenuates intestinal glucose excretion by altering
intracellular glucose metabolism. ESTIMATION OF THE RATE OF GLUCOSE EXCRETION BY MATHEMATICAL ANALYSIS We next evaluated the rate of glucose excretion into the human intestine with
mathematical analysis. We set a compartment model consisting of a blood vessel and an intestinal lumen compartment (Fig. S1). We calculated the rate constant (_k_) of FDG movement on the
basis of the radioactivity detected in the intestinal lumen and blood, and we then determined GER as the product of _k_, the fasting blood glucose concentration, and the estimated total
blood volume for each of the studied individuals (Table 1). GER and GER standardized by body mass for the control group were 6.76 ± 1.30 mg min–1 (0.41 ± 0.08 g h–1) and 1.00 × 10⁻¹ ± 0.19 ×
10–1 mg min–1 kg–1, respectively, and those for the metformin group were 27.51 ± 2.23 mg min–1 (1.65 ± 0.13 g h–1) and 3.83 × 10⁻¹ ± 0.38 × 10⁻¹ mg min–1 kg–1, respectively. We also
estimated GER in mice with the same compartment model. GER and GER standardized by body mass for the control mice were 1.99 × 10⁻³ ± 0.18 × 10⁻³ mg min–1 and 0.88 × 10⁻¹ ± 0.08 × 10⁻¹ mg
min–1 kg–1, respectively, and those for the metformin-treated mice were 7.41 × 10⁻³ ± 0.82 × 10⁻³ mg min–1 and 3.20 × 10⁻¹ ± 0.38 × 10⁻¹ mg min–1 kg–1, respectively (Table 2). These results
thus showed that the transfer of FDG from blood vessels to the intestinal lumen occurs at similar rates in humans and mice (1.00 × 10⁻¹ ± 0.19 × 10⁻¹ versus 0.88 × 10⁻¹ ± 0.08 × 10⁻¹ mg
min–1 kg–1, respectively), and that metformin increases the rates by similar extents in both species (3.82- and 3.63-fold increases, respectively). They also suggested that the glucose flux
from the circulation into the intestinal lumen may be a common physiological feature among mammalian species, whereas the rates of glucose metabolism in intestinal cells appear to differ
substantially between humans and mice (Fig. 3c). ANALYSIS OF THE DYNAMICS OF GLUCOSE AND ITS DERIVATIVES IN THE INTESTINE Whereas our experiments with [18F]FDG suggested that glucose is
excreted into the intestinal lumen and metabolized by the gut microbiota in the large intestine, the dynamics of FDG are not entirely the same as those of glucose. We therefore attempted to
confirm intestinal glucose excretion and subsequent metabolism with the use of glucose labeled with the stable isotope 13C. C57BL/6J mice, treated or not with metformin, were thus injected
via the tail vein either with glucose in which all six carbon atoms are 13C ([13C6]glucose) or with normal glucose ([12C6]glucose) as a control (Fig. 4a). One hour after the injection, feces
obtained from the isolated colon were subjected to gas chromatography–mass spectrometry (GC-MS) analysis. The various groups of mice showed no substantial differences in blood glucose
levels or body mass (Table S8). We did not detect non-metabolized [13C6]glucose in feces, consistent with the finding that [18F]FDG is present mostly as metabolized forms in the lumen of the
large intestine (Fig. S3). We next examined short-chain fatty acids (SCFAs) as representative carbohydrate metabolites produced by gut microbiota38. The absolute abundance of
SCFAs—including acetic acid, propionic acid, and butyric acid—in feces showed no significant differences among control mice injected with [12C6]glucose or [13C6]glucose and metformin-treated
mice injected with [13C6]glucose (Fig. 4b). However, the amount of each SCFA was greatly diminished by prior treatment of the mice with antibiotics (Fig. 4b), confirming that the measured
SCFAs were produced by the gut microbiota. We next examined each SCFA for its content of 13C (Fig. 4c). In control mice injected with [12C6]glucose, the proportion of 13C among total carbon
in SCFAs was ~1.5% to 3%, consistent with the ratio calculated based on the abundance of 13C in nature39. Injection of [13C6]glucose increased the 13C content of all SCFAs, and metformin
treatment significantly increased the incorporation of 13C into propionic acid and tended to increase that into acetic and butyric acids. These results indicated that glucose in the
circulation is transferred to the intestinal lumen and is then metabolized, at least in part, to SCFAs. DISCUSSION Previous studies with rodents have suggested that glucose in the
circulation is transferred to the intestinal lumen34,40,41,42, but this phenomenon has remained largely uncharacterized, particularly in humans. The magnitude of the glucose flux we
identified in metformin-treated individuals (1.65 ± 0.13 g h–1) is approximately 20% of hepatic glucose output in the fasting state and comparable to urinary glucose excretion in individuals
treated with sodium-glucose cotransporter (SGLT) 2 inhibitors43. The simultaneous acquisition of PET and MRI images by [18F]FDG PET-MRI allows accurate registration of the two images and
detailed evaluation of glucose flux into the intestinal lumen, which led to the identification of the previously unrecognized substantial glucose flux. Individuals who do not receive
metformin treatment excrete approximately one-fourth of the amount of glucose excreted by those who receive metformin treatment. This finding is also unexpected and it suggests that the
glucose flux has physiological significance independent of metformin’s action. One consequence of this flux appears to be the provision of carbohydrate to the gut microbiota. SCFAs are
generated by the gut microbiota as a result of the metabolism of indigestible dietary fiber (Fig. 4d). However, our current findings suggest that, even in the absence of such fiber, glucose
excreted into the intestine serves as a source for SCFA production. The abundance of SCFAs in feces or blood has been found to be increased by metformin treatment5,44. The intestinal glucose
flux characterized here may contribute to this effect of metformin. The mechanism by which glucose is excreted from intestinal cells is unknown. Continuous PET/MRI imaging revealed that FDG
is initially observed in the jejunum, suggesting its involvement in FDG excretion. While FDG appeared in the colon within 30 minutes after its administration in some study participants,
this timeframe is sufficient for FDG to transit from the jejunum to the colon, considering the reported small intestinal transit time45,46. The presence of [18F]FDG in the intact form in the
lumen of the mouse small intestine suggests that glucose excretion is mediated by a protein that selectively interacts with intact FDG such as glucose transporters. Expression of the
glucose transporter GLUT2 at the luminal surface of the jejunum was previously found to be increased by metformin treatment in rodents40,47. Given that GLUT2 is a bidirectional transporter,
this phenomenon may account for the stimulatory effect of metformin on glucose excretion into the intestinal lumen. Another recent study, however, showed that metformin promoted the
accumulation of GLUT2 at the basal surface of the small intestine48. We cannot completely exclude the possibility that the intestinal tract other than the jejunum excrete glucose via
transporters other than GLUT2. A previous study suggests that GLUT1 is involved in intestinal glucose excretion in a certain conduction42. The reaction constants of glucose and FDG for their
interacting proteins, such as hexokinase and glucose transporters, are not identical49, and the ratio of the constants for glucose and FDG is termed the lumped constant. The reported lumped
constant has varied from 0.44 to 1.35 in different organs and species21,22,23,24,25,26,27 (Table S2). Given that lumped constant in the intestine in mice and humans are not reported, we
calculated GER under the assumption that lumped constant is 1; that is, the velocity of transfer of glucose and FDG from blood to the intestinal lumen is identical. If the lumped constant is
smaller or greater than 1, the GER determined in the present study may be somewhat under- or over-estimated, respectively (Figure S4). SGLT1, which is expressed at the luminal surface of
the small intestine, mediates the uptake of glucose but not that of FDG50. Glucose excreted into the intestinal lumen may therefore be reabsorbed to some extent by SGLT1. However, metformin
was shown to downregulate the abundance of SGLT1 in the intestine47,51, suggesting that the reabsorption of glucose by SGLT1 would be suppressed by metformin treatment. Previous studies have
shown that glucose absorption from the intestine is inhibited by buformin52, a biguanide closely related to metformin, in canines and by metformin in humans53. These findings may also be
associated with the downregulation of SGLT1. The current study has several limitations. First, in our animal studies, we used only male mice, and it remains unknown whether sex differences
exist in the findings identified. Second, it has been reported that dietary content affects the expression of GLUT2 in the intestine40,54. Therefore, dietary content and the time elapsed
since eating may influence intestinal glucose excretion. However, in this study, we only imposed a fasting condition of more than six hours and did not assess dietary intake prior to
testing. Finally, we were unable to provide in-depth mechanistic insights into intestinal glucose excretion or its relationship to glucose homeostasis, both of which are crucial for
understanding its physiological significance and assessing its potential as a novel drug target. In conclusion, we have here uncovered a previously unrecognized and substantial glucose flux
from the circulation to the intestine and have provided evidence that this flux may contribute to the symbiotic relation between the host and gut microbiota in mice and humans. Whereas new
mechanisms for the pharmacological actions of metformin are regularly proposed, the excretion of glucose into the intestine is of special interest in that it’s discovery was triggered by
clinical observations9 and it has been characterized largely in humans32. Further studies are warranted to understand the physiological relevance of glucose excretion into the intestine and
its contribution to the glucose-lowering effect of metformin. DATA AVAILABILITY The source data for all figures and tables can be found in Supplementary Data. The authors declare that any
other data supporting the findings of this study are available from the corresponding author upon reasonable request. REFERENCES * Foretz, M., Guigas, B. & Viollet, B. Metformin: update
on mechanisms of action and repurposing potential. _Nat. Rev. Endocrinol._ 19, 460–476 (2023). Article CAS PubMed Google Scholar * He, L. & Wondisford, F. E. Metformin action:
concentrations matter. _Cell Metab._ 21, 159–162 (2015). Article CAS PubMed Google Scholar * Wilcock, C. & Bailey, C. J. Accumulation of metformin by tissues of the normal and
diabetic mouse. _Xenobiotica_ 24, 49–57 (1994). Article CAS PubMed Google Scholar * McCreight, L. J., Bailey, C. J. & Pearson, E. R. Metformin and the gastrointestinal tract.
_Diabetologia_ 59, 426–435 (2016). Article CAS PubMed PubMed Central Google Scholar * Wu, H. et al. Metformin alters the gut microbiome of individuals with treatment-naive type 2
diabetes, contributing to the therapeutic effects of the drug. _Nat. Med._ 23, 850–858 (2017). Article CAS PubMed Google Scholar * Sun, L. et al. Gut microbiota and intestinal FXR
mediate the clinical benefits of metformin. _Nat. Med._ 24, 1919–1929 (2018). Article CAS PubMed PubMed Central Google Scholar * Coll, A. P. et al. GDF15 mediates the effects of
metformin on body weight and energy balance. _Nature_ 578, 444–448 (2020). Article CAS PubMed Google Scholar * Buse, J. B. et al. The primary glucose-lowering effect of metformin resides
in the gut, not the circulation: results from short-term pharmacokinetic and 12-week dose-ranging studies. _Diabetes Care_ 39, 198–205 (2016). Article CAS PubMed Google Scholar *
Gontier, E. et al. High and typical 18F-FDG bowel uptake in patients treated with metformin. _Eur. J. Nucl. Med. Mol. Imaging_ 35, 95–99 (2008). Article CAS PubMed Google Scholar *
Bailey, C. J., Mynett, K. J. & Page, T. Importance of the intestine as a site of metformin-stimulated glucose utilization. _Br. J. Pharmacol._ 112, 671–675 (1994). Article CAS PubMed
PubMed Central Google Scholar * Penicaud, L., Hitier, Y., Ferre, P. & Girard, J. Hypoglycaemic effect of metformin in genetically obese (fa/fa) rats results from an increased
utilization of blood glucose by intestine. _Biochem. J._ 262, 881–885 (1989). Article CAS PubMed PubMed Central Google Scholar * Pellino, G. et al. PET/MR versus PET/CT imaging: impact
on the clinical management of small-bowel Crohn’s disease. _J. Crohns Colitis_ 10, 277–285 (2016). Article PubMed Google Scholar * Slomka, P. J., Pan, T. & Germano, G. Imaging moving
heart structures with PET. _J. Nucl. Cardiol._ 23, 486–490 (2016). Article PubMed Google Scholar * Ito, J. et al. Dose-dependent accumulation of glucose in the intestinal wall and lumen
induced by metformin as revealed by (18) F-labelled fluorodeoxyglucose positron emission tomography-MRI. _Diabetes Obes. Metab._ 23, 692–699 (2021). Article CAS PubMed Google Scholar *
Morita, Y. et al. Enhanced release of glucose into the intraluminal space of the intestine associated with metformin treatment as revealed by [(18)F]Fluorodeoxyglucose PET-MRI. _Diabetes
Care_ 43, 1796–1802 (2020). Article CAS PubMed Google Scholar * Cypess, A. M. et al. Identification and importance of brown adipose tissue in adult humans. _N. Engl. J. Med._ 360,
1509–1517 (2009). Article CAS PubMed PubMed Central Google Scholar * Gheysens, O. et al. Quantification, variability, and reproducibility of basal skeletal muscle glucose uptake in
healthy humans using 18F-FDG PET/CT. _J. Nucl. Med._ 56, 1520–1526 (2015). Article CAS PubMed Google Scholar * Yokoyama, I. et al. Troglitazone improves whole-body insulin resistance and
skeletal muscle glucose use in type II diabetic patients. _J. Nucl. Med._ 42, 1005–1010 (2001). CAS PubMed Google Scholar * Anupindi, S. A., Terreblanche, O. & Courtier, J. Magnetic
resonance enterography: inflammatory bowel disease and beyond. _Magn. Reson. Imaging Clin. N. Am._ 21, 731–750 (2013). Article PubMed Google Scholar * Rokka, J., Gronroos, T. J.,
Viljanen, T., Solin, O. & Haaparanta-Solin, M. HPLC and TLC methods for analysis of [(18)F]FDG and its metabolites from biological samples. _J. Chromatogr. B: Analyt. Technol. Biomed.
Life Sci._ 1048, 140–149 (2017). Article CAS PubMed Google Scholar * Reivich, M. et al. Glucose metabolic rate kinetic model parameter determination in humans: the lumped constants and
rate constants for [18F]fluorodeoxyglucose and [11C]deoxyglucose. _J. Cereb. Blood Flow Metab._ 5, 179–192 (1985). Article CAS PubMed Google Scholar * Tokugawa, J., Ravasi, L., Nakayama,
T., Schmidt, K. C. & Sokoloff, L. Operational lumped constant for FDG in normal adult male rats. _J. Nucl. Med._ 48, 94–99 (2007). CAS PubMed Google Scholar * Graham, M. M. et al.
The FDG lumped constant in normal human brain. _J. Nucl. Med._ 43, 1157–1166 (2002). PubMed Google Scholar * Iozzo, P. et al. Quantification of liver glucose metabolism by positron
emission tomography: validation study in pigs. _Gastroenterology_ 132, 531–542 (2007). Article CAS PubMed Google Scholar * Virtanen, K. A. et al. Human adipose tissue glucose uptake
determined using [(18)F]-fluoro-deoxy-glucose ([(18)F]FDG) and PET in combination with microdialysis. _Diabetologia_ 44, 2171–2179 (2001). Article CAS PubMed Google Scholar * Peltoniemi,
P. et al. Lumped constant for [(18)F]fluorodeoxyglucose in skeletal muscles of obese and nonobese humans. _Am. J. Physiol. Endocrinol. Metab._ 279, E1122–E1130 (2000). Article CAS PubMed
Google Scholar * Botker, H. E. et al. Glucose uptake and lumped constant variability in normal human hearts determined with [18F]fluorodeoxyglucose. _J. Nucl. Cardiol._ 4, 125–132 (1997).
Article CAS PubMed Google Scholar * Ogawa, R., Fujita, T. & Fukuda, Y. Blood volume studies in healthy Japanese adults (Jpn). _Respir Circ_ 18, 833–838 (1970). Google Scholar *
Lee, H. B. & Blaufox, M. D. Blood volume in the rat. _J. Nucl. Med._ 26, 72–76 (1985). CAS PubMed Google Scholar * Garcia-Villalba, R. et al. Alternative method for gas
chromatography-mass spectrometry analysis of short-chain fatty acids in faecal samples. _J Sep Sci_ 35, 1906–1913 (2012). Article CAS PubMed Google Scholar * Fushimi, T. et al. Dynamic
metabolome analysis reveals the metabolic fate of medium-chain fatty acids in AML12 cells. _J. Agric. Food Chem._ 68, 11997–12010 (2020). Article CAS PubMed Google Scholar * Tsuchida,
H., Morita, Y., Nogami, M. & Ogawa, W. Metformin action in the gut-insight provided by [(18)F]FDG PET imaging. _Diabetol Int_ 13, 35–40 (2022). Article PubMed Google Scholar * Waki,
A. et al. Glucose transporter protein-independent tumor cell accumulation of fluorine-18-AFDG, a lipophilic fluorine-18-FDG analog. _J. Nucl. Med._ 39, 245–250 (1998). CAS PubMed Google
Scholar * Koffert, J. P. et al. Metformin treatment significantly enhances intestinal glucose uptake in patients with type 2 diabetes: Results from a randomized clinical trial. _Diabetes
Res. Clin. Pract._ 131, 208–216 (2017). Article CAS PubMed Google Scholar * Massollo, M. et al. Metformin temporal and localized effects on gut glucose metabolism assessed using 18F-FDG
PET in mice. _J. Nucl. Med._ 54, 259–266 (2013). Article CAS PubMed Google Scholar * Bielicki, L., Krieglstein, J. & Wever, K. Key enzymes of glycolysis in brain as influenced by
thiopental. _Arzneimittelforschung_ 30, 594–597 (1980). CAS PubMed Google Scholar * Zuurbier, C. J., Keijzers, P. J., Koeman, A., Van Wezel, H. B. & Hollmann, M. W. Anesthesia’s
effects on plasma glucose and insulin and cardiac hexokinase at similar hemodynamics and without major surgical stress in fed rats. _Anesth. Analg._ 106, 135–142 (2008). Article CAS PubMed
Google Scholar * Agus, A., Clement, K. & Sokol, H. Gut microbiota-derived metabolites as central regulators in metabolic disorders. _Gut_ 70, 1174–1182 (2021). Article CAS PubMed
Google Scholar * Okahashi, N., Yamada, Y., Iida, J. & Matsuda, F. Isotope calculation gadgets: a series of software for isotope-tracing experiments in garuda platform. _Metabolites_ 12
https://doi.org/10.3390/metabo12070646 (2022). * Ait-Omar, A. et al. GLUT2 accumulation in enterocyte apical and intracellular membranes: a study in morbidly obese human subjects and ob/ob
and high fat-fed mice. _Diabetes_ 60, 2598–2607 (2011). Article CAS PubMed PubMed Central Google Scholar * Horakova, O. et al. Metformin acutely lowers blood glucose levels by
inhibition of intestinal glucose transport. _Sci. Rep._ 9, 6156 (2019). Article PubMed PubMed Central Google Scholar * Kwon, I. G. et al. Serum glucose excretion after Roux-en-Y gastric
bypass: a potential target for diabetes treatment. _Gut_ 70, 1847–1856 (2021). Article CAS PubMed Google Scholar * Hu, S. et al. The urinary glucose excretion by sodium-glucose
cotransporter 2 inhibitor in patients with different levels of renal function: a systematic review and meta-analysis. _Front. Endocrinol. (Lausanne)_ 12, 814074 (2021). Article PubMed
Google Scholar * Mueller, N. T. et al. Metformin affects gut microbiome composition and function and circulating short-chain fatty acids: a randomized trial. _Diabetes Care_ 44, 1462–1471
(2021). Article CAS PubMed PubMed Central Google Scholar * Kim, S. K. Small intestine transit time in the normal small bowel study. _Am. J. Roentgenol. Radium Ther. Nucl. Med._ 104,
522–524 (1968). Article CAS PubMed Google Scholar * Bond, J. H. Jr, Levitt, M. D. & Prentiss, R. Investigation of small bowel transit time in man utilizing pulmonary hydrogen (H2)
measurements. _J. Lab. Clin. Med._ 85, 546–555 (1975). CAS PubMed Google Scholar * Sakar, Y. et al. Metformin-induced regulation of the intestinal D-glucose transporters. _J. Physiol.
Pharmacol._ 61, 301–307 (2010). CAS PubMed Google Scholar * Tobar, N. et al. Metformin acts in the gut and induces gut-liver crosstalk. _Proc. Natl. Acad. Sci. USA._ 120, e2211933120
(2023). Article CAS PubMed PubMed Central Google Scholar * Sokoloff, L. et al. The [14C]deoxyglucose method for the measurement of local cerebral glucose utilization: theory, procedure,
and normal values in the conscious and anesthetized albino rat. _J. Neurochem._ 28, 897–916 (1977). Article CAS PubMed Google Scholar * Wright, E. M., Loo, D. D. & Hirayama, B. A.
Biology of human sodium glucose transporters. _Physiol. Rev._ 91, 733–794 (2011). Article CAS PubMed Google Scholar * Yang, M. et al. Inhibition of mitochondrial function by metformin
increases glucose uptake, glycolysis and GDF-15 release from intestinal cells. _Sci. Rep._ 11, 2529 (2021). Article CAS PubMed PubMed Central Google Scholar * Czyzyk, A., Tawecki, J.,
Sadowski, J., Ponikowska, I. & Szczepanik, Z. Effect of biguanides on intestinal absorption of glucose. _Diabetes_ 17, 492–498 (1968). Article CAS PubMed Google Scholar * Wu, T. et
al. Metformin reduces the rate of small intestinal glucose absorption in type 2 diabetes. _Diabetes Obes. Metab._ 19, 290–293 (2017). Article CAS PubMed Google Scholar * Gouyon, F. et
al. Simple-sugar meals target GLUT2 at enterocyte apical membranes to improve sugar absorption: a study in GLUT2-null mice. _J. Physiol._ 552, 823–832 (2003). Article CAS PubMed PubMed
Central Google Scholar Download references ACKNOWLEDGEMENTS The authors thank Y. Ogawa, C. Aoki, and S. Hirahara-Owada for technical assistance. This study was supported in part by Japan
Society for the Promotion of Science KAKENHI grants 22K18393 (to W.O., Y.I.), 20K17511 (to H.K.), and 21K08578 (to K. Sakaguchi) as well as by grants from Japan Diabetes Society (to Y.M.),
Manpei Suzuki Diabetes Federation (to W.O.), Cell Science Research Foundation, Suzuken Memorial Foundation, Japan Diabetes Foundation, and Nippon Boehringer Ingelheim Co. Ltd. (to K.
Sugawara), JST-Mirai (JPMJMI20G1 to Y.I.) of the Japan Science and Technology Agency (JST). AUTHOR INFORMATION Author notes * These authors contributed equally: Kazuhiko Sakaguchi, Kenji
Sugawara, Yusei Hosokawa, Jun Ito, Yasuko Morita. AUTHORS AND AFFILIATIONS * Division of Diabetes and Endocrinology, Department of Internal Medicine, Kobe University Graduate School of
Medicine, Kobe, Japan Kazuhiko Sakaguchi, Kenji Sugawara, Yusei Hosokawa, Jun Ito, Yasuko Morita, Hisako Komada, Tomoko Yamada, Yushi Hirota & Wataru Ogawa * Division of Community
Medicine and Medical Education, Department of Social/Community Medicine and Health Science, Kobe University Graduate School of Medicine, Kobe, Japan Kazuhiko Sakaguchi * Laboratory for
Pathophysiological and Health Science, RIKEN Center for Biosystems Dynamics Research, Kobe, Japan Hiroshi Mizuma & Yasuyoshi Watanabe * Faculty of Informatics, Cyber Informatics Research
Institute, Kindai University, Osaka, Japan Yuichi Kimura * Division of Metabolomics, Medical Research Center for High Depth Omics, Medical Institute of Bioregulation, Kyushu University,
Fukuoka, Japan Shunsuke Aburaya, Masatomo Takahashi, Yoshihiro Izumi & Takeshi Bamba * Department of Food Science and Nutrition, Research Institute of Food and Nutritional Sciences,
Graduate School of Human Science and Environment, University of Hyogo, Hyogo, Japan Masaru Yoshida * Department of Radiology, Kobe University Graduate School of Medicine, Kobe, Japan
Munenobu Nogami & Takamichi Murakami * Division of Medical Imaging, Biomedical Imaging Research Center, University of Fukui, Fukui, Japan Munenobu Nogami Authors * Kazuhiko Sakaguchi
View author publications You can also search for this author inPubMed Google Scholar * Kenji Sugawara View author publications You can also search for this author inPubMed Google Scholar *
Yusei Hosokawa View author publications You can also search for this author inPubMed Google Scholar * Jun Ito View author publications You can also search for this author inPubMed Google
Scholar * Yasuko Morita View author publications You can also search for this author inPubMed Google Scholar * Hiroshi Mizuma View author publications You can also search for this author
inPubMed Google Scholar * Yasuyoshi Watanabe View author publications You can also search for this author inPubMed Google Scholar * Yuichi Kimura View author publications You can also search
for this author inPubMed Google Scholar * Shunsuke Aburaya View author publications You can also search for this author inPubMed Google Scholar * Masatomo Takahashi View author publications
You can also search for this author inPubMed Google Scholar * Yoshihiro Izumi View author publications You can also search for this author inPubMed Google Scholar * Takeshi Bamba View
author publications You can also search for this author inPubMed Google Scholar * Hisako Komada View author publications You can also search for this author inPubMed Google Scholar * Tomoko
Yamada View author publications You can also search for this author inPubMed Google Scholar * Yushi Hirota View author publications You can also search for this author inPubMed Google
Scholar * Masaru Yoshida View author publications You can also search for this author inPubMed Google Scholar * Munenobu Nogami View author publications You can also search for this author
inPubMed Google Scholar * Takamichi Murakami View author publications You can also search for this author inPubMed Google Scholar * Wataru Ogawa View author publications You can also search
for this author inPubMed Google Scholar CONTRIBUTIONS K. Sakaguchi, M.N., and W.O. conceived and designed the study. K. Sakaguchi, Y.M., J.I., T.Y., and H.K. analyzed the human data. K.
Sugawara and Y. Hosokawa analyzed the mouse data. H.M. and Y.W. contributed to quantitative analysis of FDG excretion in mice. Y.K. contributed to mathematical analysis. S.A., M.T., Y.I.,
and T.B. contributed to SCFA measurement. Y. Hirota, M.Y., and T.M. contributed to discussion. K. Sakaguchi, Y. Hosokawa, and W.O. wrote the manuscript. W.O. is the guarantor of this work
and, as such, had full access to all the data in the study and takes responsibility for the integrity of the data and the accuracy of the data analysis. K. Sakaguchi, K. Sugawara, Y.
Hosokawa, J.I., and Y. M. contributed equally to this study. CORRESPONDING AUTHOR Correspondence to Wataru Ogawa. ETHICS DECLARATIONS COMPETING INTERESTS The authors declare the following
competing interests: W.O. has received research support and lecture fees from Sumitomo Pharma and Teijin Pharma. K. Sakaguchi and Y. Hirota have received research support from Sumitomo
Pharma. All other authors declare no competing interests. PEER REVIEW PEER REVIEW INFORMATION _Communications Medicine_ thanks Soroush Safaei, Tongzhi Wu and the other, anonymous,
reviewer(s) for their contribution to the peer review of this work. Primary Handling Editors: [EBM name(s)] and [Internal Editor name(s)]. A peer review file is available. ADDITIONAL
INFORMATION PUBLISHER’S NOTE Springer Nature remains neutral with regard to jurisdictional claims in published maps and institutional affiliations. SUPPLEMENTARY INFORMATION PEER REVIEW FILE
SUPPLEMENTARY INFORMATION DESCRIPTION OF ADDITIONAL SUPPLEMENTARY FILES SUPPLEMENTARY DATA SUPPLEMENTARY MOVIE 1 SUPPLEMENTARY MOVIE 2 REPORTING SUMMARY RIGHTS AND PERMISSIONS OPEN ACCESS
This article is licensed under a Creative Commons Attribution-NonCommercial-NoDerivatives 4.0 International License, which permits any non-commercial use, sharing, distribution and
reproduction in any medium or format, as long as you give appropriate credit to the original author(s) and the source, provide a link to the Creative Commons licence, and indicate if you
modified the licensed material. You do not have permission under this licence to share adapted material derived from this article or parts of it. The images or other third party material in
this article are included in the article’s Creative Commons licence, unless indicated otherwise in a credit line to the material. If material is not included in the article’s Creative
Commons licence and your intended use is not permitted by statutory regulation or exceeds the permitted use, you will need to obtain permission directly from the copyright holder. To view a
copy of this licence, visit http://creativecommons.org/licenses/by-nc-nd/4.0/. Reprints and permissions ABOUT THIS ARTICLE CITE THIS ARTICLE Sakaguchi, K., Sugawara, K., Hosokawa, Y. _et
al._ Metformin-regulated glucose flux from the circulation to the intestinal lumen. _Commun Med_ 5, 44 (2025). https://doi.org/10.1038/s43856-025-00755-4 Download citation * Received: 13
November 2023 * Accepted: 28 January 2025 * Published: 03 March 2025 * DOI: https://doi.org/10.1038/s43856-025-00755-4 SHARE THIS ARTICLE Anyone you share the following link with will be
able to read this content: Get shareable link Sorry, a shareable link is not currently available for this article. Copy to clipboard Provided by the Springer Nature SharedIt content-sharing
initiative