Play all audios:
Hello everyone, today I would like to share my experience with ELK Stack. This step-by-step beginner’s guide will allow you to set up your ELK environment and index a sample log file. We
will then use the Kibana Dashboard to visualize the indexed record. PREREQUISITES * A system with Centos 8 installed * Access to a terminal window/command line (Search > Terminal) * A
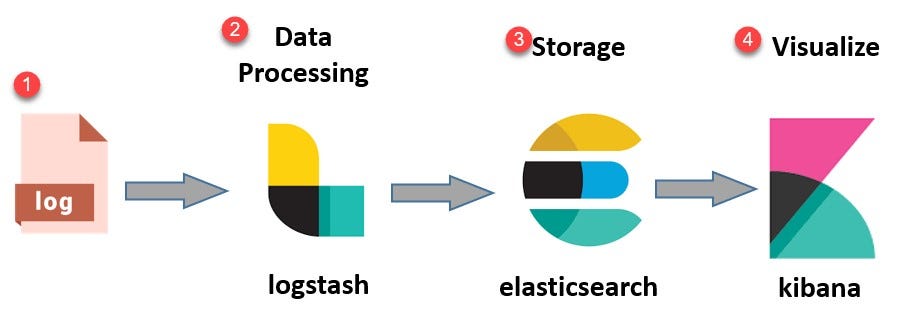
user account with sudo or root privileges * Java version 8 or 11 (required for Logstash) WHAT DOES THE ELK STACK STAND FOR? ELK stands for Elasticsearch, Logstash, and Kibana. They are the
three components of the ELK stack. ELASTICSEARCH (INDEXES DATA) — This is the core of the Elastic software. Elasticsearch is a search and analytics engine used to sort through data. LOGSTASH
(COLLECTS DATA) — This package connects to various data sources, caches them, and directs them to storage. As its name suggests, it collects and “stashes” your log files. KIBANA (VISUALIZES
DATA) — Kibana is a graphical tool for visualizing data. Use it to generate charts and graphs to make sense of the raw data in your databases. > Before going ahead with the
implementation, let us first have a look > at some of the case studies. CASE STUDIES NETFLIX Netflix heavily relies on the ELK stack. The company uses the ELK stack to monitor and analyze
customer service operations’ security logs. It allows them to index, store, and search documents from more than fifteen clusters which comprise almost 800 nodes. LINKEDIN The famous social
media marketing site LinkedIn uses the ELK stack to monitor performance and security. The IT team integrated ELK with Kafka to support its load in real-time. Their ELK operation includes
more than 100 clusters across six different data centers. TRIPWIRE: Tripwire is a worldwide Security Information Event Management system. The company uses ELK to support information packet
log analysis. MEDIUM: Medium is a famous blog-publishing platform. Medium uses the ELK stack to debug its production issues. The company also uses ELK to detect DynamoDB hotpots. Moreover,
using this stack, the company can support 25 million unique readers and thousands of published posts each week. STEP 1: INSTALL OR CHECK OPENJDK 8 JAVA IN YOUR SYSTEM We will first install
Java 8. To check if you already have java installed or not, use the below command and execute it inside a terminal - To install Java 8, open a terminal and type the command - > sudo yum
install java-1.8.0-openjdk -y The system will check the repositories and then install java in your system. (Please make sure your internet connection is active.) STEP 2: ADD ELK REPOSITORY
We will have to add the ELK repository to access Elasticsearch, Logstash, and Kibana. First, import the Elasticsearch PGP Key. Open a terminal window, then enter the following code: >
sudo rpm — import > https://artifacts.elastic.co/GPG-KEY-elasticsearch This command will add the Elasticsearch public signing key to your system. This key will validate the Elasticsearch
software when you download it. Now, you will need to create the repository config file for ELK. Start by moving into the directory: > cd /etc/yum.repos.d/ Next, create the config file in
a text editor of your choice: > sudo vi elasticsearch.repo Type or copy the following lines: > [elasticstack] > name=Elastic repository for 7.x packages >
baseurl=https://artifacts.elastic.co/packages/7.x/yum > gpgcheck=1 > gpgkey=https://artifacts.elastic.co/GPG-KEY-elasticsearch > enabled=1 > autorefresh=1 > type=rpm-md Press
ESC, then type “:WQ” and hit ENTER. Finally, update your repositories package lists: > YUM UPDATE STEP 3: INSTALL AND SET UP ELASTICSEARCH The order of installation is essential. Start by
installing Elasticsearch. In a terminal window, type in the command: > SUDO YUM INSTALL ELASTICSEARCH -Y This command will scan all your repositories for the Elasticsearch package and
install it. Once the installation finishes, open and edit the configuration file: > SUDO VI /ETC/ELASTICSEARCH/ELASTICSEARCH.YML Scroll down to the section labeled NETWORK. Below that
entry, you should see the following lines: You can adjust the NETWORK.HOST to your server’s IP address or set it to localhost if setting up a single node locally. By default, ELASTIC SEARCH
bind to PORT 9200; HOWEVER, you can adjust the port by changing the value of HTTP.PORT. After changing the host and port configuration, you will need to save the file. Press ESC, then type
“:WQ” and hit ENTER. Now, we will start the elastic search service: > SUDO SYSTEMCTL START ELASTICSEARCH Now, if you want the service to launch at boot, then: > SUDO SYSTEMCTL ENABLE
ELASTICSEARCH To test the elastic-search connection: STEP 4: INSTALL AND SET UP KIBANA Kibana is a graphical interface for parsing and interpreting log files. Kibana uses the same GPG key as
Elasticsearch, so you don’t need to re-import the key. Additionally, the Kibana package is in the same ELK stack repository as Elasticsearch. Hence, there is no need to create another
repository configuration file. To install Kibana, open a terminal window, enter the following: > sudo yum install kibana -y The system will scan the repositories and then install them.
Now, we will configure the KIBANA.YML file: > sudo vi /etc/kibana/kibana.yml You can adjust the SERVER.HOST to your server’s IP address or set it to localhost if setting up a single node
locally. You can also adjust the SERVER.PORT to change the binding port for Kibana. Also, configure the elastic search.HOSTS to connect with the Elasticsearch. Make any other edits as
desired, then save the file. Press ESC, then type “:WQ” and hit ENTER. NOTE: YOUR SYSTEM MAY SUBSTITUTE 127.0.0.1:9200 FOR THE LOCALHOST:9200 LINE. Now, we will start the elastic search
service: > SUDO SYSTEMCTL START KIBANA Now, if you want the service to launch at boot, then: > SUDO SYSTEMCTL ENABLE KIBANA Check if FIREWALLD is enabled in your CentOS system; you
need to allow traffic on port 5601. In a terminal window, run the following command: > firewall-cmd — add-port=5601/tcp — permanent Next, reload the firewalld service: > firewall-cmd —
reload The above action is a prerequisite if you intend to access the Kibana dashboard from external machines. Now, open a web browser, and enter the address: HTTP://LOCALHOST:5601 STEP 5:
INSTALL AND SET UP LOGSTASH Logstash is a tool that collects data from different sources. The data it collects is parsed by Kibana and stored in Elasticsearch. Like other parts of the ELK
stack, Logstash uses the same Elastic GPG key and repository. To install Logstash on CentOS 8, in a terminal window, enter the command: > sudo yum install logstash -y Now, we will create
a custom configuration file in the /ETC/LOGSTASH/CONF.D/ directory. Logstash will use this configuration file, parse incoming data and then forward it to Elasticsearch. First, go to the
Logstash configuration directory: > cd /etc/logstash/conf.d/ Create a configuration file: > vi customlogs.conf Enter the below lines inside the configuration file: input { beats {
port => 5044 } }filter{ }output { elasticsearch { hosts => ["http://localhost:9200"] index => "sample-log" } } Press ESC, then
type “:WQ” and hit ENTER. Below is the complete explanation of each line that we have written inside the file: INPUT — inside this, we will configure the source of our log/data. For now, I
have configured it to parse all the incoming data from file beat on port 5044. FILTER — inside this, we ask Logstash to perform some action on data if it meets specific criteria. For now, we
are keeping it empty. OUTPUT — inside this, we are telling Logstash the location where we have to send the data. We have configured it to send the log to Elasticsearch and store it inside
the index SAMPLE LOG. NOTE: THE INDEX NAME WE ARE USING SHOULD BE IN SMALL LETTERS. Now, we will start the Logstash service: > SUDO SYSTEMCTL START LOGSTASH Now, if you want the service
to launch at boot, then: > SUDO SYSTEMCTL ENABLE LOGSTASH STEP 6: INSTALL FILEBEAT To simplify logging, install a lightweight module called Filebeat. Filebeat is a shipper for logs that
centralizes data streaming. To install Filebeat, open a terminal window, and run the command: > sudo yum install filebeat -y NOTE: MAKE SURE THAT THE KIBANA SERVICE IS UP AND RUNNING
DURING THE INSTALLATION PROCEDURE. Now, we will configure the Filebeat to access a log directory and send it to the Logstash. Go to the Filebeat directory: > cd /etc/filebeat/ Inside
this, you will see the FILEBEAT.YML file. Please open it and look for the FILEBEAT INPUTS. > vi filebeat.yml Now, edit the file with the below information: - type: log enabled: true
paths: - /home/nnewar/logs/*.log [Provide the directory of your log] Your configuration file should look like below: Now, in the same file, we will configure the output for the
Filebeat. By default, you will see ELASTICSEARCH OUTPUT IS ENABLED. We will comment it out and ENABLE the LOGSTASH OUTPUT by uncommenting it. The updated configuration should look like this:
Now, we will start the Filebeat service: > SUDO SYSTEMCTL START FILEBEAT Now, if you want the service to launch at boot, then: > SUDO SYSTEMCTL ENABLE FILEBEAT Now, add some log files
inside the directory that you have provided inside the FILEBEAT.YML file. STEP 7: CHECK LOGS IN KIBANA If everything went well, then you could check the SAMPLE-LOG INDEX inside the Kibana:
> Open the Kibana Dashboard: http://localhost:5601 > Click on the three lines on the top-left side, then scroll down to > MANAGEMENT > STACK MANAGEMENT > Inside the DATA >
INDEX MANAGEMENT, you will the index name that we > created earlier inside the Logstash. STEP 8: KIBANA DASHBOARD CREATION Now, we will create a dashboard for the sample-log index to view
the record. > Go to KIBANA > INDEX PATTERNS present in the same page and click on > CREATE INDEX PATTERN on the top-right side: To view the records inside a dashboard, we will have
to create an Index Pattern for the indexes. On the next page, you will see the list of all the indexes present currently. For now, we will only see the SAMPLE-LOG INDEX. > Now, enter the
index pattern name SAMPLE-LOG inside the box and > click on NEXT STEP > On the next page, select TIMESTAMP from the drop down menu and click > on CREATE INDEX PATTERN You have
successfully created the Index pattern. Now, we will see the records of this index pattern inside the Kibana dashboard. > Click on three lines on the top-left and go to KIBANA >
DISCOVER Once you click the Discover tab, you will see all the available records inside the SAMPLE-LOG INDEX PATTERN. In the above image, you will see the log information inside the MESSAGE
TAG. > NOTE: YOU WILL SEE THE NUMBER OF RECORDS DEPENDING ON THE NUMBER OF > LINES PRESENT INSIDE THE LOGS. THE REASON IS WE HAVE NOT PROPERLY > FILTERED THE DATA DURING THE
LOGSTASH CONFIGURATION. SINCE THIS IS A > BEGINNER GUIDE, I WILL NOT MENTION THE FILTER CONFIGURATION. Congratulations, you have successfully configured your first ELK stack environment.
IF IT WAS PLEASANT OR HELPFUL TO YOU, PLEASE PRESS THE 👏 CLAP BUTTON AND HELP OTHERS FIND THIS STORY. _DID YOU KNOW YOU COULD GIVE UP TO 50 CLAPS?_