Play all audios:
ABSTRACT Arabia has served as a strategic crossroads for human disseminations, providing a natural connection between the distant populations of China and India in the east to the western
civilizations along the Mediterranean. To explore this region's critical role in the migratory episodes leaving Africa to Eurasia and back, high-resolution Y-chromosome analysis of
males from the United Arab Emirates (164), Qatar (72) and Yemen (62) was performed. The role of the Levant in the Neolithic dispersal of the E3b1-M35 sublineages is supported by the data,
and the distribution and STR-based analyses of J1-M267 representatives points to their spread from the north, most likely during the Neolithic. With the exception of Yemen, southern Arabia,
South Iran and South Pakistan display high diversity in their Y-haplogroup substructure possibly a result of gene flow along the coastal crescent-shaped corridor of the Gulf of Oman
facilitating human dispersals. Elevated rates of consanguinity may have had an impact in Yemen and Qatar, which experience significant heterozygote deficiencies at various hypervariable
autosomal STR loci. SIMILAR CONTENT BEING VIEWED BY OTHERS ORIGIN AND DIFFUSION OF HUMAN Y CHROMOSOME HAPLOGROUP J1-M267 Article Open access 23 March 2021 DELINEATING THE DISPERSAL OF
Y-CHROMOSOME SUB-HAPLOGROUP O2A2B-P164 AMONG AUSTRONESIAN-SPEAKING POPULATIONS Article Open access 24 January 2024 SUBDIVIDING Y-CHROMOSOME HAPLOGROUP R1A1 REVEALS NORSE VIKING DISPERSAL
LINEAGES IN BRITAIN Article Open access 02 November 2020 INTRODUCTION Arabia has played the role of a strategic crossroads between Africa and Eurasia, facilitating the first exodus of modern
humans from the Horn of Africa to the present day Yemen through the Bab el Mandab Strait at mouth of the Red Sea.1, 2, 3 Subsequent migrations through the northern intercontinental
passageway between Africa and the Levant (the Levantine corridor) have also been documented.4, 5 In addition, the Arabian Peninsula has linked the distant populations of China and India to
communities of the Mediterranean and beyond. Although the Persian Gulf to the east and the Arabian Sea to the south offered easy passages to India and Asia, the Red Sea on the western coast
of the Arabian Peninsula provided a natural connection to the Mediterranean Sea. Just north of the peninsula, the Nile River Valley in Egypt and the Tigris–Euphrates area in Iraq comprised a
region known as the Fertile Crescent. Recognized as the birthplace of agriculture during the Neolithic (∼8000 yBP) based on linguistic and archaeological evidence,6, 7 the Fertile Crescent
participated in ancient international trade. Although the fertile soils produced a surplus of food, the region lacked the natural resources necessary for building permanent structures
(timber) or making metals (minerals). Therefore, early inhabitants relied on trade to acquire these raw materials and established close links with the commercial centers along the Persian
Gulf as reflected in archaeological finds.8, 9, 10 At the extreme southern end of the Arabian Peninsula, referred to as Arabia Felix by the Romans (‘Happy Arabia’ in Latin) and including
present day Yemen, the spice trade was an important source of wealth. Frankincense and myrrh were commonly exported to the Mediterranean via camels and to India by sea. In agreement with
archaeological and historical records that accentuate the region's active role as a point of contact between distant populations, the Middle East displays a high degree of genetic
diversity.11, 12, 13, 14 Although genetic diversity is elevated, various analyses have identified structural barriers to gene flow into and out of the Near East. Specifically, mtDNA,15
Y-chromosome14, 16, 17, 18 and autosomal STR studies19 have identified the Dasht-e Kavir and Dash-e Lut deserts in Iran and the Hindu Kush mountains in eastern Afghanistan as potential
barriers to gene flow to the surrounding regions. In contrast, geographic facilitators for gene flow have also been described, including a region along the southern coast of Iran,
Afghanistan and Pakistan known as Balochistan mediating gene flow from South Pakistan to South Iran.14 Mitochondrial DNA analyses have been performed on collections from Qatar, United Arab
Emirates (UAE) and Yemen,5, 20 yet the paternal component of this historically and geographically significant region is incomplete. Although Y-chromosome studies have focused on neighboring
areas, including Egypt,4 Somalia,21 Iraq,22 Syria and Lebanon23 as well as on the southern Arabian populations of Oman4 and Yemen,24 high resolution Y-chromosome analyses of the Persian and
Oman Gulfs are fragmentary. To gain a more complete understanding of this region's role in human dispersals, particularly in light of previous studies that have identified barriers and
conduits to gene flow that would affect its Y-haplogroup substructure, the present study employs high-resolution Y-chromosome analyses of three southern Arabian populations: Yemen (_n_=62),
Qatar (_n_=72) and the UAE (_n_=164). In addition, 17 Y-STR loci were typed to obtain STR-based age estimates for a selection of informative Y-chromosome haplogroups in the populations in
which they were observed. Results from these Y-specific analyses were interpreted in conjunction with data on 15 autosomal STR loci for Yemen, Oman, Qatar, Iran, Egypt19, 25, 26 and UAE
(Cadenas, unpublished results) reanalyzed collectively with the aim of exposing characteristics unique to the southern Arabian Peninsula. MATERIALS AND METHODS SAMPLE COLLECTION AND DNA
EXTRACTION Blood samples from 298 unrelated males representing three populations that include the UAE, Qatar and Yemen were collected in EDTA Vacutainer tubes. The paternal ancestry of the
donors was recorded for a minimum of two generations. Table 1 provides additional information on the sample size, geography and linguistic affiliation of the populations involved. DNA was
extracted from the blood using the phenol–chloroform extraction method.33 Ethical guidelines were adhered to in strict compliance with NIH guidelines as well as to those stipulated by the
institutions involved. Y-HAPLOGROUP ANALYSIS Seventy-six binary genetic markers were genotyped12, 30, 34, 35, 36 following the Y-chromosome phylogeny hierarchy using standard methods,
including PCR/RFLP, allele-specific PCR37 and the YAP polymorphic _Alu_ insertion.38 The amplicons generated from these methods were separated by electrophoresis in 1X TAE, 3% agarose gels
and visualized subsequent to ethidium bromide staining and UV light photography in a Fotodyne FOTO/Analyst®. The phylogenetic relationships of the relevant Y-chromosome haplogroups are
illustrated in Figure 1 according to YCC nomenclature39 with new marker designations as provided in the published literature.12, 30, 34, 35, 36 STATISTICAL AND PHYLOGENETIC ANALYSES
Twenty-nine geographically targeted populations reported in previous studies (Table 1) were included in the statistical and phylogenetic analyses performed to assess Y-haplogroup variation
and phylogeographic relationships throughout the region. The Georgia and Tajikistan data will be published in detail elsewhere. The various data sets were used at a resolution of major
haplogroups (A through R). Haplogroup frequencies were compared by means of a _χ_2-test. Phylogenetic comparisons were made with multidimensional scaling (MDS) analysis based on Fst
distances40 using the Statistical Package for the Social Sciences (SPSS) software program.41 Genetic structure was further examined by performing two sets of analyses of molecular variance
(AMOVA)42 using the Arlequin version 2.000 package43 with the 32 populations subdivided according to two criteria, geography (North Africa, East Africa, Arabian Peninsula, Caucasus, Levant,
Anatolia, Iranian Plateau, South Asia and Central Asia) and linguistic family (Afro-Asiatic, Indo-European, Niger-Congo, Altaic and South Caucasian). Table 1 indicates the populations
included in each of the geographic and linguistic groups utilized in the AMOVA. Pairwise comparisons of the populations from the present study and all reference populations were generated
using _G_-tests in Carmody's software44 to assess any genetic differences of statistical significance. STR ANALYSIS DNA amplification of 17 Y-specific STR loci (specifically DYS19,
DYS385a/b, DYS389I/II, DYS390, DYS391, DYS392, DYS393, DYS437, DYS438, DYS439, DYS448, DYS456, DYS458, DYS635 and Y-GATA H4) was performed using the AmpF_l_STR Yfiler Amplification Kit
(Applied Biosystems, Foster City, CA, USA) according to the manufacturer's instructions in an Eppendorf® Mastercycler®. DNA fragment separation and detection was achieved in an ABI
Prism 3100 Genetic Analyzer (Applied Biosystems). ABI Genescan500 LIZ was utilized as an internal size standard. Amplicon sizes were determined using the Genescan® 3.7 software and alleles
were designated by comparison to an allelic ladder from the manufacturer using Genotyper® 3.7 NT software. Haplogroup-specific expansion times were estimated for select binary haplogroups
(J1-M267, R1a1-M198, E3b1a-M78 and E3b1c-M123) by the linear expansion method. This procedure assumes a stepwise mutation model45 and a mean STR mutation rate of 0.00069 per STR locus per
generation46 with a 25-year intergeneration time as performed in previous studies.4, 12, 47 The linear expansion method assumes a star-like genealogy attributable to continuous growth where
the expected value of the average coalescence time for STR alleles (T) equals the STR variance (S) divided by the mutation rate (_μ_) times the number of generations since expansion.48, 49
STR variances were calculated using the vp equation of Kayser _et al._50 In addition, STR-based divergence times were calculated for each of the haplogroups based on the method described by
Zhivotovsky _et al_,46, 51 likewise assuming a mutation rate of 0.00069 per STR locus per generation46 and a 25 year intergeneration time. AUTOSOMAL STR MARKERS To further assess the level
of homogeneity of the populations under study, the observed and expected heterozygosity for 15 autosomal STR loci were calculated using the Arlequin version 2.000 package43 based on the
genotypes for Iran,25 Qatar,26 UAE (Cadenas, unpublished results), and Kenya, Egypt, Oman and Yemen.19 Heterozygote deficiencies (Fis and corresponding _P_-values) were computed for all
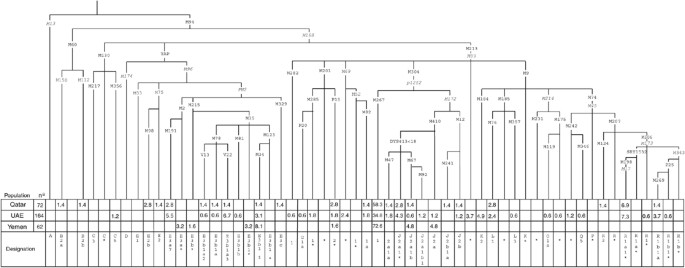
seven populations using the GENEPOP2 software52 according to the test described by Rousset and Raymond.53 RESULTS PHYLOGEOGRAPHY A total of 41 paternal haplogroups were identified from the
analysis of 164 United Arab Emirate, 72 Qatari and 62 Yemeni males. Figure 1 displays their hierarchical phylogeny as well as the frequency (percentages) distributions for the populations
under study. The geographic distribution of the major haplogroups is illustrated in Figure 2. Only three haplogroups (E, J and R) display frequencies above 5% in the three populations
occupying the southern portion of the Arabian Peninsula and combined account for 74–98% of the chromosomes within these collections. Figure 3 displays the geographic distribution of E, J and
R derivatives in a subset of the populations listed in Table 1. AMOVA To explore potential correlations between genetic diversities and linguistic or geographic partitioning, the AMOVA was
performed. The results of the AMOVA for the three populations from the present study in addition to 29 reference populations are listed in Table 2. Assignment of the populations according to
the nine geographical groups described in Table 1 generated a higher fraction of variability among groups of populations (15.73%) than among populations within groups (4.21%) indicating a
greater degree of interregional structuring. In contrast, upon subdividing the populations according to the language family (Table 1), the percentage of among group variance is lower (8.17%)
than among populations within groups (12.94%), suggesting higher intralinguistic structuring for these populations. Genetic diversity among groups of populations and populations within
groups correlate significantly with geographic and linguistic partitioning. PHYLOGENETIC ANALYSES An MDS test was performed to assess phylogenetic relationships among populations. The MDS
analysis performed on a matrix of Fst values based on haplogroup frequencies for the populations in Table 1 is displayed in Figure 4. Geographic structuring is observed involving populations
displaying affiliations with other populations within their biogeographic zone. Within the plot, the populations of Egypt, Iraq, Yemen, Qatar, Oman, UAE, Syria and Lebanon occupy an
intermediate position with populations from Africa to one side and Anatolia, Caucasus, Iranian Plateau, Central Asia and South Asia on the other. Of note, for the observed partitioning is
the affinity of Egypt to populations from the Arabian Peninsula. Furthermore, Yemen and Qatar segregate together but separate from their neighboring populations, Oman and UAE particularly
along Dimension 2. As expected, the populations from Central Asia group together and away from the South Asian ones, however, there is a segregation of North Pakistan with populations from
Central Asia, whereas South Pakistan shares a closer affinity to populations to the west. INTERPOPULATION HAPLOGROUP DIVERSITY To discern statistically significant genetic differences,
pairwise G-test comparisons were performed with the three populations from the present study as well as the 29 reference populations described in Table 1. A total of 496 pairwise assessments
were made and the results are provided as Supplementary Table 1. The number of nonsignificant genetic differences observed was 31. Of note, the Lebanese and Syrian populations do not
display statistical differences with populations from UAE, Qatar and Oman but do show significant differences with Yemen. Furthermore, Yemen is the only one to display statistically
significant differences to all other populations in the analysis. Across all populations, the Lebanese and Syrians are involved in most of the pairings in which no significant difference is
observed (_α_=0.05). In addition to the three south Arabian populations of Qatar, UAE and Oman, the Algerian Berbers, Greece and Tajikistan do not exhibit significant differences to Lebanon
and Syria. However, Turkey and South Iran only exhibit nonsignificant values in pairwise comparisons with Syria. Y-STR DIVERSITY Y-chromosome STR diversity was ascertained to generate
haplogroup age estimates. Results from the expansion time analysis of populations for haplogroups J1-M267, R1a1-M198, E3b1a-M78 and E3b1c-M123 are provided in Table 3. Y-STR data for the
individuals genotyped are provided in Supplementary Table 2 (J1-M267), 3 (R1a1-M198), 4 (E3b1a-M78) and 5 (E3b1c-M123). The STR-based divergence times obtained using the method described by
Zhivotovsky _et al_46 (Table 3) for M123 are comparable (11.1 ky for UAE and 10.6 ky for Yemen), however, the UAE and Yemeni haplotypes within this haplogroup are quite different from each
other and did not form a compact network, suggesting the ancestors for the M123 chromosomes in both populations involved independent bottlenecks followed by similar demographic processes. In
contrast, the J1-M267 haplotypes formed a compact network across all the three populations and generated older age estimates for Yemen, Qatar and UAE (9.7, 7.4 and 6.4 ky, respectively) in
comparison to the linear expansion method (7.11, 4.93 and 5.43 ky, respectively). INTRAPOPULATION AUTOSOMAL STR DIVERSITY In order to determine the level of heterozygote deficiency, possibly
resulting from consanguinity, autosomal STR diversity was examined. Table 4 presents the observed and expected heterozygosity values of 15 autosomal STR loci for Kenya, Egypt, Iran, UAE,
Oman, Yemen and Qatar with the Fis values provided in the final column for each population. A gradient in the number of loci that exhibit significant (_P_<0.05) heterozygote deficiency is
apparent moving north then east with lower values from Africa (1/15 loci for Kenya and Egypt) and higher amounts to the west and south from the Iranian Plateau (2/15 in Iran) toward the
southern populations of the Arabian Peninsula (2/15 for UAE, 3/15 for Oman, 4/15 for Yemen and 8/15 for Qatar). DISCUSSION Analyses of the South Arabian Y-haplogroup substructure as well as
the region's phylogenetic relationships to neighboring populations have provided us information on the following points: (1) support of the role of the Levant in the Neolithic dispersal
of the E3b1-M35 derivatives, (2) neolithic spread of the J1-M267 haplogroup from the north, (3) a high haplogroup diversity shared among populations along the eastern and western coasts of
the Gulf of Oman and (4) a limited haplogroup diversity in Yemen also supported by significant heterozygote deficiencies at various hypervariable autosomal STR loci. DISTRIBUTION OF E3B1-M35
DERIVATIVES The presence of signature sub-Saharan African mtDNA lineages in the south Arabian populations has been attributed to various waves of gene flow to the region, including that
associated with the East African slave trade. This is apparent from the exact mtDNA haplotype matches between lineages in Yemen and East Africa, including those associated with the Bantu
expansion.20 The presence of the E3a-M2 lineage in Oman (7.4%),4 Yemen (3.2%), UAE (5.5%) and Qatar (2.8%) could lead to the oversimplified conclusion that these chromosomes are also a
contribution from the East African slave trade. Mitochondrial DNA analysis of the Yemen Hadramawt indicates recent gene flow (∼2500 yBP) from Africa to the Arab populations in part through
the slave trade, yet an ancient arrival from East Africa is responsible for the Y-chromosome haplotypes.54 The contrast between female- _versus_ male-mediated gene flow between these two
areas can be attributed to the assimilation of females within the Arabian populations, whereas the males were often excluded from reproductive opportunities. The E3b1-M35 sub-haplogroups,
M123 and M78, are believed to have spread from East Africa to North Africa and later expanded eastward through the Levantine corridor and westward to northwestern Africa. Although E3b1a-M78
data suggest that this dispersal occurred in both directions,4, 34, 47 E3b1c-M123 disseminated primarily to the east.4 The distribution of the E3b1-M35 derivatives in Yemen, Qatar and UAE
agrees with their arrival by expansion via the Levantine corridor rather than through the Horn of Africa. This route is similar to general patterns of Levantine mtDNA gene flows during the
Upper Paleolithic55 to the Neolithic.5, 55 This is immediately apparent by the M35 profile of several East African populations. Despite characterizing the East African populations and
persisting even after introduction of E3a-M2 during the Bantu expansion, E3b1*-M35 is completely absent from the Omani,4 Qatari and UAE collections and relatively low in the Yemeni (3.2%).
Kenya, Sudan and Tanzania4, 56, 57 also lack the E3b1c-M123 derivative that is common in the Near East.12, 56, 57, 58 Furthermore, Ethiopia56 and Somalia21 exhibit high levels of E3b1a-M78
(22.7 and 77.6%, respectively), which is null or nearly absent in the two populations closest to the Strait of Sorrows (Bab-el Mandeb Channel), Yemen (0%) and Oman (1.7%),4 (_χ_2=170.618,
d.f.=1, _P_<0.0001 when combining the frequencies for Ethiopia and Somalia _versus_ Yemen and Oman). On the other hand, Cruciani _et al_57 have postulated that the E3b1c-M123 clade may
have originated in the Near East, as its presence in East Africa is restricted to Ethiopia (11.2%). The median expansion time for M123 in Egypt is 10.8 ky,4 comparable to the estimated age
of M123 STR variation obtained through the method described by Zhivotovsky _et al_46 for UAE (11.1±3.9 ky) and Yemen (10.6±4.1 ky), although allelic differences between these two populations
indicate that they do not share a common ancestry. Recent archaeological finds supports a trading relationship between Mesopotamia and the Arabian Gulf region dating back to the Al Ubaid
Period (∼7000 yBP) as evidenced by the excavation of Ubaid pottery from Mesopotamia in UAE.8, 9, 10 Ancient maritime trade routes linking Mesopotamia to the Indus Valley included Dilmun (the
island of Bahrain) and Magan (in the southeastern tip of the Arabian Peninsula). It is possible that the close ties between Mesopotamia with both the Nile River Valley and the ancient
Persian Gulf region during the Neolithic helped disseminate these haplogroups. UAE is characterized by polymorphic levels of E3b1a-M78 (7.9%), similar to the Qatari (4.2%; _χ_2=1.12, d.f.=1,
_P_=0.29), with lower values in Oman4 (1.7%; _χ_2=5.49, d.f.=1, _P_=0.02) and greater frequencies in Egypt4 (18%; _χ_2=6.73, d.f.=1, _P_=0.01) where it is the highest M35 derivative. The
majority of the UAE M78 representatives belong to the E3b1a3-V22 clade (6.7%). STR networks of this newly defined marker indicate that it parallels the M78 haplotype cluster _δ_, although
some discrepancies exist.36 Based on the distribution and high STR differentiation of cluster _δ_, its dispersal may have occurred early, the first to spread the E3b1a-M78 chromosomes to
North Africa and then the Near East.57 ORIGIN OF J1-M267 Previous studies on haplogroup J1-M267 have documented high frequencies of this haplogroup in the areas of Oman (38%),4 Iraq
(33.1%),22 Egypt (20%),4 Lebanon (12.5%)23 and Turkey (8.99%).12 The combination of these data with the high frequency of J1-M267 in the Yemeni (72.6%), Qatari (58.3%) and UAE (34.8%)
samples examined in the present study reveals a decreasing frequency moving from southern Arabia northwards (Spearman's correlation coefficient with ranks based on distance from Yemen:
_r_=0.9286, _n_=8, _P_<0.01). It is also distributed throughout the northwestern African populations at considerable frequencies (35.0 and 30.1% in Algeria and Tunisia, respectively).58
Based on binary and STR markers, the greatest degree of differentiation for J1-M267 is detected in the Levant with two distinct demographic dispersals generating its current distribution. A
higher observed STR diversity of this clade among Europeans and Ethiopians in comparison to populations of North Africa points to its arrival to Ethiopia and Europe during Neolithic times
with a more recent appearance in the latter.58 Semino _et al_58 describe a YCAIIa22-YCAIIb22 motif in the North African (>90%) and Middle Eastern (>70%) J1-M267 representatives that is
less frequent in Ethiopia and Europe, postulating that the dispersal of the M267-YCAIIa22-YCAIIb22 clade occurred during the Arab expansion in the seventh century A.D. Median BATWING
expansion times based on Y-STR data for the Omani (2.3 ky; 95% CI: 0.6–29.2) J1-M267 chromosomes4 indicate a more recent arrival to the South Arabian populations as compared to the older
expansion times obtained for the Egyptian (6.4 ky; 95% CI: 0.6–278.5)4 and Turkish (15.4 ky; 95% CI: 0.4–604.8)12 representatives of this haplogroup. Conversely, in the present study, Y-STR
age estimates based on the method described by Zhivotovsky _et al_46 generated much older values for the J1-M267 haplogroup in Yemen, Qatar and UAE (9.7±2.4, 7.4±2.3 and 6.4±1.4 ky,
respectively) than seen in the Omani,4 consistent with an earlier arrival to the region during the Neolithic. The data suggest expansion from the north during the Neolithic (or perhaps more
recently), which is also reflected in the lower STR variances in southern Arabia (0.14 for Qatar, 0.15 for UAE, 0.20 for Yemen and 0.27 for Oman4 _versus_ 0.31 in Egypt4 and 0.51 in
Turkey12). Subsequently, a series of recent demographic events may account for the high haplogroup frequency of J1-M267 in the populations from the present study. IMPLICATIONS OF
Y-CHROMOSOME DISTRIBUTION IN ARABIA Overall, the southern Arabian populations segregate together at an intermediate position with populations from the Levant in the MDS plot, appropriate
considering their strategic geographic location at a major bidirectional gateway connecting Africa and Eurasia. Based on the AMOVA, it is also possible to deduce that the overall
Y-haplogroup substructure observed in these regions is affected more by geography (φct=0.16) than by language (φct=0.08). Upon classifying the populations based on language family
affiliations, the variance among populations within groups is greater (φSC=0.14) than the φct attributable to variation among groups. This difference can be expected since the Afro-Asiatic
family encompasses a large variety of languages. Pairwise comparisons of the 32 populations based on Y-haplogroup frequency data (Supplementary Table 1) revealed that only 13 of 90
comparisons display nonsignificant differences within the Afro-Asiatic family, leaving a total of 77 pairwise comparisons generating significant differences. The 13 pairs with nonsignificant
differences involve the Levantine populations of Lebanon and Syria possibly as a result of their central position in relation to other Afro-Asiatic groups, whereas the remaining three
include the populations within northwest Africa. Studies focused on this crossroads for human movements have identified geographical barriers that may have limited gene flow with neighboring
regions. Specifically, a study based on 15 autosomal STR loci detected a concentration of genetic homogeneity within the Near East, suggesting that the Saharan desert, the Iranian deserts
and the Hindu Kush Mountains may have acted as obstacles for dispersal.19 The portrayal of the Dasht-e Kavir and Dash-e Lut deserts of Iran as barriers to gene flow has been described in the
context of the R1a1-M198 lineage14, 16, 17, 18 as well as in the dissemination of R1b1a-M269 within Iran.14 Moreover, an admixture analysis by Regueiro _et al_14 identified the harsh,
mountainous terrain in Northeast Turkey as well as the Hindu Kush Mountains as limiting factors of gene flow to the Iranian Plateau, whereas the Balochistan acted as a possible conduit for
human dispersals. This coastal region that encompasses parts of South Iran, Afghanistan and Pakistan may have provided a unique corridor along the Gulf of Oman. To examine the degree and
geographic extent of genetic homogeneity within the Gulf of Oman, the frequency of the predominant haplogroups were contrasted among the populations in the region. A _χ_2-test on the
haplogroup frequencies of Oman, UAE, South Iran14 and South Pakistan30 indicates that the most frequent haplogroups, E (_χ_2=20.836, d.f.=3, _P_<0.0001), J (_χ_2=8.677, d.f.=3,
_P_=0.0339) and R (_χ_2=40.142, d.f.=3, _P_<0.0001) are not evenly distributed among the four populations. As the MDS plot displayed a close affiliation between South Pakistan and North
Iran and the former segregated away from the Gulf of Oman populations, the _χ_2-test was repeated excluding South Pakistan. Although statistically significant differences are still apparent
for haplogroup E (_χ_2=10.170, d.f.=2, _P_=0.0062) and _R_ (_χ_2=10.560, d.f.=2, _P_=0.0051), J (_χ_2=2.577, d.f.=2, _P_=0.2757) exhibits an even distribution among Oman, UAE and South Iran.
However, a greater homogeneity is observed among the South Arabian populations of Oman, UAE and Qatar for haplogroups E (_χ_2=2.249, d.f.=2, _P_=0.3248), J (_χ_2=4.831, d.f.=2, _P_=0.0893)
and _R_ (_χ_2=0.308, d.f.=2, _P_=0.8573). The significant differences in frequency of haplogroups result in detectable clines moving from the South Arabian populations to South Iran and then
South Pakistan (E: 18.8, 6.8 and 3.3%; J: 50.4, 35.0 and 25.3%; and R: 11.2, 25.6 and 46.2% for South Arabia, South Iran14 and South Pakistan,30 respectively). In addition, South Pakistan,
South Iran, UAE, Oman and Qatar (although to a lesser extent) share a similar Y-haplogroup substructure with clinal decreases in diversity detected as one moves west to Africa, north to the
Levant and Caucasus and east to south and central Asia (Figure 2). Although the Hindu Kush Mountains and Iranian deserts may have played a significant role in encapsulating the region and
limiting gene flow,14, 25 the coastal area may have served as a unique corridor facilitating dispersals into and out of the region at various times in recent human evolution. At another
extreme, the haplogroup distribution of Yemen shows very limited variation, particularly when compared to neighboring populations, Oman and UAE (3 _versus_ 11 haplogroups each), whereas
Qatar is intermediate with a total of seven haplogroups, four of which display frequencies of less than 3.0%. Although Qatar does not approximate the lack of diversity seen in Yemen, the two
populations display affinities that are apparent in the MDS plot, in which populations of the Levant are interspersed among the South Arabian populations, with Qatar and Yemen segregating
apart from both UAE and Oman. REGIONAL AUTOSOMAL STR ANALYSIS To investigate the underlying reasons for the limited Y-chromosome diversity in Yemen, the observed heterozygosity values of 15
highly polymorphic autosomal STR loci were calculated using samples from Kenya,19 Egypt,19 Oman,19 Yemen,19 Iran,25 Qatar26 and UAE (Cadenas, unpublished results) and are presented in Table
4. Owing to the large number of alleles that exist at each locus, obtaining heterozygote deficiencies may be indicative of a high degree of consanguinity within populations. Qatar possesses
8 out of 15 loci with significant heterozygote deficiency (_P_<0.05), approximated by Yemen (4 loci) and Oman (3 loci), whereas UAE and Iran display only two loci followed by Egypt and
Kenya with one locus each. A series of recent demographic events may offer an explanation for the Y-haplogroup distribution observed in Yemen. The J1-M267 Y-pattern in particular may have
arisen as a result of a founder effect followed by genetic drift. Furthermore, nonrandom-mating practices are common in the area, with cultural beliefs that support polygamy and patrilocal
behaviors that perpetuate specific male lines within the region. In addition, consanguineous marriages, particularly among first cousins, are common in the Middle East due to Muslim
tradition. This form of inbreeding can serve to propagate a specific patrilineage. Although a combination of these processes probably played a part in forming the Y-haplogroup substructure
seen in Yemen, based on the regional autosomal STR analysis, it is likely that inbreeding may have been a significant contributing factor. A study performed within Sana’a City, Yemen
revealed a incidence of consanguinity of 44.7%, with first-cousin marriages comprising 71.6%, and an average coefficient of inbreeding (the probability of an individual having two alleles
identical by descent at a given locus) of 0.02442,59 almost double that of the Egyptian population (0.01)60 and four times that of the Turkish population (0.0064532).61 Similar studies
conducted in Qatar indicate a rate of consanguinity of 54.0% (first cousin marriages accounting for 34.8%) and a coefficient of inbreeding of 0.02706,62 whereas comparable consanguinity
values were observed in UAE (50.5%)63 and Oman (35.9%).64 These figures are representative of the region as a whole where consanguineous marriages are prevalent (28.96% in Egypt,60 33% in
Syria,65 51.2–54.4% in Jordan,66, 67 57.7% in Saudi Arabia68 and 54.4% in Kuwait69). It is significant that in spite of these characteristics, which tend to temper genetic diversity, high
Y-chromosome haplogroup variability is exhibited in the Gulf of Oman coastal crescent. Patrilineal systems, polygamy and consanguinity are forces that will favor limited diversity along the
lines of what is seen in Yemen. It is likely that the region's continued critical role in trade has rendered it an important point of contact between populations and a target of attacks
in attempts to gain control of trade from the Persian Gulf. Furthermore, Oman's role in the East African slave trade has been well documented and supported by previous studies4, 5, 54
and may account, at least partially, for the greater diversity it displays. CONCLUSION A comparison of Y-haplogroup substructure of the populations surrounding the Gulf of Oman reveals
similarities among them with detectable clines in haplogroup frequencies. This can be attributed to the existence at different times of a coastal corridor along the Gulf of Oman that may
have facilitated dispersals into and out of the area. Chromosomes like E3b1c-M123 support archaeological data linking the Fertile Crescent with trading cities along the Persian Gulf, whereas
derivatives of E3b1-M35 point to a Neolithic arrival to southern Arabia via the Levant. The limited variability seen in Yemen (and to some extent Qatar) does not mirror the diversity
observed in the coastal populations of UAE, Oman, South Iran and South Pakistan. An analysis of heterozygosity using hypervariable autosomal STR loci indicates that both Yemen and Qatar
display a deficiency in observed heterozygosity that may be affected to some extent by high rates of consanguineous marriages in the region. In addition, a string of relatively recent events
may have maintained Oman and UAE in close contact with other cultures, including attempts to gain control of the Persian Gulf and Oman's involvement in the East African slave trade.
REFERENCES * Lahr MM, Foley R : Multiple dispersals and modern human origins. _Evol Anthropol_ 1994; 3: 48–60. Article Google Scholar * Stringer C : Coasting out of Africa. _Nature_ 2000;
405: 24–25,27. Article CAS PubMed Google Scholar * Oppenheimer S : _Out of Eden: The Peopling of the World_. Constable: London, 2003. Google Scholar * Luis JR, Rowold DJ, Regueiro M _et
al_: The Levant _versus_ the Horn of Africa: evidence for bidirectional corridors of human migrations. _Am J Hum Genet_ 2004; 74: 32–544. Article Google Scholar * Rowold DJ, Luis JR,
Terreros MC, Herrera RJ : Mitochondrial DNA geneflow indicates preferred usage of the Levant corridor over the Horn of Africa. _J Hum Genet_ 2007; 52: 436–447. Article CAS PubMed Google
Scholar * Hassan F : Archeology and linguistic diversity in North Africa; In: Bellwood P, Renfrew C (eds): _Examining the Farming/Language Dispersal Hypothesis_. McDonald Institute for
Archaeological Research: Cambridge, 2002, pp 127–133. Google Scholar * Militarev A : The prehistory of a dispersal: the proto-Afrasian (Afroasiatic) farming lexicon; In Bellwood P, Renfrew
C (eds).: _Examining the farming/language dispersal hypothesis_. McDonald Institute for Archaeological Research: Cambridge, 2002, pp 135–150. Google Scholar * Flavin K, Shepherd E : Fishing
in the Gulf: preliminary investigations at an Ubaid site, Dalma (UAE). _PSAS_ 1994; 24: 115–134. Google Scholar * Beech M, Elders J : An ‘Ubaid-related settlement on Dalma Island, Abu
Dhabi Emirate, United Arab Emirates. _Bull Soc Arabian Stud_ 1999; 4: 17–21. Google Scholar * Beech M, Cuttler R, Moscrop D _et al_: New evidence for the Neolithic settlement of Marawah
Island, Abu Dhabi, United Arab Emirates. _PSAS_ 2005; 35: 37–56. Google Scholar * Cavalli-Sforza LL, Menozzi P, Piazza A : _The History and Geography of Human Genes_. Princeton University
Press: Princeton, 1994. Google Scholar * Cinnioǧlu C, King R, Kvisild T _et al_: Excavating Y-chromosome haplotype strata in Anatolia. _Hum Genet_ 2004; 114: 127–148. Article PubMed
Google Scholar * Nasidze I, Ling EYS, Quinque D _et al_: Mitochondrial DNA and Y-chromosome variation in the Caucasus. _Ann Hum Genet_ 2004; 68: 205–221. Article CAS PubMed Google
Scholar * Regueiro M, Cadenas AM, Gayden T, Underhill PA, Herrera RJ : Iran: Tricontinental nexus for Y-driven migration. _Hum Hered_ 2006; 61: 132–143. Article CAS PubMed Google Scholar
* Quintana-Murci L, Chaix R, Wells RS _et al_: Where west meets east: the complex mtDNA landscape of the southwest and central Asian corridor. _Am J Hum Genet_ 2004; 74: 827–845. Article
CAS PubMed PubMed Central Google Scholar * Quintana-Murci L, Krausz C, Zerjal T _et al_: Y-chromosome lineages trace diffusion of people and languages in southwestern Asia. _Am J Hum
Genet_ 2001; 68: 537–542. Article CAS PubMed Google Scholar * Wells RS, Yuldasheva N, Ruzibakiev R _et al_: The Eurasian heartland: a continental perspective on Y-chromosome diversity.
_Proc Natl Acad Sci USA_ 2001; 98: 10244–10249. Article CAS PubMed PubMed Central Google Scholar * Qamar R, Ayub Q, Mohyuddin A _et al_: Y chromosomal DNA variation in Pakistan. _Am J
Hum Genet_ 2002; 70: 1107–1124. Article CAS PubMed PubMed Central Google Scholar * Shepard EM, Herrera RJ : Genetic encapsulation among Near Eastern populations. _J Hum Genet_ 2006; 51:
467–476. Article PubMed Google Scholar * Kivisild T, Reidla M, Metspalu E _et al_: Ethiopian mitochondrial DNA heritage: tracking gene flow across and around the gate of tears. _Am J Hum
Genet_ 2004; 75: 752–770. Article CAS PubMed PubMed Central Google Scholar * Sanchez JJ, Hallenberg C, Borsting C, Hernandez A, Morling N : High frequencies of Y chromosome lineages
characterized by E3b1, DYS19-11, DYS392-12 in Somali males. _Eur J Hum Genet_ 2005; 13: 856–866. Article CAS PubMed Google Scholar * Al-Zahery N, Semino O, Benuzzi G _et al_:
Y-chromosome and mtDNA polymorphisms in Iraq, a crossroad of the early human dispersal and of post-Neolithic migrations. _Mol Phylogenet Evol_ 2003; 28: 458–472. Article CAS PubMed Google
Scholar * Semino O, Passarino G, Oefner PJ _et al_: The genetic legacy of Paleolithic _Homo sapiens sapiens_ in extant Europeans: a Y chromosome perspective. _Science_ 2000; 290:
1155–1159. Article CAS PubMed Google Scholar * Thomas MG, Parfitt T, Weiss DA _et al_: Y chromosomes traveling south: the cohen modal haplotype and the origins of the Lemba-the ‘Black
Jews of Southern Africa’. _Am J Hum Genet_ 2000; 66: 674–686. Article CAS PubMed PubMed Central Google Scholar * Shepard EM, Herrera RJ : Iranian STR variation at the fringes of
biogeographical demarcation. _For Sci Int_ 2005; 158: 140–148. Google Scholar * Perez-Miranda AM, Alfonso-Sanchez MA, Pena JA, Herrera RJ : Qatari DNA variation at a crossroad of human
migrations. _Hum Hered_ 2006; 61: 67–79. Article CAS PubMed Google Scholar * Arredi B, Poloni ES, Paracchini S _et al_: A predominantly Neolithic origin for Y-chromosomal DNA variation
in North Africa. _Am J Hum Genet_ 2004; 75: 338–345. Article CAS PubMed PubMed Central Google Scholar * Semino O, Santachiara-Benerecetti AS, Falaschi F, Cavalli-Sforza LL, Underhill PA
: Ethiopians and Khoisan share the deepest clades of the human Y-chromosome phylogeny. _Am J Hum Genet_ 2002; 70: 265–268. Article CAS PubMed Google Scholar * Nasidze I, Sarkisian T,
Kerimov A, Stoneking M : Testing hypotheses of language replacement in the Caucasus: evidence from the Y-chromosome. _Hum Genet_ 2003; 112: 255–261. PubMed Google Scholar * Sengupta S,
Zhivotovsky LA, King R _et al_: Polarity and temporality of high-resolution Y-chromosome distributions in India identify both indigenous and exogenous expansions and reveal minor genetic
influence of Central Asian pastoralists. _Am J Hum Genet_ 2006; 78: 202–221. Article CAS PubMed Google Scholar * Kivisild T, Rootsi S, Metspalu M _et al_: The genetic heritage of the
earliest settlers persists both in Indian tribal and caste populations. _Am J Hum Genet_ 2003; 72: 313–332. Article CAS PubMed PubMed Central Google Scholar * Karafet T, Xu L, Du R _et
al_: Paternal population history of East Asia: sources, patterns, and microevolutionary processes. _Am J Hum Genet_ 2001; 69: 615–628. Article CAS PubMed PubMed Central Google Scholar *
Antunez de Mayolo G, Antunez de Mayolo A, Antunez de Mayolo P _et al_: Phylogenetics of worldwide human populations as determined by polymorphic _Alu_ insertions. _Electrophoresis_ 2002;
23: 3346–3356. Article CAS PubMed Google Scholar * Underhill PA, Passarino G, Lin AA _et al_: The phylogeography of Y chromosome binary haplotypes and the origins of modern human
populations. _Ann Hum Genet_ 2001; 65: 43–62. Article CAS PubMed Google Scholar * Shen P, Lavi T, Kivisild T _et al_: Reconstruction of patrilineages and matrilineages of Samaritans and
other Israeli populations from Y-chromosome and mitochondrial DNA sequence variation. _Hum Mutat_ 2004; 24: 248–260. Article CAS PubMed Google Scholar * Cruciani F, La Fratta R, Torroni
A, Underhill PA, Scozzari R : Molecular dissection of the Y chromosome haplogroup E-M78 (E3b1a): a posteriori evaluation of a STR-network-based approach through six new biallelic markers.
_Hum Mutat_ 2006; 27: 831–832. Article PubMed Google Scholar * Martinez L, Reategui EP, Fonseca LR _et al_: Superimposing polymorphism: the case of a point mutation within a polymorphic
Alu insertion. _Hum Hered_ 2005; 59: 109–117. Article PubMed Google Scholar * Hammer MF, Horai S : Y chromosomal DNA variation and the peopling of Japan. _Am J Hum Genet_ 1995; 56:
951–962. CAS PubMed PubMed Central Google Scholar * Y Chromosome Consortium: A nomenclature system for the tree of human Y-chromosomal binary haplogroups. _Genome Res_ 2002; 12: 339–348.
Article Google Scholar * Reynolds J, Weir BS, Cockerham CC : Estimation of the coancestry coefficient: basis for a short term genetic distance. _Genetics_ 1983; 105: 767–779. CAS PubMed
PubMed Central Google Scholar * SPSS for Windows, Rel. 11.0.1.2001. SPSS Inc: Chicago. * Excoffier L, Smouse PE, Quattro JM : Analysis of molecular variance inferred from metric
distances among DNA haplotypes: application to human mitochondrial DNA restriction data. _Genetics_ 1992; 131: 479–491. CAS PubMed PubMed Central Google Scholar * Schneider S, Roessli D,
Excoffier L : A software for population genetics data analysis. Arlequin version 2.000. Genetics and Biometry Laboratory, University of Geneva: Switzerland, 2000. * Carmody G : _G-test_.
Carleton University: Ottawa, 1991. Google Scholar * Kimura M, Ohta T : Stepwise mutation model and distribution of allelic frequencies in a finite population. _Proc Natl Acad Sci USA_ 1978;
75: 2868–2872. Article CAS PubMed PubMed Central Google Scholar * Zhivotovsky LA, Underhill PA, Cinnioǧlu C _et al_: The effective mutation rate at Y chromosome short tandem repeats,
with application to human population-divergence time. _Am J Hum Genet_ 2004; 74: 50–61. Article CAS PubMed Google Scholar * Cruciani F, Santolamazza P, Shen P _et al_: A back migration
from Asia to sub-saharan Africa is supported by high resolution analysis of human Y-chromosome haplotypes. _Am J Hum Genet_ 2002; 70: 1197–1214. Article CAS PubMed PubMed Central Google
Scholar * Di Rienzo A, Peterson AC, Garza JC, Valdes AM, Slatkin M, Freimer NB : Mutational processes of simple-sequence repeat loci in human populations. _Proc Natl Acad Sci USA_ 1994; 91:
3166–3170. Article CAS PubMed PubMed Central Google Scholar * Kittles RA, Perola M, Peltonen L _et al_: Dual origins of Finns revealed Y chromosome haplotype variation. _Am J Hum
Genet_ 1998; 62: 1171–1179. Article CAS PubMed PubMed Central Google Scholar * Kayser M, Krawczak M, Excoffier L _et al_: An extensive analysis of Y-chromosomal STR haplotypes in
globally dispersed human populations. _Am J Hum Genet_ 2001; 68: 990–1018. Article CAS PubMed PubMed Central Google Scholar * Zhivotovsky LA, Goldstein DB, Feldman MW : Genetic sampling
error of distance (δμ)2 and variation in mutation rate among STR loci. _Mol Biol Evol_ 2001; 18: 2141–2145. Article CAS PubMed Google Scholar * Raymond M, Rousset F : GENEPOP (version
1.2): population genetics software for exact tests and ecumenicism. _J Hered_ 1995; 86: 248–249. Article Google Scholar * Rousset F, Raymond M : Testing heterozygote excess and deficiency.
_Genetics_ 1995; 140: 1413–1419. CAS PubMed PubMed Central Google Scholar * Richards M, Rengo C, Cruciani F _et al_: Extensive female-mediated gene flow from sub-Saharan Africa into
Near Eastern Arab populations. _Am J Hum Genet_ 2003; 72: 1058–1064. Article CAS PubMed PubMed Central Google Scholar * Olivieri A, Achilli A, Pala M _et al_: The mtDNA legacy of the
Levantine early Upper Palaeolithic in Africa. _Science_ 2006; 314: 1767–1770. Article CAS PubMed Google Scholar * Underhill PA, Shen P, Lin AA _et al_: Y chromosome sequence variation
and the history of human populations. _Nat Genet_ 2000; 26: 358–361. Article CAS PubMed Google Scholar * Cruciani F, La Fratta R, Santolamazza P _et al_: Phylogeographic analysis of
haplogroup E3b (E-M215) Y chromosomes reveals multiple migratory events within and out of Africa. _Am J Hum Genet_ 2004; 74: 1014–1022. Article CAS PubMed PubMed Central Google Scholar
* Semino O, Magri C, Benuzzi G _et al_: Origin, diffusion, and differentiation of Y-chromosome haplogroups E and J: inferences on the neolithization of Europe and later migratory events in
the Mediterranean area. _Am J Hum Genet_ 2004; 74: 1023–1034. Article CAS PubMed PubMed Central Google Scholar * Gunaid AA, Hummad NA, Tamim KA : Consanguineous marriage in the capital
city Sana’a, Yemen. _J Biosoc Sci_ 2004; 36: 111–121. Article PubMed Google Scholar * Hafez M, El-Tahan H, Awadalla M, El-Khayat H, Abdel-Gafar A, Ghoneim M : Consanguineous mating in the
Egyptian population. _J Med Genet_ 1983; 20: 58–60. Article CAS PubMed PubMed Central Google Scholar * Basaran N, Sayli BS, Basaran A, Solak M, Artan S, Stevenson JD : Consanguineous
marriages in the Turkish population. _Clin Genet_ 1988; 34: 339–341. Article CAS PubMed Google Scholar * Bener A, Alali KA : Consanguineous marriage in a newly developed country: The
Qatari population. _J Biosoc Sci_ 2005; 38: 239–246. Article Google Scholar * Al-Gazali LI, Bener A, Abdulrazzaq YM, Micallef R, Al-Khayat AI, Gaber T : Consanguineous marriages in the
United Arab Emirates. _J Biosoc Sci_ 1997; 29: 491–497. Article CAS PubMed Google Scholar * Rajab A, Patton MA : A study of consanguinity in the Sultanate of Oman. _Ann Hum Bio_ 2000;
27: 321–326. Article CAS Google Scholar * Prothro ET, Diab LN : _Changing Family Patterns in the Arab East Beirut_. American University: Beirut, 1974. Google Scholar * Khoury SA, Massad
D : Consanguineous marriage in Jordan. _Am J Med Genet_ 1992; 43: 769–775. Article CAS PubMed Google Scholar * Sueyoshi S, Ohtsuka R : Effects of polygyny and consanguinity on high
fertility in the rural Arab population in South Jordan. _J Biosoc Sci_ 2003; 35: 513–526. Article PubMed Google Scholar * El-Hazmi MAF, Al-Swailem AR, Warsy AS, Al-Swailem AM, Sulaimani
R, Al-Meshari AA : Consanguinity among Saudi Arabian population. _J Med Genet_ 1995; 32: 623–626. Article CAS PubMed PubMed Central Google Scholar * Al-Awadi SA, Moussa MA, Naguib KK
_et al_: Consanguinity among the Kuwait population. _Clin Genet_ 1985; 27: 483–486. Article CAS PubMed Google Scholar Download references ACKNOWLEDGEMENTS We gratefully acknowledge
Tenzin Gayden and Maria Regueiro for their contributions to this study as well as Sheyla Mirabal for her technical assistance. AUTHOR INFORMATION AUTHORS AND AFFILIATIONS * Department of
Biological Sciences, Florida International University, Miami, FL, USA Alicia M Cadenas & Rene J Herrera * N. I. Vavilov Institute of General Genetics, Russian Academy of Sciences,
Moscow, Russia Lev A Zhivotovsky * Department of Genetics, Stanford University, Stanford, CA, USA Luca L Cavalli-Sforza & Peter A Underhill Authors * Alicia M Cadenas View author
publications You can also search for this author inPubMed Google Scholar * Lev A Zhivotovsky View author publications You can also search for this author inPubMed Google Scholar * Luca L
Cavalli-Sforza View author publications You can also search for this author inPubMed Google Scholar * Peter A Underhill View author publications You can also search for this author inPubMed
Google Scholar * Rene J Herrera View author publications You can also search for this author inPubMed Google Scholar CORRESPONDING AUTHOR Correspondence to Rene J Herrera. ADDITIONAL
INFORMATION Supplementary Information accompanies the paper on European Journal of Human Genetics website (http://www.nature.com/ejhg) SUPPLEMENTARY INFORMATION SUPPLEMENTARY TABLE1 (XLS 28
KB) SUPPLEMENTARY TABLE 2 (XLS 48 KB) SUPPLEMENTARY TABLE 3 (XLS 24 KB) SUPPLEMENTARY TABLE 4 (XLS 23 KB) SUPPLEMENTARY TABLE 5 (XLS 23 KB) RIGHTS AND PERMISSIONS Reprints and permissions
ABOUT THIS ARTICLE CITE THIS ARTICLE Cadenas, A., Zhivotovsky, L., Cavalli-Sforza, L. _et al._ Y-chromosome diversity characterizes the Gulf of Oman. _Eur J Hum Genet_ 16, 374–386 (2008).
https://doi.org/10.1038/sj.ejhg.5201934 Download citation * Received: 20 February 2007 * Revised: 30 August 2007 * Accepted: 11 September 2007 * Published: 10 October 2007 * Issue Date:
March 2008 * DOI: https://doi.org/10.1038/sj.ejhg.5201934 SHARE THIS ARTICLE Anyone you share the following link with will be able to read this content: Get shareable link Sorry, a shareable
link is not currently available for this article. Copy to clipboard Provided by the Springer Nature SharedIt content-sharing initiative KEYWORDS * Arabia * Y-chromosome * SNP * Y-STR