Play all audios:
ABSTRACT The proliferation of genetically modified mouse models has exposed phenotypic variation between investigators and institutions that has been challenging to control1,2,3,4,5. In many
cases, the microbiota is the presumed cause of the variation. Current solutions to account for phenotypic variability include littermate and maternal controls or defined microbial consortia
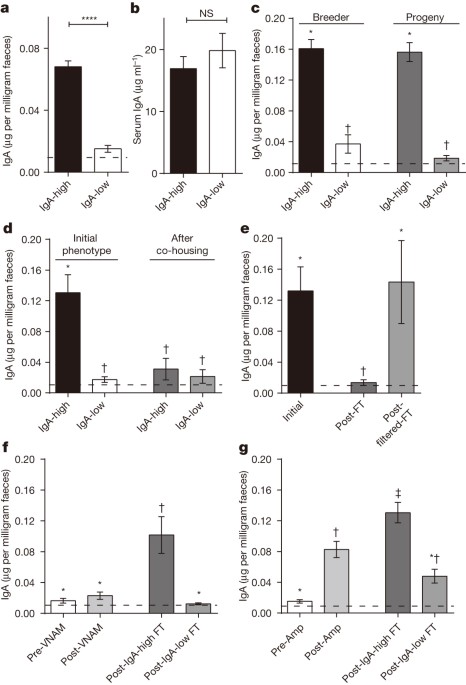
in gnotobiotic mice6,7. In conventionally raised mice, the microbiome is transmitted from the dam2,8,9. Here we show that microbially driven dichotomous faecal immunoglobulin-A (IgA) levels
in wild-type mice within the same facility mimic the effects of chromosomal mutations. We observe in multiple facilities that vertically transmissible bacteria in IgA-low mice dominantly
lower faecal IgA levels in IgA-high mice after co-housing or faecal transplantation. In response to injury, IgA-low mice show increased damage that is transferable by faecal transplantation
and driven by faecal IgA differences. We find that bacteria from IgA-low mice degrade the secretory component of secretory IgA as well as IgA itself. These data indicate that phenotypic
comparisons between mice must take into account the non-chromosomal hereditary variation between different breeders. We propose faecal IgA as one marker of microbial variability and conclude
that co-housing and/or faecal transplantation enables analysis of progeny from different dams. Access through your institution Buy or subscribe This is a preview of subscription content,
access via your institution ACCESS OPTIONS Access through your institution Subscribe to this journal Receive 51 print issues and online access $199.00 per year only $3.90 per issue Learn
more Buy this article * Purchase on SpringerLink * Instant access to full article PDF Buy now Prices may be subject to local taxes which are calculated during checkout ADDITIONAL ACCESS
OPTIONS: * Log in * Learn about institutional subscriptions * Read our FAQs * Contact customer support SIMILAR CONTENT BEING VIEWED BY OTHERS SHARED AND DISTINCTIVE FEATURES OF THE GUT
MICROBIOME OF C57BL/6 MICE FROM DIFFERENT VENDORS AND PRODUCTION SITES, AND IN RESPONSE TO A NEW VIVARIUM Article 14 June 2021 GENETIC MAPPING OF MICROBIAL AND HOST TRAITS REVEALS PRODUCTION
OF IMMUNOMODULATORY LIPIDS BY _AKKERMANSIA MUCINIPHILA_ IN THE MURINE GUT Article Open access 09 February 2023 TRANSFER EFFICIENCY AND IMPACT ON DISEASE PHENOTYPE OF DIFFERING METHODS OF
GUT MICROBIOTA TRANSFER Article Open access 15 November 2022 ACCESSION CODES PRIMARY ACCESSIONS EUROPEAN NUCLEOTIDE ARCHIVE * PRJEB7854 DATA DEPOSITS 16S rDNA sequencing data have been
deposited in the European Nucleotide Archive under accession number PRJEB7854. CHANGE HISTORY * _ 06 MAY 2015 The footnote symbols in Fig. 2d and Tukey’s P-value in the Figs 1-4 legends were
corrected. _ REFERENCES * Hao, L. Y., Liu, X. & Franchi, L. Inflammasomes in inflammatory bowel disease pathogenesis. _Curr. Opin. Gastroenterol._ 29, 363–369 (2013) Article CAS
PubMed Google Scholar * Ubeda, C. et al. Familial transmission rather than defective innate immunity shapes the distinct intestinal microbiota of TLR-deficient mice. _J. Exp. Med._ 209,
1445–1456 (2012) Article CAS PubMed PubMed Central Google Scholar * Letran, S. E. et al. TLR5-deficient mice lack basal inflammatory and metabolic defects but exhibit impaired CD4 T
cell responses to a flagellated pathogen. _J. Immunol._ 186, 5406–5412 (2011) Article CAS PubMed Google Scholar * Ivanov, I. I. et al. Induction of intestinal Th17 cells by segmented
filamentous bacteria. _Cell_ 139, 485–498 (2009) Article CAS PubMed PubMed Central Google Scholar * Cadwell, K. et al. Virus-plus-susceptibility gene interaction determines Crohn’s
disease gene Atg16L1 phenotypes in intestine. _Cell_ 141, 1135–1145 (2010) Article CAS PubMed PubMed Central Google Scholar * Holmdahl, R. & Malissen, B. The need for littermate
controls. _Eur. J. Immunol._ 42, 45–47 (2012) Article CAS PubMed Google Scholar * Hooper, L. V., Littman, D. R. & Macpherson, A. J. Interactions between the microbiota and the immune
system. _Science_ 336, 1268–1273 (2012) Article ADS CAS PubMed PubMed Central Google Scholar * Spor, A., Koren, O. & Ley, R. Unravelling the effects of the environment and host
genotype on the gut microbiome. _Nature Rev. Microbiol._ 9, 279–290 (2011) Article CAS Google Scholar * Fujiwara, R., Watanabe, J. & Sonoyama, K. Assessing changes in composition of
intestinal microbiota in neonatal BALB/c mice through cluster analysis of molecular markers. _Br. J. Nutr._ 99, 1174–1177 (2008) Article CAS PubMed Google Scholar * Brandtzaeg, P.
Secretory IgA: designed for anti-microbial defense. _Front. Immunol._ 4, 222 (2013) Article PubMed PubMed Central Google Scholar * Johansen, F. E. et al. Absence of epithelial
immunoglobulin A transport, with increased mucosal leakiness, in polymeric immunoglobulin receptor/secretory component-deficient mice. _J. Exp. Med._ 190, 915–922 (1999) Article CAS PubMed
PubMed Central Google Scholar * Tsuji, M., Suzuki, K., Kinoshita, K. & Fagarasan, S. Dynamic interactions between bacteria and immune cells leading to intestinal IgA synthesis.
_Semin. Immunol._ 20, 59–66 (2008) Article CAS PubMed Google Scholar * Blutt, S. E. & Conner, M. E. The gastrointestinal frontier: IgA and viruses. _Front. Immunol._ 4, 402 (2013)
Article PubMed PubMed Central Google Scholar * Murthy, A. K., Dubose, C. N., Banas, J. A., Coalson, J. J. & Arulanandam, B. P. Contribution of polymeric immunoglobulin receptor to
regulation of intestinal inflammation in dextran sulfate sodium-induced colitis. _J. Gastroenterol. Hepatol._ 21, 1372–1380 (2006) CAS PubMed Google Scholar * Reikvam, D. H. et al.
Epithelial-microbial crosstalk in polymeric Ig receptor deficient mice. _Eur. J. Immunol._ 42, 2959–2970 (2012) Article CAS PubMed Google Scholar * Brandtzaeg, P. & Prydz, H. Direct
evidence for an integrated function of J chain and secretory component in epithelial transport of immunoglobulins. _Nature_ 311, 71–73 (1984) Article ADS CAS PubMed Google Scholar *
Brown, W. R., Newcomb, R. W. & Ishizaka, K. Proteolytic degradation of exocrine and serum immunoglobulins. _J. Clin. Invest._ 49, 1374–1380 (1970) Article CAS PubMed PubMed Central
Google Scholar * Lindh, E. Increased resistance of immunoglobulin A dimers to proteolytic degradation after binding of secretory component. _J. Immunol._ 114, 284–286 (1975) CAS PubMed
Google Scholar * Wexler, H. M. et al. _Sutterella wadsworthensis_ gen. nov., sp. nov., bile-resistant microaerophilic _Campylobacter gracilis_-like clinical isolates. _Int. J. Syst.
Bacteriol._ 46, 252–258 (1996) Article CAS PubMed Google Scholar * Moon, C., Vandussen, K. L., Miyoshi, H. & Stappenbeck, T. S. Development of a primary mouse intestinal epithelial
cell monolayer culture system to evaluate factors that modulate IgA transcytosis. _Mucosal Immunol._ 7, 818–828 (2014) Article CAS PubMed Google Scholar * Plaut, A. G., Gilbert, J. V.,
Artenstein, M. S. & Capra, J. D. _Neisseria gonorrhoeae_ and _Neisseria meningitidis_: extracellular enzyme cleaves human immunoglobulin A. _Science_ 190, 1103–1105 (1975) Article ADS
CAS PubMed Google Scholar * Loomes, L. M., Senior, B. W. & Kerr, M. A. A proteolytic enzyme secreted by _Proteus mirabilis_ degrades immunoglobulins of the immunoglobulin A1 (IgA1),
IgA2, and IgG isotypes. _Infect. Immun._ 58, 1979–1985 (1990) CAS PubMed PubMed Central Google Scholar * Ichinohe, T. et al. Microbiota regulates immune defense against respiratory tract
influenza A virus infection. _Proc. Natl Acad. Sci. USA_ 108, 5354–5359 (2011) Article ADS CAS PubMed PubMed Central Google Scholar * Lee, Y. K., Menezes, J. S., Umesaki, Y. &
Mazmanian, S. K. Proinflammatory T-cell responses to gut microbiota promote experimental autoimmune encephalomyelitis. _Proc. Natl Acad. Sci. USA_ 108 (suppl. 1). 4615–4622 (2011) Article
ADS CAS PubMed Google Scholar * Rakoff-Nahoum, S., Paglino, J., Eslami-Varzaneh, F., Edberg, S. & Medzhitov, R. Recognition of commensal microflora by toll-like receptors is required
for intestinal homeostasis. _Cell_ 118, 229–241 (2004) Article CAS PubMed Google Scholar * Williams, B. L., Hornig, M., Parekh, T. & Lipkin, W. I. Application of novel PCR-based
methods for detection, quantitation, and phylogenetic characterization of _Sutterella_ species in intestinal biopsy samples from children with autism and gastrointestinal disturbances.
_MBio_ 3, e00261–11 (2012) Article CAS PubMed PubMed Central Google Scholar * Caporaso, J. G. et al. Global patterns of 16S rRNA diversity at a depth of millions of sequences per
sample. _Proc. Natl Acad. Sci. USA_ 108, 4516–4522 (2011) Article ADS CAS PubMed Google Scholar * Caporaso, J. G. et al. QIIME allows analysis of high-throughput community sequencing
data. _Nature Methods_ 7, 335–336 (2010) Article CAS PubMed PubMed Central Google Scholar * Edgar, R. C. Search and clustering orders of magnitude faster than BLAST. _Bioinformatics_
26, 2460–2461 (2010) Article CAS PubMed Google Scholar * McDonald, D. et al. An improved Greengenes taxonomy with explicit ranks for ecological and evolutionary analyses of bacteria and
archaea. _ISME J._ 6, 610–618 (2012) Article CAS PubMed Google Scholar * Segata, N. et al. Metagenomic biomarker discovery and explanation. _Genome Biol._ 12, R60 (2011) Article PubMed
PubMed Central Google Scholar * Miyoshi, H. & Stappenbeck, T. S. In vitro expansion and genetic modification of gastrointestinal stem cells in spheroid culture. _Nature Protocols_ 8,
2471–2482 (2013) Article CAS PubMed PubMed Central Google Scholar * Miyoshi, H., Ajima, R., Luo, C. T., Yamaguchi, T. P. & Stappenbeck, T. S. Wnt5a potentiates TGF-β signaling to
promote colonic crypt regeneration after tissue injury. _Science_ 338, 108–113 (2012) Article ADS CAS PubMed PubMed Central Google Scholar * Kang, S. S. et al. An antibiotic-responsive
mouse model of fulminant ulcerative colitis. _PLoS Med._ 5, e41 (2008) Article PubMed PubMed Central Google Scholar * Schneider, C. A., Rasband, W. S. & Eliceiri, K. W. NIH Image to
ImageJ: 25 years of image analysis. _Nature Methods_ 9, 671–675 (2012) Article CAS PubMed PubMed Central Google Scholar Download references ACKNOWLEDGEMENTS This work was supported by
National Institutes of Health (NIH) grants AI08488702 and DK7161907, the Crohn’s & Colitis Foundation of America Genetics Initiative, the Rainin Foundation, and the Helmsley Charitable
Trust. C.M. was supported by NIH training grant T32AI007163, and M.T.B. was supported by NIH training grant T32CA009547 and the W.M. Keck Fellowship from Washington University. We thank H.
Miyoshi for technical recommendations, D. Kreamalmeyer for animal care and breeding, and members of the Stappenbeck and Virgin laboratories for discussion. Experimental support was provided
by the Speed Congenics Facility of the Rheumatic Diseases Core Center (NIH award number P30AR048335) and the Digestive Disease Research Core Center (NIH award number P30DK052574) of
Washington University. The content is solely the responsibility of the authors and does not necessarily represent the official views of the National Institutes of Health. AUTHOR INFORMATION
Author notes * Clara Moon and Megan T. Baldridge: These authors contributed equally to this work. AUTHORS AND AFFILIATIONS * Department of Pathology and Immunology, Washington University
School of Medicine, St Louis, 63110, Missouri, USA Clara Moon, Megan T. Baldridge, Meghan A. Wallace, Carey-Ann D. Burnham, Herbert W. Virgin & Thaddeus S. Stappenbeck Authors * Clara
Moon View author publications You can also search for this author inPubMed Google Scholar * Megan T. Baldridge View author publications You can also search for this author inPubMed Google
Scholar * Meghan A. Wallace View author publications You can also search for this author inPubMed Google Scholar * Carey-Ann D. Burnham View author publications You can also search for this
author inPubMed Google Scholar * Herbert W. Virgin View author publications You can also search for this author inPubMed Google Scholar * Thaddeus S. Stappenbeck View author publications You
can also search for this author inPubMed Google Scholar CONTRIBUTIONS M.T.B. and C.M. designed the project, performed experiments, and wrote the paper. T.S.S. and H.W.V. assisted with
project design and writing the paper. C.D.B. and M.A.W. assisted with microbial characterization and project design. CORRESPONDING AUTHORS Correspondence to Herbert W. Virgin or Thaddeus S.
Stappenbeck. ETHICS DECLARATIONS COMPETING INTERESTS The authors declare no competing financial interests. EXTENDED DATA FIGURES AND TABLES EXTENDED DATA FIGURE 1 WT MICE WITHIN TWO
INDEPENDENT FACILITIES EXHIBIT BINARY FAECAL IGA LEVELS, AND THE IGA-LOW PHENOTYPE IS TRANSFERABLE BETWEEN THESE FACILITIES. A, Faecal IgA (normalized to faecal weight) from mice housed in
either facility 1 (_n_ = 28 IgA-high and _n_ = 22 IgA-low mice) or facility 2 (_n_ = 12 mice per group) was detected by anti-mouse IgA ELISA. B, C, WT IgA-high mice from one mouse facility
were transplanted with homogenized faecal material from WT IgA-high or IgA-low mice from the other mouse facility, and faecal IgA was measured 14 days later by anti-mouse IgA ELISA. B,
Facility 1 mice pre- (_n_ = 18 mice) and post-faecal transplantation with facility 2 faecal samples (_n_ = 8 post-IgA-high and _n_ = 10 post-IgA-low mice). C, Facility 2 mice pre- (_n_ = 10
mice) and post-faecal transplantation with facility 1 faecal samples (_n_ = 4 post-IgA-high and _n_ = 6 post-IgA-low mice). The dotted lines represent the limit of detection by ELISA. All
values are mean ± s.e.m. One-way ANOVA: A, _F_ = 44.59, _P_ < 0.0001; B, _F_ = 20.93, _P_ < 0.0001; C, _F_ = 12.92, _P_ = 0.0004. Means with different footnote symbols are
significantly different by Tukey’s multiple comparison test (_P_ < 0.5). EXTENDED DATA FIGURE 2 IGA-HIGH- AND IGA-LOW-ASSOCIATED MICROBES CAN BE STABLY PASSAGED THROUGH _PIGR_−/−
RECIPIENTS, AND ARE VERTICALLY TRANSMISSIBLE AFTER RECOLONIZATION. A, Schematic for repopulation of _pIgR__−/−_ microbiota with WT IgA-high/IgA-low samples, followed by faecal
transplantation (FT) of _pIgR__−/−_ IgA-high or IgA-low samples to WT IgA-high mice. B, Faecal IgA on day 44 depicted in A. Mann–Whitney _U_-test: _P_ = 0.0006, _n_ = 8 mice per group. C,
Experimental schematic of antibiotic treatment and transplant protocol for D and Fig. 1f, g. D, Faecal IgA of post-FT mice on day 30 pre-treated with metronidazole (Metro). One-way ANOVA:
_F_ = 6.525, _P_ = 0.0012, _n_ = 13 (pre-Metro), _n_ = 15 (post-Metro), _n_ = 8 (post-IgA-high FT), and _n_ = 5 (post-IgA-low FT). All values are mean ± s.e.m. E, IgA-low mice converted to
IgA-high from Fig. 1f were mated, and faecal IgA of their adult progeny was measured. One-way ANOVA: _F_ = 18.29, _P_ = 0.0002, _n_ = 2 breeders, _n_ = 10 progeny from four litters.
Different footnote symbols indicate groups significantly different by Tukey's multiple comparison test (_P_ < 0.5). Dotted lines: limit of detection. EXTENDED DATA FIGURE 3 DSS
EFFECTS ON _PIGR__−/−_ MICE ARE DEPENDENT ON IGA AND NOT MICROBES. A, Faecal IgA levels were measured in WT mice from Fig. 2d, e after VNAM treatment and IgA-high/IgA-low faecal
transplantation (FT), before the start of DSS treatment. Statistical analysis by Mann–Whitney _U_-test: _P_ = 0.0006, _n_ = 7 mice per group. B, Representative haematoxylin and eosin-stained
histological sections of WT and _pIgR__−/−_ mice from Fig. 2d, e after 14 day VNAM treatment + IgA-high/IgA-low faecal transplantation. Representative of _n_ = 3 (WT + IgA-high), _n_ = 6
(WT + IgA-low), _n_ = 8 (_pIgR__−/−_ + IgA-high), and _n_ = 10 (_pIgR__−/−_ + IgA-low) mice. All values indicated as mean ± s.e.m. Means with different footnote symbols are significantly
different by Tukey’s multiple comparison test (_P_ < 0.5). Dotted lines, limit of detection. EXTENDED DATA FIGURE 4 PLASMA CELL NUMBERS AND PIGR EXPRESSION ARE UNCHANGED IN THE ILEUM AND
COLON BETWEEN IGA-HIGH AND IGA-LOW MICE. A–D, Ileal and colonic sections from IgA-high and IgA-low mice were stained with anti-IgA (green) and bis-benzamide dye (blue); representative ×20
images are shown of _n_ = 10 (A–C) or _n_ = 9 mice (D). Scale bars, 100 μm. E, F, Quantification of ileal plasma cells per villus (E) and colonic plasma cells per ×20 field (area = 1.5 μm ×
105 μm) (F) based on IgA staining. All values are mean ± s.e.m. Statistical analysis by Mann–Whitney _U_-test: E, _P_ = 0.5191, _n_ = 10 mice per group; F, _P_ = 0.3117, _n_ = 10 IgA-high
and _n_ = 9 IgA-low mice. G–J, Ileal and colonic sections from IgA-high and IgA-low mice were stained with anti-pIgR/secretory component (red) and bis-benzamide dye (blue); representative
images are shown (_n_ = 10 mice per group). Scale bars, 100 μm. EXTENDED DATA FIGURE 5 16S RDNA SEQUENCING IDENTIFIES BIOMARKERS FOR IGA-LOW AND IGA-HIGH SAMPLES. A, B, LEfSe analysis31 of
16S rDNA sequencing of IgA-low and IgA-high faecal samples from facilities 1 and 2 identified statistically significant bacterial taxa biomarkers for (A) IgA-low and (B) IgA-high samples.
Biomarkers for facility 1 and biomarkers for facility 2 alone were identified by comparison of IgA-high and IgA-low samples within each facility. Biomarkers for facilities 1 and 2 were
identified by comparison of all IgA-high and IgA-low samples from both facilities. No IgA-high biomarkers were identified when comparing all IgA-high and IgA-low samples from both
facilities. Biomarkers for the indicated groups are plotted as taxonomic trees with GraPhlAn (http://huttenhower.sph.harvard.edu/graphlan); _n_ = 13 (facility 1 IgA-high), _n_ = 14 (facility
1 IgA-low), _n_ = 73 (facility 2 IgA-high), and _n_ = 68 (facility 2 IgA-low) samples. Statistical analysis is shown in Extended Data Table 1. EXTENDED DATA FIGURE 6 _SUTTERELLA_ IS MORE
ABUNDANT IN IGA-LOW SAMPLES THAN IGA-HIGH SAMPLES IN BOTH FACILITIES. A–C, Relative abundance of sequences assigned by QIIME to the bacterial genus _Sutterella_ from 16S rDNA analysis in (A)
facility 1 and (B) facility 2. These results are summarized in C. One-way ANOVA: _F_ = 12.85, _P_ < 0.0001. _n_ = 13 (facility 1 IgA-high), _n_ = 14 (facility 1 IgA-low), _n_ = 73
(facility 2 IgA-high), and _n_ = 68 (facility 2 IgA-low) samples. Values in C are indicated as mean ± s.e.m. Means with different footnote symbols are significantly different by Tukey’s
multiple comparison test (_P_ < 0.5). EXTENDED DATA FIGURE 7 IGA-LOW CULTURED BACTERIA CAN DEGRADE FREE SECRETORY COMPONENT IN THE ABSENCE OF IGA, AND SECRETORY-COMPONENT-DEGRADING
PROPERTIES OF THESE BACTERIA ARE ACTIVE AFTER FREEZE/THAW. Primary intestinal epithelial Transwell monolayers were pre-treated with 10 μM DAPT + 1 μg ml−1 LPS on days 1 and 2 post-seeding to
induce differentiation and pIgR expression. Some wells were left untreated as negative controls. On day 3 post-seeding, either 3 μg of normal mouse dimeric IgA or media alone was added to
the lower compartment of the Transwells. Different subsets of the DAPT + LPS-treated Transwells were also treated with one of the following conditions in the apical compartment:
IgA-high/IgA-low bacterial cultures (pelleted bacterial or supernatant fraction), live or freeze/thawed IgA-high/IgA-low bacterial cultures (pelleted bacterial fraction). Apical Transwell
supernatants were collected at 3 h and 6 h, and the amount of secretory component was measured by anti-secretory-component immunoblot. A, Representative anti-pIgR/secretory component and
anti-actin immunoblots of intestinal epithelial monolayers at 6 h (one of three experiments). B–D, Secretory component degradation in the absence of IgA. (B) Representative
anti-secretory-component immunoblot and quantification of undegraded secretory component (denoted by the red brackets) at 3 h (C) and 6 h (D) over four independent experiments by ImageJ.
E–G, Secretory component degradation by freeze/thawed bacterial cultures. E, Representative anti-secretory-component immunoblot and quantification of undegraded secretory component at 3 h
(F) and 6 h (G) over five independent experiments by ImageJ. All values are mean ± s.e.m. One-way ANOVA: C, _F_ = 1.834, _P_ = 0.1831, _n_ = 4 independent experiments with DAPT + LPS, no IgA
repeated twice; D, _F_ = 23.96, _P_ = 0.0002, _n_ = 4 independent experiments with DAPT + LPS, no IgA repeated twice; F, _F_ = 7.444, _P_ = 0.0045, _n_ = 5 independent experiments with
untreated and DAPT + LPS repeated three times; G, _F_ = 31.53, _P_ < 0.0001, _n_ = 5 independent experiments with untreated and DAPT + LPS repeated three times. Means with different
footnote symbols are significantly different by Tukey’s multiple comparison test (_P_ < 0.5). EXTENDED DATA FIGURE 8 IGA-LOW CULTURED BACTERIA CAN DEGRADE IGA. Primary intestinal
epithelial cell monolayers were pre-treated with 10 μM DAPT + 1 μg ml−1 LPS on days 1 and 2 post-seeding to induce differentiation and pIgR expression. Some wells were left untreated as
negative controls. On day 3 post-seeding, 3 μg of normal mouse IgA was added to the lower compartment of the Transwells. Different subsets of the DAPT + LPS-treated Transwells were also
treated with combinations of the following in the apical compartment: live IgA-low bacterial cultures (either the pelleted bacterial or supernatant fraction), freeze/thawed IgA-low bacterial
cultures, and a 1× protease inhibitor (PI) cocktail. Apical Transwell supernatants were collected at 3 h (A) and 6 h (B), and the amount of IgA was measured by anti-mouse IgA ELISA. The
dotted lines represent the limit of detection by ELISA. All values are mean ± s.e.m. One-way ANOVA: A, _F_ = 26.32, _P_ < 0.0001, _n_ = 8 (untreated), _n_ = 8 (DAPT + LPS), _n_ = 6
(IgA-low culture, pellet), _n_ = 3 (IgA-low culture, supernatant), _n_ = 4 (IgA-low culture, freeze/thawed), and _n_ = 4 (IgA-low culture, +PI); B, _F_ = 35.57, _P_ < 0.0001, _n_ = 8
(untreated), _n_ = 8 (DAPT + LPS), _n_ = 6 (IgA-low culture, pellet), _n_ = 3 (IgA-low culture, sup), _n_ = 3 (IgA-low culture, freeze/thawed), and _n_ = 4 (IgA-low culture, +PI). Means with
different footnote symbols are significantly different by Tukey’s multiple comparison test (_P_ < 0.5); ND, not detected. POWERPOINT SLIDES POWERPOINT SLIDE FOR FIG. 1 POWERPOINT SLIDE
FOR FIG. 2 POWERPOINT SLIDE FOR FIG. 3 POWERPOINT SLIDE FOR FIG. 4 RIGHTS AND PERMISSIONS Reprints and permissions ABOUT THIS ARTICLE CITE THIS ARTICLE Moon, C., Baldridge, M., Wallace, M.
_et al._ Vertically transmitted faecal IgA levels determine extra-chromosomal phenotypic variation. _Nature_ 521, 90–93 (2015). https://doi.org/10.1038/nature14139 Download citation *
Received: 18 June 2014 * Accepted: 03 December 2014 * Published: 16 February 2015 * Issue Date: 07 May 2015 * DOI: https://doi.org/10.1038/nature14139 SHARE THIS ARTICLE Anyone you share the
following link with will be able to read this content: Get shareable link Sorry, a shareable link is not currently available for this article. Copy to clipboard Provided by the Springer
Nature SharedIt content-sharing initiative