Play all audios:
ABSTRACT Wildlife and plant diseases can reduce biodiversity, disrupt ecosystem services and threaten human health. Emerging pathogens have displayed a variety of spatial spread patterns due
to differences in host ecology, including diffusive spread from an epicentre (West Nile virus), jump dispersal on a network (foot-and-mouth disease), or a combination of these (Sudden oak
death). White-nose syndrome is a highly pathogenic infectious disease of bats currently spreading across North America. Understanding how bat ecology influences this spread is crucial to
management of infected and vulnerable populations. Here we show that white-nose syndrome spread is not diffusive but rather mediated by patchily distributed habitat and large-scale gradients
in winter climate. Simulations predict rapid expansion and infection of most counties with caves in the contiguous United States by winter 2105–2106. Our findings show the unique pattern of
white-nose syndrome spread corresponds to ecological traits of the host and suggest hypotheses for transmission mechanisms acting at the local scale. You have full access to this article
via your institution. Download PDF SIMILAR CONTENT BEING VIEWED BY OTHERS PATHOGEN SPILLOVER DRIVEN BY RAPID CHANGES IN BAT ECOLOGY Article Open access 16 November 2022 CONTINUED PREFERENCE
FOR SUBOPTIMAL HABITAT REDUCES BAT SURVIVAL WITH WHITE-NOSE SYNDROME Article Open access 08 January 2021 EXPERIMENTAL INOCULATION TRIAL TO DETERMINE THE EFFECTS OF TEMPERATURE AND HUMIDITY
ON WHITE-NOSE SYNDROME IN HIBERNATING BATS Article Open access 19 January 2022 INTRODUCTION Wildlife and plant diseases can reduce biodiversity, disrupt ecosystem services and threaten human
health1,2,3. White-nose syndrome (WNS), a highly pathogenic infectious disease caused by the cryophilic fungus _Geomyces destructans_, has emerged in North American Vespertilionid bats, and
is currently spreading4,5,6,7 throughout the Eastern United States and Canada. WNS was first observed in 2006 in Schoharie County, NY, and within 2 years spread to 15 counties within a ∼230
km radius4. The speed of this spread, together with early reports of mass mortality in infected caves, has generated concern about massive depletion of currently common bat species,
attendant loss of economic services, and transmission to vulnerable populations of threatened and endangered species5,8,9,10. Although WNS has now been reported in 20 states and up to ∼2,220
km from its North American origin, the ecological and environmental determinants of these epidemiological dynamics are poorly understood. Understanding the mechanisms by which WNS will
expand is crucial to management of infected and vulnerable bat populations and the conservation of threatened and endangered bat species. Particularly important is determining where and how
fast WNS will spread. Historically, emerging pathogens have displayed a variety of spatial spread patterns due to differences in host ecology, including diffusive spread from an epicentre
(West Nile virus11), stratified diffusion (rabies virus12), jump dispersal on a network (foot-and-mouth disease virus13) or a combination of these (_Phytophthora ramorum_14). Diffusive
spread is expected for pathogens with highly mobile host species (for example, migratory passerines that transport West Nile virus), while jump dispersal is expected for patchily distributed
species with unequal time scales of within- and between-patch transmission (for example, livestock farms that mediated foot-and-mouth disease). Either of these patterns is consistent with
the natural history of bats: cave-dwelling bats exhibit long-distance aerial migration15 and high levels of seasonal mixing16,17, but bats in temperate North America are also associated with
patchily distributed geologic formations, particularly karst outcrops of the Appalachian range and Interior Plateaus and Highlands18. How WNS should be expected to spread is, therefore, an
open question. To determine which of these two scenarios predominates in the spatial spread of WNS, we used maximum likelihood (ML) estimation to fit a series of models to data on the
county-scale infection history of this epidemic. We started with a simple diffusion model and added complexity to create spatially structured networks and then complex heterogeneous networks
where patches differed in attributes. We hypothesized that: geographic complexity gives rise to corridors that facilitate spread along the dominant cave-bearing geologic formations, spread
is accelerated by high concentrations of caves, and spread is retarded in warmer areas due to the shorter duration of cold temperatures through direct and indirect influences on bat
condition and fungal growth. We tested these hypotheses through statistical comparison of alternative models where the probability that county _i_ does not become infected from previously
infected county _j_ had the general form: The function _f_ describes the inverse of transmission intensity from _j_ to _i_, numerically representing alternative hypotheses about the
determinants of transmission. To further examine possible scenarios, we fit additional models of moderate complexity, as well as an epidemiological model19 and a complex radiation model20.
The radiation model used the same general form as above, but the epidemiological model directly calculated . Simulations forward in time allowed us to compare spatial characteristics and
predict future scenarios of spread under assumptions of our best-supported model. We found the best fit model was of moderate complexity and included covariates regarding the number of
potential hibernacula and length of winter. Simulations forward in time based on this model suggest that spread to counties with caves will peak by 2015–2016 in the contiguous United States.
While climate change may negatively impact spread to uninfected counties according to interpretation of coefficients, applying the model to currently available projections of scenarios did
not slow spread or further restrict the geographic expansion. This study suggests that a variety of hibernating bat species are at risk and that populations across the contiguous United
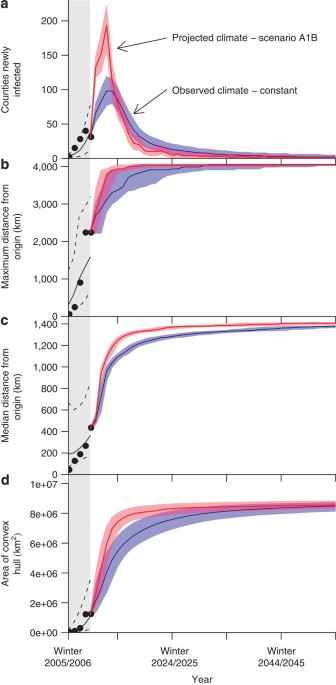
States eventually may be exposed. RESULTS OBSERVED CHARACTERISTICS OF SPREAD Inspection of summary statistics of observed data indicated that spread was variable over space and time in terms
of four metrics (number of counties newly infected, maximum distance of infected counties from the origin, median distance of infected counties from the origin, and area of the convex hull
of infected counties, Supplementary Table S1). Particularly, the highest number of new WNS infections and farthest spread occurred in the fourth epidemic winter and most newly infected
counties (89%) have been relatively close (<500 km) to older infections, suggesting extremely long distance dispersal events are rare (Supplementary Fig. S1). COMPARISON OF DISPERSAL
MODEL FITS Using parameters determined through ML estimation, predicted disease spread better matched observed data and was faster when diffusion models were restricted by geographic
complexity (that is, to counties with caves) as opposed to diffusion over all counties (Supplementary Fig. S2–S5, Supplementary Table S2). However, there was even greater support for models
that also accounted for heterogeneity in habitat and climate. A generalized gravity model, which included pairwise interactions among counties based on distance and density of caves in each
county (a proxy for the distribution of available hibernacula), had higher support (Akaike Information Criterion, AICgravity_caves=760; Table 1) than two diffusive spread models constrained
to counties with caves (AICsimple=794, AIClong-distance=774) and a similar model using county area as the gravitational mass variable (AICgravity_area=782); the additional term in gravity
models explained a significantly greater fraction of variation in the observed data than the simple diffusion model (Table 1, Supplementary Table S3). Adding winter length as an additional
covariate further improved the model fit (AICgravity_caves+winter=702). A comparison with an alternative model in which geographic position was substituted for winter length confirmed that
this effect is due to climate (AICgravity_caves+northing=728), not latitude. Bat species richness did not improve model fit over the gravitycaves+winter model
(AICgravity_caves+species-richness=730, AICgravity_caves+hibernating=740 AICgravity_caves+winter+species-richness=702). Likewise, the epidmeological and the radiation model categorically fit
less well than the gravitycaves+winter model (AICforce of infection=710, AICradiation=776) Simulations of the best-supported model (gravitycaves+winter) effectively captured each of the
measured spatial features of spread (Fig. 1). Empirical observations of our summary statistics were all within 95% prediction intervals generated by the simulations (Fig. 1). Further, the
year of known infection of specific counties was within 95% of simulations in 106 of 112 (94.6%) infected counties (Fig. 2). Parameters drawn to estimate sampling uncertainty (SU) yielded
similar mean values of all quantities with larger prediction intervals corresponding to the combined effects of stochastic variation and parameter uncertainty (Supplementary Figs S6, S7; 107
of 112 counties within confidence bounds). By contrast, under ML parameters, all other models underestimated the observed infection rate (number of new counties infected each winter),
although matches between area and distance measures for these models and observed data were typically satisfactory (Supplementary Figs S8–S13). Observed year of infection generally was
earlier than predicted and outside prediction intervals for the simple diffusion and simple diffusion with long-distance dispersal models, and while gravitycaves and gravitycaves+northing
models performed better than diffusion models, they did not outperform the gravitycaves+winter model (Supplementary Figs S2–S5, S14, S15). Simulations using SU parameters were consistent
with these observations (Supplementary Figs S16–S27). In conclusion, we found the gravitycaves+winter model to be the best fit overall (lowest AIC) and the only model consistent with
large-scale measurements of spread. ASSESSMENT OF ASSUMPTIONS AND SIMULATIONS FORWARD We tested our assumption that infection of a county was detected in its first year with further
simulations. Our estimates were robust to incomplete detection, as even under high levels of missed infections (25% of infected counties go undetected) the resulting bias was minimal
(Supplementary Fig. S28). Imperfect detection introduced no detectable bias into most measures of spread, although high rates of under-detection occasionally resulted in slight deviations
from zero for the area of the convex hull and the median distance from the origin (Supplementary Fig. S28). With high levels of under-detection we found some statistically significant
under-predictions of the number of new counties infected, but the magnitude of the bias was small. These results showed this slight underestimate will take place for the filling in of
infected counties in the interior of the infected area, but not for the broader extent of the infection. The results of the under-sampled simulation demonstrate a similar pattern of spread
to the observed data and the predicted year of infection is consistent for counties (Supplementary Figs S29, S30). Specifically, under-detection led to more rapid spread into the West by no
>5 years, but reduced spread was predicted into the Southeast and Southwest. For spread continuing under constraints of these initial 5 years, the gravitycaves+winter model predicted the
number of newly infected counties that contain caves will peak in the winter of 2013–2014 (95% prediction interval of 2013–2014 to 2014–2015). These projections suggest WNS will extend the
maximum distance from the origin by 2032–2033 and will continue to fill in over the next 73 years, such that 93% (±1%) of counties with caves will be infected by the winter of 2105–2106
(Supplementary Table S4). The predicted trajectory of spread is WNS will reach the Rocky Mountains in the next 5 years before moving more slowly to the west coast (Fig. 3), whereas areas of
high conservation concern in the Southeast and Texas are not predicted to become infected until much later. Indeed, many of these counties and those in the Southwest went uninfected for
>100 years in several simulations (Supplementary Fig. S16). Simulations using SU parameter sets were consistent with these results (Supplementary Figs S31–S33, Supplementary Table S5). In
addition, we considered possible effects of projected climate change by using available simulations of future daily temperature. As North American winters have been relatively warm
recently, these simulations predicted slightly faster spread of WNS despite the expected increase in temperature overall (Fig. 1, Supplementary Figs S34, S35, Supplementary Table S6).
However, the overall geographic characteristics of spread were consistent with the observed winter data used to fit the model, despite differences in speed (Supplementary Figs S36–S41).
DISCUSSION WNS has spread from a single New York county north to Maine, south to Alabama and west to Oklahoma. Simple diffusive models are not as well supported by data from the initial 5
years of WNS spread as models that include spatial heterogeneity and a key environmental covariate, winter duration. Particularly, because a larger distance between two counties decreased
the probability of infection (that is, parameter β1 was positive for all fit models), the presence of geographic corridors due to the spatial pattern of counties with caves accelerated
spread of WNS. Further, in generalized gravity models, the parameter β2 was always positive indicating that the probability of infection increased with increasing number of caves in each
county (Table 1). This suggests that density-dependent transmission at higher bat population densities may facilitate spread by increasing contact rate, possibly during swarming.
Furthermore, a county-level climate variable, length of winter, was an important predictor and the related parameter, β3, was always negative indicating increased transmission probability to
colder counties (Table 1). This pattern may reflect the fungus’s physiological tolerances or increased bat survival in longer summers. This result is consistent with the conclusion that WNS
mortality is predictable under certain environmental conditions within Appalachia21. There has been a great deal of interest in the effect of species diversity on spread of multi-host
pathogens. Inclusion of species richness improved performance when added to the basic gravitycaves model, and the positive coefficient might be interpreted to suggest that higher values of
species richness retard the spread of WNS. However, this model is equally well supported as the gravitycaves+northing model, possibly reflecting the latitudinal gradient of species richness
along the eastern seaboard. Further, substituting the complete bat species richness covariate with only those bats that hibernate did not improve fit to the observed data. Ultimately,
species richness did not provide additional information when included with the winter covariate in a gravity model. Future studies seeking to elucidate the role of species richness in _G.
destructans_ transmission should include information about the specific regions or locations where hibernation occurs, that is, the spatial scales at which species ecological interactions
may occur. Thus, overall, our model suggests that the pattern of WNS spread results from a combination of both spatially diffusive mechanisms (that is, migratory events and movement between
hibernacula) and spread on a network (that is, clustering of habitats), and that there exist within- and between-region interactions that facilitate pathogen expansion. Empirical data
support this conclusion as small-scale features of habitat, species occurrence and species traits can mediate the appearance within hibernacula22. Our modelling framework cannot account
explicitly for these factors, but does not discount such factors as important mechanisms of spread. Forward simulations initialized with an infection in Schoharie County, New York captured
many features of spread observed in data, but were unable to correctly predict year of infection within quartiles for some counties, consistent with other simulation studies23. Our goal in
this study was to compare simple diffusive and geographically complex spread models that captured the characteristics of WNS expansion; the observed pattern of occurrence is one potential
realization of the spread dynamics and stochastic processes make predictions for individual counties challenging and possibly ineffectual. Counties that were regularly under-predicted were
those in Oklahoma and Missouri, which we consider to be possibly anomalous. Particularly, the occurrence in Oklahoma represents a single live bat that tested positive for the pathogen and
the pattern of infection differed from bats from the East Coast24. We also note that bats readily use anthropogenic features25 that also can be suitable habitat for _G_. _destructans_, which
would facilitate spread and thus bias our predictions where our proxy for available habitat (cave density) is incomplete. However, recent analysis of WNS spread in the northeastern US
suggests that mines are less likely to become infected than caves26, suggesting that this bias may not be as great as one might fear. Thus, counties without caves but with mines may incur
infection, but that the effect of these infections on spread will probably be small. By simulating the effect of imperfect detection on model evaluation, we found that high levels of
under-detection did not substantially bias summary statistics. Furthermore, it is likely that detection following the first 2 years was very high given the profile of the disease. As we
considered data at the county-level using a compartmental model, not the level of the individual cave, we reduced the chance that we missed a critical data point while simultaneously
removing potential issues of prevalence and within-county dynamics. Accordingly, we found our results to be very robust to probable levels of under-detection. It has been reported that the
management of other emerging diseases would have benefited from earlier predictions of spread27. Our study sought to examine how the epidemic will progress under the constraints and
assumptions of the gravitycaves+winter model using ML and SU parameter sets by extrapolating from the state of infection as of 1 June 2011. These simulations provide both general properties
of anticipated spread (that is, approximate time frame for invasion of biologically sensitive areas), and specific estimates (with prediction intervals) for all counties in the contiguous
United States. Short-term predictions (that is, those within 10 years) are both most reliable and relevant to actions that might be taken immediately; long-term predictions (that is, those
well into the future) are less certain due to demographic stochasticity and potential population collapse9,10, as well as uncertainty about future climate conditions28 and future control
measures. Our choice in simulation duration (to 2105 under stable climate and 2100 for climate change scenarios) reflects the temporal extent of available climate change forecasts, not
necessarily considerations about _a priori_ expectations of the progression of WNS epidemic. Additionally, because these predictions assume that regionally different host communities do not
differentially affect spread, future spread may be different than predicted in proportion to inhomogeneity in host communities and/or the extent that resistance to infection is evolved22,29.
What will happen next? Our forward simulations from the observed distribution of WNS under ML parameters predicted that infection rate of new counties will peak in the winter of 2013–2014
(+1 winter) and that WNS will reach the maximum distance from Schoharie County in the winter of 2032–2033. Under the assumption that the first 5 years of spread are indicative of the future
pattern, our models predicted spread will continue rapidly along and within the Appalachians, filling in counties that were jumped over until reaching the southeast. As a result, potentially
susceptible species such as the Indiana Bat (_Myotis sodalis_) and Gray Bat (_M. grisescens_) will be of concern due to their already endangered status. Spread will be slow into the western
United States, although detection in Colorado may occur as soon as 2013–2014. This reduced spread in the projection is likely a trade-off between the number of caves and the length of
winter (Fig. 3). Species that have large geographic ranges, such as the Little Brown Bat (_M. lucifigus_), may see large population declines or extirpation at large scales9. Speculatively,
species richness across the contiguous United States may be reduced and community structure will shift in favour of non-cave hibernating bats30,31. Predictions of spread using three climate
change scenarios showed accelerated spread of WNS relative to projections based on observed data, with two caveats. First, the coarse resolution reduces the climatic variability that is
consistent with mountainous regions, which coincide with the distribution of caves. Thus the projected spread rates in some regions may be reduced or accelerated by climate change in ways
hard to capture with climate projections. Second, the projections had many more long winters than the observed data set, which could be due to specifics of the climate model and year-to-year
variability in climate projections (Supplementary Figs S42–44). As temperature appears to have a significant effect on WNS spread, actual climate, especially the amount of cold weather in
the immediate future, has the potential to significantly alter rate of spread and locations infected. A potentially important puzzle piece missing from this analysis is spread within Canada.
Absence of Canadian cave data (needed to estimate the cave density covariate) precluded incorporating any such infection records into our models. We suspect including such information would
have decreased the estimated time to infection in Northeast counties and in the Upper Midwest, but would have had little impact on the spread into the Interior Plateaus and Highlands. It is
possible that Canada could provide another route for long-distance dispersal events to reach the West. However, Canadian winters may prove to act as a barrier to dispersal because of
increased mortality of bats associated with longer winters, thus limiting the number of potential dispersers. Our model is the first of which we are aware to fit WNS occurrence data to broad
geographic features and identify key characteristics of spread throughout the United States. An important area for further development is construction of models representing the biological
mechanisms that mediate dispersal and spread32. Unfortunately, key quantities such as bat-to-bat transmission probability, recovery rate, frequency of recovery, lethality and between-cave
mixing at hibernacula remain unknown to us. Recent experimental evidence7 shows that direct contact can spread the fungus from infected to uninfected bats during hibernation and that
airborne exposure within artificial hibernacula does not lead to infections in susceptible individuals. Remarkably, without such a mechanistic understanding of spread, our best model matched
all investigated aspects of the spatial dynamics of the epidemic, including maximum distance and number of counties infected. Although diffusive spread may occur at small scales26, our
results show that this spread process does not scale to larger spatial extents. Our results also support an important mechanistic hypothesis: because of the relative importance of cave
density in our models, we hypothesize that transmission is density-dependent at the spatial scale of infection between caves. A cave-scale proportional hazard analysis found larger colonies
were more likely to have become infected, but could not distinguish between the effect of population density and the alternative that perhaps habitats preferred by bats are also more
suitable for the fungus26. Lorch _et al._7 speculate that swarming behaviour is a likely mechanism for spread, whereby transmission between bats occurs during these fall periods of activity.
As our model uses discrete time steps, it is consistent with a variety of transmission modes including the swarming hypothesis. Lorch _et al._7 provide evidence that direct exposure to
conidia leads to infection within 102 days, but bat-to-bat experiments used infected bats already presenting fungal growth. It is unclear, then, if autumn swarming is indeed the dominant
mechanism of transmission, as other evidence shows infection clears during the summer33,34 and that the percentage of infected bats during autumn is very low7. We also can speculate on the
effect of winter in the best-supported model. Winter length may increase transmission due to increased conidia density on surviving bats or in caves. Alternatively, longer summers may slow
spread, perhaps due to increased survivorship or reduced time for the syndrome to manifest as found in infected individuals that have recovered in laboratory34 and field settings33. More
mechanistic models of spread, such as Susceptible-Infected-Recovered models of transmission among individual bats, could determine the importance of these effects5,32 and others, such as the
postulated effect of cave microclimate (humidity) on bat infection and mortality22,26. Unfortunately, data are currently too sparse to effectively estimate relevant parameters for
transmission at the spatial extents considered here. Collection of individual incidence is, therefore, a priority for future empirical work35. Our model provides evidence for a non-diffusive
spread pattern of WNS, where physical geography and environmental heterogeneity have a role in the speed and direction of spread. For other recent notable pathogens, both introduced and
emergent, host ecology influences the characteristics of spread, and the combination of ecological traits exhibited by bats matches the unique mixture of heterogeneous and locally diffusive
spread found here. Simulations forward suggest that spread will slow in the near future, but it will eventually reach most of the contiguous United States. Bat diversity and community
structure will be affected across all of North America if the spread along the Appalachians is representative of future spread. Vespertilionid bats could be in critical danger if resistance,
whether through an anthropogenic source or through evolution, does not soon emerge9,10,36. METHODS DATA Time of infection by county was obtained from ref. 37 (ver. 1 June 2011), which
records the first year of observation of WNS, presence of infectious agent _G_. _destructans_, or both. A literature search was performed to identify the number of independent infection
events (that is, number of infected caves) in each county, which we refer to as ‘WNS occurrence records.’ As amplification and transmission can occur during hibernation5,7, we assigned
infections to the year of first observed infection in a county where epidemic year _t_ was assumed to begin in May_t−1_ and end in April_t_. A variable for habitat was a composite of known
and estimated cave density for counties in the contiguous United States, which we consider to be a suitable proxy for the distribution of natural and anthropogenic features used by bats and
suitable for _G_. _destructans_ (Supplementary Information, Supplementary Figs S45,S46). Average length of winter during the epidemic was estimated using the average number of days below 10
°C per year between January 2006 and December 2009, and interpolated using anisotropic ordinary kriging (Supplementary Information, Supplementary Figs S47,S48). Species richness was
estimated by overlaying 46 bat species range maps acquired from NatureServe ( http://www.natureserve.com) and aggregating them by county (Supplementary Information, Supplementary Figs
S49,S50). Minimum daily temperature records from three climate change scenarios ( http://nomads.gfdl.noaa.gov/CM2.X/CM2.0/available_data.html) were obtained and the length of winter was
calculated for years through 2100 (Supplementary Information). MODEL Our model follows a compartmental strategy, similar to epidemiological Susceptible-Infected-Recovered models, where
within-county prevalence and its potential role in spread to another county are modelled implicitly. This framework permits hypothesis testing to statistically reject potential models of
spread without making assumptions regarding mechanisms determining within-county dynamics. Thus, our goal was to characterize broad geographic features that have a role in spread rather than
to determine mechanisms that mediate local transmission. Our simplest hypothesis of diffusive spread without geographic complexity was investigated by fitting a model where the probability
of infection between all candidate sources _j_ and susceptible counties _i_ declined with Euclidean distance between the centroids of _i_ and _j_ in an Albers equal-area projected data set
of the contiguous United States through a logistic function (Supplementary Equation S1). This model represents the belief that new infections are more probable in susceptible counties near
infected counties. This model was modified to test for distance-decay with additional long-distance dispersal by adding a fitted parameter as an exponent of the distance between counties
(Supplementary Equation S8). We fit parameters of these models using all counties in the contiguous United States, followed by fitting them to a restricted number of counties defined by the
presence of caves (see above). If our proxy for available hibernacula (that is, cave density) was irrelevant, then we would expect that model to fit the data equivalently or more poorly than
the complete county data set. To test the hypotheses that spread was accelerated by high concentrations of caves, we fit a model that included a generalized ‘gravity’ term38,39, where the
connection between counties _i_ and _j_ was weighted by the area of the county or density of caves in each (Supplementary Equations S15, S20). This model is a generalized version of the
standard gravity model in that strength of the connection was tuned by a fit parameter. This model was compared with diffusion on the restricted county network. We then tested for an effect
of bat species richness by adding a term to the gravitycave model (Supplementary Equation S21). Further, we tested for an effect of the number of hibernating bat species that may occur in a
county during the year (Supplementary Equation S22). To test the hypothesis that spread was retarded in warmer areas, we included winter duration (estimated number of days where minimum
temperature was <10 °C) as a covariate (Supplementary Equation S23). As climate is partially confounded with geographic position, we compared this model to one with a north–south
latitudinal gradient by using the northing of the geographically projected county centroid as a covariate (Supplementary Equation S24). A better fit with Supplementary Equation S23 than with
Supplementary Equation S24 would indicate that temperature was the important variable, not another latitudinally varying quantity. As we found support for species richness and winter terms
separately, we included both terms in a gravity model to test for improved fit (Supplementary Equation S25). To allow for other forms of spread, we fit two additional dispersal kernels.
First we fit a model based on Eggo _et al._19 where we modified the expression by removing a mortality term (Supplementary Equation S26). The final approach was a variation on the radiation
model of Simini _et al._20 in which the relationship between the cave density in two counties is weighted by the relative local population, designated as the cave density of those counties
within a radius defined by the distance between the two counties (Supplementary Equation S27). Changes in event probability and probability of spread associated with select models are shown
in Supplementary Figs S51–53. For each model, we created a network where each county was a node with a binary state variable representing the infected/uninfected status and edges weighted by
the requisite dispersal function. ML parameters for each model were obtained using the Nelder-Mead algorithm and corroborated using a Simulated Annealing search (function optim in the R
package stats40, Supplementary Information). We found confidence intervals for our ML parameters using qmvnorm (package: mvtnorm41) and numDeriv42, unless covariance matrices were not
invertible (Supplementary Information). For a given year of spread, _t_+1, the probability that a given county became infected from infected counties in _t_ for the given model and parameter
set was calculated for each county. The log-likelihood of the data given the model was log-transformed binomial probability densities summed over all susceptible counties in _t_. The sum of
log-likelihoods for each year of spread was multiplied by −1 to determine the negative log-likelihood (NLL) value for that parameter set. We compared AIC and NLL values of optimized models
for model comparison. We calculated pairwise deviance explained to determine the amount of variation explained by additional parameters. To compare spatial characteristics of select model
and observed data, stochastic spread was simulated from Schoharie County (time _t_0) for 100 years (Supplementary Information). We repeated simulations 9,999 times and assessed county
infection rate, maximum and median spread distance from Schoharie County, and area of infection. The frequency of infection and expected year of infection for each county was calculated from
the full sequence of 100 winters. As this procedure ignores estimation error and misrepresents the total uncertainty associated with individual predictions, a secondary analysis was
performed to propagate error due to parameter uncertainty in these models. In this analysis, 9,999 random parameter sets were obtained in proportion to the multivariate normal distribution
associated with the variance-covariance matrix of the estimated parameters using the R package mvtnorm and propagated using Monte Carlo simulation (SU parameters). We then simulated spread
from Schoharie County using each of 9,999 combinations of SU parameters once to assess the breadth of uncertainty in our estimated measurements. Additional simulations projected future
spread from current conditions (the cumulative WNS observations as of 1 June 2011). We completed 9,999 simulations from the current observed infections and projected forward 95 winters
(until 2105–2106) for both the ML and SU parameter sets. We calculated the same spread statistics as above, and examined how quickly WNS spread to regions of the country by calculating time
until infection reached the maximum range of the county network, but before filling in led to saturation. Similarly, spread was simulated forward under the gravitycaves+winter model using
the changing winter length from the three climate change scenarios starting with 2011. IMPERFECT DETECTION The preceding analyses assumed that no infected counties have gone undetected. To
assess the effect of possible incomplete detection in the infection history data we simulated under-sampling using artificial data and compared results with the true (simulated) scenario
without under-sampling. Infection histories were generated by simulating an ensemble of 1,000 epidemics for 5 years starting from the initial infection with the gravitycaves+winter model
using the ML parameter set. These infection histories constitute the true data, and from them we sampled four reduced ensembles by randomly removing 1, 5, 10, and 25% of infection records in
each data set. For each of the four under-sampled ensembles we estimated the ML parameters over each infection history. This resulted in four under-sampled ensembles of 1,000 sets of model
parameters, and we used each of these parameter sets to simulate an epidemic for 5 years starting from Schoharie County. For each of the four under-sampled ensembles and the one true
ensemble we calculated the same spread statistics in our initial analysis. The effect of under-sampling was assessed by examining the medians and variability of the pairwise differences
between the under-sampled and true spread statistics (Supplementary Fig. S28). We simulated spread for 100 years with the observed climate data under the gravitycaves+winter model using the
25% under-sampled data to assess the change in geographic pattern of prediction. ADDITIONAL INFORMATION HOW TO CITE THIS ARTICLE: Maher, S. P. _et al._ Spread of WNS on a network regulated
by geography and climate. _Nat. Commun._ 3:1306 doi: 10.1038/ncomms2301 (2012). REFERENCES * Daszak P., Cunningham A. A. & Hyatt A. D. Emerging infectious diseases of wildlife—threats to
biodiversity and human health. _Science_ 287, 443–449 (2000). Article CAS ADS Google Scholar * Garnas J. R., Ayres M. P., Liebhold A. M. & Evans C. Subcontinental impacts of an
invasive tree disease on forest structure and dynamics. _J. Ecol._ 99, 532–541 (2011). Google Scholar * Keesing F. et al. Impacts of biodiversity on the emergence and transmission of
infectious diseases. _Nature_ 468, 647–652 (2010). Article CAS ADS Google Scholar * Blehert D. S. et al. Bat White-nose Syndrome: an emerging fungal pathogen? _Science_ 323, 227 (2009).
Article CAS Google Scholar * Foley J., Clifford D., Castle K., Cryan P. & Ostfeld R. S. Investigating and managing the rapid emergence of White-nose Syndrome, a novel, fatal,
infectious disease of hibernating bats. _Conserv. Biol._ 25, 223–231 (2011). PubMed Google Scholar * Gargas A., Trest M. T., Christensen M., Volk T. J. & Blehert D. S. _Geomyces
destructans_ sp. nov. associated with bat White-nose Syndrome. _Mycotaxon_ 108, 147–154 (2009). Article Google Scholar * Lorch J. M. et al. Experimental infection of bats with _Geomyces
destructans_ causes white-nose syndrome. _Nature_ 480, 376–378 (2011). Article CAS ADS Google Scholar * Boyles J. G., Cryan P. M., McCracken G. F. & Kunz T. H. Economic importance of
bats in agriculture. _Science_ 332, 41–42 (2011). Article ADS Google Scholar * Frick W. F. et al. An emerging disease causes regional population collapse of a common North American bat
species. _Science_ 329, 679–682 (2010). Article CAS ADS Google Scholar * Thogmartin W. E., King R. A., McKann P. C., Szymanski J. A. & Pruitt L. Population-level impact of white-nose
syndrome on the endangered Indiana bat. _J. Mamm._ 93, 1086–1098 (2012). Article Google Scholar * Ladeau S. L., Marra P. P., Kilpatrick A. M. & Calder C. A. West Nile Virus revisited:
consequences for North American ecology. _BioScience_ 58, 937–946 (2008). Article Google Scholar * Smith D. L., Lucey B., Waller L. A., Childs J. E. & Real L. A. Predicting the
spatial dynamics of rabies epidemics on heterogeneous landscapes. _Proc. Natl Acad. Sci. USA_ 99, 3668–3672 (2002). Article CAS ADS Google Scholar * Keeling M. J. et al. Dynamics of the
2001 UK foot and mouth epidemic: stochastic dispersal in a heterogeneous landscape. _Science_ 294, 813–817 (2001). Article CAS ADS Google Scholar * Meentemeyer R. K. et al.
Epidemiological modeling of invasion in heterogeneous landscapes: spread of sudden oak death in California (1990–2030). _Ecosphere_ 2, art17 (2011). Article Google Scholar * Fleming T. H.
& Eby P. Ecology of bat migration. in _Bat Ecology_ eds Kunz T. H., Fenton M. B. (Univ of Chicago Press 2003). * Black H. L. A north temperate bat community: structure and prey
populations. _J. Mamm._ 55, 138–157 (1974). Article Google Scholar * Kurta A. & Murray S. W. Philopatry and migration of banded Indiana Bats (_Myotis sodalis_) and effects of radio
transmitters. _J. Mamm._ 83, 585–589 (2002). Article Google Scholar * Humphrey S. R. Nursery roosts and community diversity of Nearctic bats. _J. Mamm._ 56, 321–346 (1975). Article Google
Scholar * Eggo R. M., Cauchemez S. & Ferguson N. M. Spatial dynamics of the 1918 influenca pandemic in England, Wales and the United States. _J. Roy. Soc. Interface_ 8, 233–243 (2011).
Article Google Scholar * Simini F., González M. C., Maritan A. & Barabási A. A universal model for mobility and migration patterns. _Nature_ 484, 96–100 (2012). Article CAS ADS
Google Scholar * Flory A. R., Kumar S., Stohlgren T. J. & Cryan P. M. Environmental conditions associated with bat white-nose syndrome mortality in the north-eastern United States. _J.
App. Ecol._ 49, 680–689 (2012). Google Scholar * Langwig K. E. et al. Sociality, density-dependence and microclimates determine the persistence of populations suffering from a novel fungal
disease, white-nose syndrome. _Ecol. Lett._ 15, 1050–1057 (2012). Article Google Scholar * Fitzpatrick M. C., Presser E. L., Porter A., Elinton J. & Ellison A. M. Modeling range
dynamics in heterogeneous landscapes: invasion of the hemlock woolly adelgid in eastern North America. _Ecol. Appl._ 22, 472–486 (2012). Article Google Scholar * USFWS. Bat fungus
documented in Oklahoma. Press Release (21 May, 2010). * Kunz T. H. _Ecology of Bats_ Plenum Publishing Corporation (1982). * Wilder A. P., Frick W. F., Langwig K. E. & Kunz T. H. Risk
factors associated with mortality from white-nose syndrome among hibernating bat colonies. _Biol. Lett._ 7, 950–953 (2011). Article Google Scholar * McCallum H. Tasmanian devil facial
tumour disease: lessons for conservation biology. _Trends Ecol. Evol._ 23, 631–637 (2008). Article Google Scholar * Intergovernmental Panel on Climate Change (IPCC), Climate Change 2007:
The Scientific Basis. Contribution of Working Group I to the Fourth Assessment Report of the Intergovernmental Panel on Climate Change. ed Solomon S. Cambridge Univ. Press (2007). * Dobony
C. A. et al. Little brown myotis persist despite exposure to white-nose syndrome. _J. Fish & Wild Manag._ 2, 190–195 (2011). Article Google Scholar * Brooks R. T. Declines in summer
bat activity in central New England 4 years following the initial detection of white-nose syndrome. _Biodivers Conserv._ 20, 2537–2541 (2011). Article Google Scholar * Dzal Y., McGuire L.
P., Veselka N. & Fenton M. B. Going, going, gone: the impact of white-nose syndrome on the summer activity of the little brown bat (_Myotis lucifugus_). _Biol. Lett._ 7, 392–394 (2011).
Article Google Scholar * Hallam T. G. & McCracken G. F. Management of the panzootic White-nose Syndrome through culling of bats. _Conserv. Biol._ 25, 189–194 (2011). Article Google
Scholar * Fuller N. W. et al. Free-ranging little brown myotis (_Myotis lucifugus_) heal from wing damage associated with White-nose Syndrome. _EcoHealth_ 8, 154–162 (2011). Article Google
Scholar * Meteyer C. U. et al. Recovery of little brown bats (_Myotis lucifigus_) from natural infection with _Geomyces destructans_, White-nose Syndrome. _J. Wildlife Dis._ 47, 618–626
(2011). Article Google Scholar * Griggs A., Keel M. K., Castle K. & Wong D. Enhanced surveillance for white-nose syndrome in bats. _Emer. Infect. Dis._ 18, 530–532 (2012). Article
Google Scholar * Warnecke L. et al. Innoculation of bats with European _Geomyces destructans_ supports the novel pathogen hypothesis for origin of white-nose syndrome. _Proc. Natl Acad.
Sci. USA_ 109, 6999–7003 (2012). Article CAS ADS Google Scholar * USFWS. White-Nose Syndrome. http://www.fws.gov/whitenosesyndrome/maps.html (2011). * Thomas R. W. & Hugget R. J.
_Modeling in Geography_ Barnes & Noble Books (1980). * Sklar F. H., Costanza R. The development of dynamic spatial models for landscape ecology: a review and prognosis. in _Quantitative
Methods in Landscape Ecology: The Analysis and Interpretation of Landscape Heterogeneity_ eds Turner M. G., Gardner R. H. 239–288 (1991). * R Development Core Team. _R: A Language and
Environment for Statistical Computing_ R Foundation for Statistical Computing (2011). * Genz A. et al. mvtnorm: multivariate normal and t distributions. R package version 0.9-95
http://CRAN.R-project.org/package=mvtnorm (2010). * Gilbert P. numDeriv: accurate numerical derivatives. R package version 2010.11-1 http://CRAN.R-project.org/package=numDeriv (2011).
Download references ACKNOWLEDGEMENTS We thank D. Culver for cave density data. K. Morris, A. Silletti, R. Hall, A. Park, J.P. Schmidt, K. Pacifici, B. Han, D. Streicker, S. O’Regan, B.
Fenton, and the Beissinger Lab provided helpful feedback. AUTHOR INFORMATION Author notes * Sean P. Maher Present address: Present address: Museum of Vertebrate Zoology, University of
California, Berkeley, California 94720, USA, * Heather D. Barton Present address: Present address: Department of Biology, Grove City College, Grove City, Pennsylvania 16127, USA, * Krisztian
Magori Present address: Present address: School of Forestry and Wildlife Sciences Auburn University, Auburn, Alabama 36849, USA, AUTHORS AND AFFILIATIONS * Odum School of Ecology,
University of Georgia, 140 E. Green Street, Athens, 30602-2202, Georgia, USA Sean P. Maher, Andrew M. Kramer, J. Tomlin Pulliam, Marcus A. Zokan, Sarah E. Bowden, Heather D. Barton,
Krisztian Magori & John M. Drake Authors * Sean P. Maher View author publications You can also search for this author inPubMed Google Scholar * Andrew M. Kramer View author publications
You can also search for this author inPubMed Google Scholar * J. Tomlin Pulliam View author publications You can also search for this author inPubMed Google Scholar * Marcus A. Zokan View
author publications You can also search for this author inPubMed Google Scholar * Sarah E. Bowden View author publications You can also search for this author inPubMed Google Scholar *
Heather D. Barton View author publications You can also search for this author inPubMed Google Scholar * Krisztian Magori View author publications You can also search for this author
inPubMed Google Scholar * John M. Drake View author publications You can also search for this author inPubMed Google Scholar CONTRIBUTIONS S.P.M., A.M.K., M.A.Z., S.E.B., H.D.B., K.M. and
J.M.D.: conceived the project. S.P.M., A.M.K., J.T.P., M.A.Z., K.M., and J.M.D.: developed models. M.A.Z.: compiled cave data and S.E.B.: compiled the length of winter data set. S.P.M.,
A.M.K. and J.T.P. wrote code and executed simulations and data analysis. S.P.M., A.M.K., J.T.P. and J.M.D. wrote the manuscript. All authors discussed the results and commented on the
manuscript. CORRESPONDING AUTHOR Correspondence to Sean P. Maher. ETHICS DECLARATIONS COMPETING INTERESTS The authors declare no competing financial interests. SUPPLEMENTARY INFORMATION
SUPPLEMENTARY INFORMATION Supplementary Figures S1-S53, Supplementary Tables S1-S6, Supplementary Methods and Supplementary References. (PDF 8702 kb) RIGHTS AND PERMISSIONS Reprints and
permissions ABOUT THIS ARTICLE CITE THIS ARTICLE Maher, S., Kramer, A., Pulliam, J. _et al._ Spread of white-nose syndrome on a network regulated by geography and climate. _Nat Commun_ 3,
1306 (2012). https://doi.org/10.1038/ncomms2301 Download citation * Received: 19 March 2012 * Accepted: 15 November 2012 * Published: 18 December 2012 * DOI:
https://doi.org/10.1038/ncomms2301 SHARE THIS ARTICLE Anyone you share the following link with will be able to read this content: Get shareable link Sorry, a shareable link is not currently
available for this article. Copy to clipboard Provided by the Springer Nature SharedIt content-sharing initiative