Play all audios:
Adiposity is a known risk factor for certain cancers; however, it is not clear whether the risk of cancer differs between individuals with high adiposity but different metabolic health
status. The aim of this systematic literature review and meta-analysis of cohort studies was to evaluate associations between metabolic obesity phenotypes and overall and site-specific
cancer risk.
PubMed and Embase databases were used to identify relevant cohort studies up to the 6th of June 2023. Random-effects models were used to estimate summary relative risks (SRRs) and 95%
confidence intervals (CIs) for the association between metabolic obesity phenotypes and cancer risk. Certainty of evidence was assessed using the Cochrane methods and the GRADE tool. This
study is registered with PROSPERO, number CRD42024549511.
A total of 15,556 records were screened, and 31 publications covering 15 unique cohort studies were included in this analysis. Of these studies, 22 were evaluated as being at low risk of
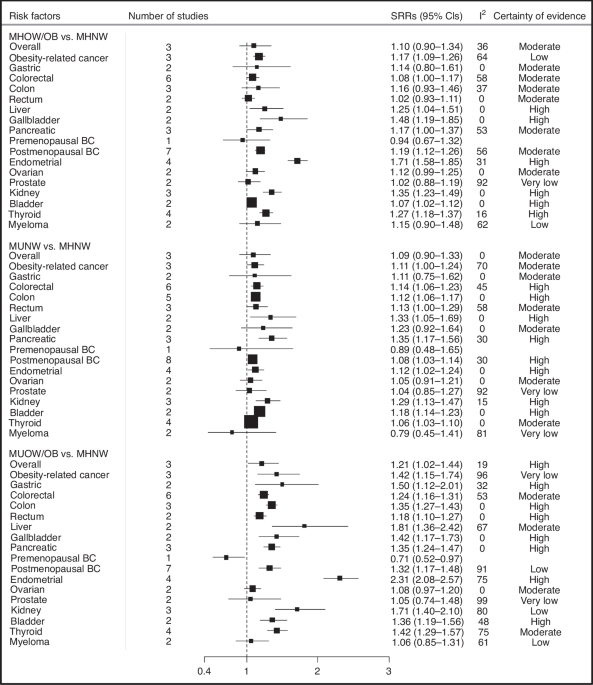
bias and 9 at moderate risk of bias. Compared to metabolically healthy normal-weight individuals (MHNW), metabolically unhealthy overweight/obese (MUOW/OB) individuals had a higher risk of
overall (SRR = 1.21, 95% CI = 1.02–1.44, n = 3 studies, high certainty) and obesity-related cancers (SRR = 1.42, 95% CI = 1.15–1.74, n = 3, very low certainty). Specifically, MUOW/OB
individuals were at higher risk of cancers of the postmenopausal breast (SRR = 1.32, 95% CI = 1.17–1.48, n = 7, low certainty), colorectum (SRR = 1.24, 95% CI = 1.16–1.31, n = 6, moderate
certainty), endometrium (SRR = 2.31, 95% CI = 2.08–2.57, n = 4, high certainty), thyroid (SRR = 1.42, 95% CI = 1.29–1.57, n = 4, moderate certainty), kidney (SRR = 1.71, 95% CI = 1.40–2.10,
n = 3, low certainty), pancreas (SRR = 1.35, 95% CI = 1.24–1.47, n = 3, high certainty), liver (SRR = 1.81, 95% CI = 1.36–2.42, n = 2, moderate certainty), gallbladder (SRR = 1.42, 95% CI =
1.17–1.73, n = 2, high certainty), bladder (SRR = 1.36, 95% CI = 1.19–1.56, n = 2, moderate certainty), and stomach (SRR = 1.50, 95% CI = 1.12–2.01, n = 2, high certainty). In addition, we
found elevated risks of most of these cancers among individuals classified as MUNW and MHOW/OB phenotypes compared to those with MHNW phenotype. Our stratified analyses according to
metabolic obesity phenotypes suggested that the elevated risks of some cancers were stronger in individuals with MUOW/OB versus those with MHOW/OB or MUNW phenotypes.
These findings suggest that both higher adiposity and metabolic dysfunction were independently associated with increased risk of several cancers, with the strongest associations generally
observed among those with both metabolic dysfunction and obesity.
Modifiable lifestyle risk factors such as smoking, alcohol, unhealthy diet, obesity, and lack of physical activity, have been estimated to cause at least 40% of cancers [1,2,3], and it has
been suggested that about 4–8% of cancer cases are attributed to excess body weight [1,2,3,4]. Although excess body fatness is a well-established risk factor for at least 13 different cancer
sites [5, 6], potential biological mechanisms underlying the adiposity–cancer relationship are not yet fully understood. Excess body fat may increase cancer risk through alterations in the
metabolism of endogenous hormones, chronic low-grade inflammation, and insulin resistance or hyperinsulinemia [5, 7]. Studies reported that insulin resistance plays a more significant role
in the obesity-cancer association than oestradiol levels and inflammation [8,9,10]. However, despite excess body weight and hyperinsulinemia having been reported to be associated with an
increased risk of cancer, it is unclear whether the risk of obesity-related cancers differs between individuals who are metabolically healthy (i.e., normal insulin sensitivity) with
overweight/obesity (MHOW/OB), those with metabolically unhealthy (i.e., insulin resistance) overweight/obesity phenotypes (MUOW/OB) and those with metabolically unhealthy normal weight
(MUNW).
In the last decade, a growing body of research has examined the association between metabolic obesity phenotypes—defined using a combination of adiposity and metabolic dysfunction
parameters—and obesity-related outcomes [11,12,13,14]. Interestingly, several studies reported that MU individuals, defined as having elevated levels of homoeostasis model assessment of
insulin resistance (HOMA-IR) index, fasting insulin, C-peptide, or having more than one metabolic abnormality, were at greater risk of developing colorectal, breast, pancreatic, and bladder
cancers, regardless of whether they were normal weight or overweight/obese when compared with individuals who are metabolically healthy and normal weight (MHNW) [15,16,17,18,19,20]. In
contrast, although some studies found that individuals who are overweight or obese and MH were also at elevated risk of postmenopausal breast, endometrial, pancreas, and kidney cancers
compared to MHNW phenotype [21, 22], accumulating evidence suggests that individuals classified as MHOW/OB were not at elevated risk of these diseases [16, 19, 23, 24]. A subsequent analysis
within the UK Biobank found that overweight/obese individuals with metabolic abnormalities had a lower risk of prostate cancer compared with normal-weight individuals with no metabolic
abnormalities [21], whereas another study in the National Health Checkup database reported that metabolic syndrome was associated with an increased risk of prostate cancer among individuals
with overweight and obesity [17]. Globally, the findings from previous studies have not been consistent, as some studies reported an elevated risk of certain cancer types among MHOW/OB
individuals [21, 22], while others found no clear association [16, 19, 23, 24]. A meta-analysis of seven cohort studies reported a higher risk of cancer among individuals with MHOW/OB
compared to individuals with MHNW phenotypes [25]. However, the authors of this review provided a pooled risk estimate of the associations by combining different cancer types and did not
consider individuals with MU phenotypes. Another meta-analysis, based on seven studies published until June 2021, reported a higher risk of colorectal cancer among individuals classified as
MUNW, those with MHOW/OB, and those with MUOW/OB compared with MHNW individuals [26]. A more recent meta-analysis of 11 cohort studies has been published, which focused solely on comparing
cancer risk between adults with MHOW/OB and MUOW/OB [27]. However, it is not clear whether individuals with MHOW/OB, MUNW, or MUOW/OB phenotypes compared to MHNW individuals are at a higher
risk of overall and site-specific cancer, as these previous meta-analyses did not perform separate analyses.
Since the publication of these three meta-analyses, several cohort studies have been published on the association between metabolic obesity phenotypes and cancer risk, and the strength of
the associations differed greatly between these studies [18, 19, 28,29,30,31,32,33,34]. Furthermore, previous meta-analyses were limited by the lack of subgroup analyses stratified by study
characteristics such as the risk of bias, and the criteria used to define metabolic health status [25,26,27]. To improve our understanding and identify individuals at high risk among those
with high body fatness, it is essential to explore cancer heterogeneity, which has been somewhat limited in previous research—both in terms of cancer subtypes and of metabolic obesity
phenotypes exposure.
In this study, we conducted a systematic review and meta-analysis of published cohort studies to investigate the association of metabolically obesity phenotypes with cancer risk overall and
for obesity-related cancers and specific cancer sites, to clarify the strength of these associations, and to explore potential sources of heterogeneity between studies.
This systematic review was registered at PROSPERO and accepted for inclusion in June 2024 (Registration ID Number CRD42024549511). We followed the guidelines of the Preferred Reporting Items
for Systematic Reviews and Meta-Analyses (PRISMA) statement and Meta-Analysis of Observational Studies in Epidemiology [35]. PubMed (MEDLINE) and Embase databases were systematically
searched to identify relevant articles published in English up to June 06, 2023. The search terms and algorithm used are detailed in Supplementary information. We followed the standard
criteria for reporting meta-analyses of observational studies [36].
In this meta-analysis, we included cohort studies (retrospective, prospective, and nested case-control studies within cohort studies) that examined the association between metabolic obesity
phenotypes (MHOW/OB, MUNW, or MUOW/OB vs MHNW phenotypes) and the risk of cancer, overall or for site-specific cancers. Estimates of the relative risk (RR) (such as hazard ratios, risk
ratios, or odds ratios) and the 95% confidence intervals (CIs) had to be available in each included publication. Case-control studies, cross-sectional studies, case reports, reviews,
editorials, and studies published as conference abstracts only were excluded from this meta-analysis. If several publications were published using the same study cohort, the one with the
largest sample size was retained. All relevant studies were imported into Reference Manager for screening. Two reviewers (YM-S and RJ) performed screening by reviewing titles, abstracts, and
keywords for relevance to metabolic health or obesity, and cancer. The full text of the selected articles was then retrieved to assess their eligibility. Any discrepancies were resolved by
discussion with a third reviewer (DA).
Relevant information was extracted by one investigator (YM-S), and the accuracy of the extractions was checked by another investigator (DA). The following data were collected from each
individual publication: the last name of the first author, publication year, country where the research was conducted, study design, study description or name, duration of follow-up, sample
size (such as the number of cases and non-cases for nested case-control studies, and cases and total participants for cohort studies), definition of MU status, cancer type, exposure
categories, risk estimates with corresponding 95% CIs, and adjustment factors. Additionally, we extracted details regarding the assessment of metabolic health status employed by each study.
To assess the quality of the included studies and their potential risk of bias, we used the Cochrane risk of bias tool for non-randomised studies of interventions (ROBINS-I) tool [37]. The
tool comprises seven domains: bias due to confounding, bias in selection of study participants, bias in exposure measurement, bias due to misclassification of exposure during follow-up, bias
due to missing data, bias in measurement of outcomes, and bias in selection of reported results. The evaluation was independently performed by two reviewers (YM-S and RJ).
In addition to the assessment of risk of bias, certainty of evidence of pooled associations was evaluated using the Grading of Recommendations, Assessment, Development, and Evaluations
(GRADE) approach [38]. This method assesses the quality and the strength of research evidence reflecting the Bradford Hill criteria for causation, which takes into account the within-study
risk of bias, inconsistency, indirectness and imprecision between the studies, publication bias, large magnitude of effect, and the impact of residual confounding. Briefly, the certainty of
evidence level is considered as “high” for all cohort studies. However, the certainty of evidence is downgraded (up to two levels) unless the study design reduces confounding, selection, and
information bias as evaluated by ROBINS-I. The certainty of evidence is rated as “not likely” for risk of bias because all studies are evaluated as low/moderate risk of bias. In addition,
indication for inconsistency (as measured by the similarity of the point estimates, and statistical tests, such as I2), indirectness (e.g., substantial differences in population or
exposure), imprecision (wide 95% confidence interval and/or small number of events), and publication bias (Egger’s test) can lead to a downgrading, while large effects (SRR > 2.0) gradient
can lead to an upgrading. The certainty of evidence was rated as high, moderate, low, or very low. A high certainty of evidence indicates a strong likelihood that the inclusion of additional
studies will have minimal impact on the estimated effect, whereas a very low certainty of evidence implies a high probability that future studies will significantly alter the obtained
results.
All statistical analyses were conducted using R and Stata software version 15.1 and 17. In this study, separate meta-analyses were conducted for the three main exposures of interest: MHOW/OB
vs MHNW phenotype, MUNW vs MHNW phenotype, and MUOW/OB vs MHNW phenotype. The analyses were further performed separately for individuals with overweight and obesity to see whether there was
a difference in effect size between overweight and obesity. We calculated summary relative risks (SRRs) and 95% CIs to assess the association between metabolic obesity phenotypes, and
cancer risk, both overall and by specific cancer sites. The average of the natural logarithm of the RRs was estimated, and the RR from each study was weighted using random effects weights
[39]. For studies that reported results separately for specific subgroups of exposure (e.g., MHOW and MHOB or MUOW and MUOB) [21, 23, 32,33,34, 40, 41], we combined the results using a
fixed-effects model to obtain an overall estimate for use in the meta-analysis [42]. For studies that report results separately for multiple cancer types [21], we defined obesity-related
cancers using a fixed-effects model that combines 12 different cancer sites concluded with strong evidence of being related to obesity as previously reported in the Third Expert Report of
the World Cancer Research Fund including cancers of the mouth/pharynx/larynx, oesophagus, stomach, pancreas, gallbladder, liver, colorectum, postmenopausal breast, endometrium, ovaries,
prostate, and kidney [6]. In a study conducted within the Framingham Heart Study, obesity-related cancer was reported as combination of postmenopausal breast cancer, female reproductive
(i.e., cervical, endometrial, and uterine), colon, liver, gallbladder, pancreas, kidney, and oesophageal adenocarcinoma [24], whereas in a data from the Metabolic Syndrome and Cancer
Project, it was reported as combination of 12 different cancer sites [34].
Statistical heterogeneity between studies was quantitatively assessed by the Cochran Q test and the I2 statistic [43]. I2 is a measure of how much of the heterogeneity is due to
between-study variation. I2 values of 25%, 50%, and 75% were considered to indicate low, moderate, and high heterogeneity, respectively. Small-study effects, such as publication bias, were
visually assessed by examining the funnel plots for asymmetry and applying Egger’s test [44]. The results were considered to indicate potential small-study bias when p-values were