Play all audios:
ABSTRACT Most organisms on the earth exhibit circadian rhythms in behavior and physiology, which are driven by endogenous clocks. Phosphorylation plays a central role in timing the clock,
but how this contributes to overt rhythms is unclear. Here we conduct phosphoproteomics in conjunction with transcriptomic and proteomic profiling using fly heads. By developing a pipeline
for integrating multi-omics data, we identify 789 (~17%) phosphorylation sites with circadian oscillations. We predict 27 potential circadian kinases to participate in phosphorylating these
sites, including 7 previously known to function in the clock. We screen the remaining 20 kinases for effects on circadian rhythms and find an additional 3 to be involved in regulating
locomotor rhythm. We re-construct a signal web that includes the 10 circadian kinases and identify GASKET as a potentially important regulator. Taken together, we uncover a circadian kinome
that potentially shapes the temporal pattern of the entire circadian molecular landscapes. SIMILAR CONTENT BEING VIEWED BY OTHERS REASSESSING THE INVOLVEMENT OF THE CREB PATHWAY IN THE
CIRCADIAN CLOCK OF _DROSOPHILA MELANOGASTER_ Article Open access 04 December 2024 PROTEOMIC ANALYSIS OF DROSOPHILA CLOCK COMPLEXES IDENTIFIES RHYTHMIC INTERACTIONS WITH SAGA AND TIP60
COMPLEX COMPONENT NIPPED-A Article Open access 21 October 2020 THE P-LOOP NTPASE RUVBL2 IS A CONSERVED CLOCK COMPONENT ACROSS EUKARYOTES Article 26 March 2025 INTRODUCTION Circadian clocks
drive daily, or circadian rhythms in a myriad of biological processes. Disruptions of these rhythms are associated with various diseases and disorders, such as cancers, metabolic disorders,
and mood disorders1. Underlying the overt rhythms are molecular oscillations at multiple levels, including cyclic regulations of the transcriptome, proteome, and post-translational
modifications (PTMs)2,3,4,5. However, it remains largely unclear how circadian clocks drive these integrated rhythms. The molecular clock consists of a series of transcriptional and
translational feedback loops that are relatively conserved2. In _Drosophila_, two transcription factors, CLOCK (CLK) and CYCLE (CYC) are at the center of the loops. CLK and CYC dimerize and
activate the transcription of _period_ (_per_) and _timeless_ (_tim_) via E-box elements in the genome6. PER and TIM proteins accumulate in the cytoplasm, form a complex, and enter the
nucleus, where they suppress the transcriptional activities of CLK/CYC and thus their own transcription. During this process, PTMs influence the stability and nuclear translocation of PER
and TIM, leading ultimately to their degradation that enables CLK/CYC to start a new round of transcription, thus completing a cycle2. There are also a few accessory loops that result in
rhythmic transcription of _clk_. The time it takes for these feedback loops to operate once is ~24 h, and PTMs, especially phosphorylation, play a central role in timing the molecular
clock6,7,8. Moreover, rhythmic phosphorylation has been suggested to be a fundamental part of the clock and at the heart of molecular oscillations, as it has been demonstrated in
cyanobacteria and _Neurospora_ that a purely phosphorylation-based clock is sufficient to drive circadian cycling9,10. With the advances in high-throughput mass spectrometry, time series
analysis of proteomics and phosphoproteomics have been conducted in mouse livers, demonstrating that rhythmic phosphorylation is not limited to the core clock3,4,5. About 25% of all
phosphorylation sites (p-sites) in mouse liver exhibit robust circadian oscillations3. How these oscillations in phosphorylation are regulated is unknown. Here, we conduct a multi-omics
profiling to measure circadian oscillations in transcriptomes, proteomes and phosphoproteomes in fly heads. We develop an efficient pipeline for computationally integrating circadian
multi-omics data (iCMod) to acquire normalized circadian p-sites (NCPs) that are oscillating in a circadian manner truly owing to rhythmic phosphorylation/dephosphorylation events. In total,
we quantify 4686 p-sites with high confidence from wild-type (WT) fly heads, among which 789 (~17%) NCPs characterized from 431 proteins display circadian oscillation. Most of these rhythms
are dampened in mutants lacking core clock gene _per_ (_per__0_), implicating these rhythms are driven by the molecular clock. We predict that 27 protein kinases might be involved in
regulating circadian rhythms by preferentially phosphorylating these NCPs, including seven kinases already known to play essential roles in the core clock. To validate our predictions, we
test the remaining 20 kinases and discover _gasket_ (_gskt_), _Downstream of raf1_ (_Dsor1_) and _casein kinase I alpha_ (_CKIalpha_) to be participating in determining the period and/or
power of locomotor rhythm. Computational analysis reveals that these 10 kinases involved in locomotor rhythm may contribute to global oscillations not only at phosphorylation level, but also
at mRNA and protein levels with GSKT as a potentially critical regulator of the signaling cascades. We further examine the function of GSKT within the clockwork and find it acts to reduce
TIM protein but not mRNA level. Taken together, our results unveil a kinome that is potentially involved in shaping the entire circadian molecular landscapes, as well as intricate
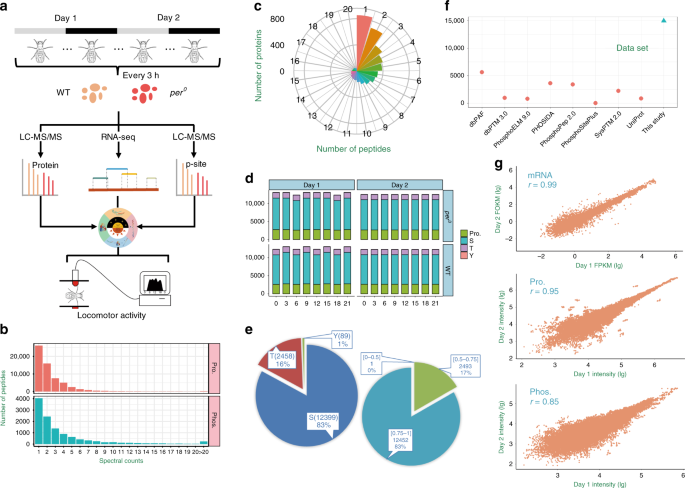
interactions among the kinases and their substrates that ultimately impinge on locomotor rhythm. RESULTS QUANTIFYING MULTI-OMICS DATA UNDER CIRCADIAN CYCLES To investigate global
phosphorylation in flies, we conducted quantitative proteomics and phosphoproteomics using the Tandem Mass Tag (TMT) labeling and liquid chromatography-tandem mass spectrometry (LC-MS/MS) on
WT and _per__0_ fly heads collected at 3 h intervals on 2 days under constant darkness (DD) condition (Fig. 1a). Altogether we identified 61,460 non-phosphorylated peptides and 12,465
phosphopeptides from 32 samples. The majority of the peptides (35,280; 57.40%) and phosphopeptides (8193; 65.73%) could be matched with ≥2 spectral counts, whereas the average spectral
counts were 2.5 and 4.4 for all peptides and phosphopeptides, respectively (Fig. 1b). We next mapped non-phosphorylated peptides to their corresponding protein sequences, and obtained 5998
and 6034 proteins in WT and _per__0_ flies, respectively (Supplementary Data 1). Only 14.87% (912) of 6134 quantified proteins were assigned with one matched peptide, with an average number
of 8.6 quantified peptides per protein (Fig. 1c). We also mapped phosphopeptides to full-length protein sequences and in total obtained 3295 phosphoproteins with 14,946 non-redundant p-sites
from all 32 samples with an average p-site localization probability of 0.91, including 12,399 p-Ser (82.96%), 2458 p-Thr (16.45%), and 89 p-Tyr (0.60%) sites (Fig. 1d, e and Supplementary
Data 1). We compared the p-sites identified here with eight public databases, including dbPAF11, dbPTM12, Phospho.ELM13, PHOSIDA14, PhosphoPep15, PhosphoSitePlus16, SysPTM17, and UniProt18.
Only 37.56% p-sites quantified in this study were annotated and included in at least one phosphorylation database, whereas up to 9333 p-sites have never been reported (Fig. 1f). By using
two-sided hypergeometric test, the enrichment analysis of Gene Ontology (GO) terms revealed that proteins expressed in the head are mainly involved in neurotransmitter secretion,
translation, transport, and splicing, whereas phosphorylation is enriched in pathways that regulate GTPase activity, olfactory learning, chemical synaptic transmission, and intracellular
signaling, as well as protein phosphorylation (Supplementary Fig. 1a). To further validate the proteomic and phosphoproteomic data sets, we conducted transcriptome profiling of WT and
_per__0_ fly heads collected in DD by RNA sequencing (RNA-seq) (Fig. 1a). Over 9.4 × 10⁸ reads were sequenced in all 32 samples, with an average of 3.1 × 10⁷ and 2.9 × 10⁷ reads in WT and
_per__0_, respectively (Supplementary Fig. 1b). After reads mapping and transcript assembly, there are 15,280 and 14,760 mappable protein-coding genes identified in WT and _per__0_ flies,
respectively, which occupy 70.84% of the fly protein-coding transcriptome (Supplementary Fig. 1c and Supplementary Data 1). Fragments Per Kilobase of exon per Million fragments mapped (FPKM)
values were calculated for the quantification of individual mRNAs, and the average FPKM values are 114 and 118 for WT and _per__0_ flies, respectively (Supplementary Fig. 1d and
Supplementary Data 2). Similar to proteomic data, mRNAs expressed in the head are also enriched in the splicing process, as well as axon guidance, development and transcription
(Supplementary Fig. 1a). To ensure data quality, only proteins and p-sites quantified in all 16 samples of WT or _per__0_ flies were retained (Supplementary Fig. 1e–g). In total, there are
4537 proteins and 5724 p-sites quantified in all WT flies, whereas 4561 proteins and 5739 p-sites were quantified in all _per__0_ samples. The multi-omics measurements show high
reproducibility, with Spearman’s rank correlation coefficients of 0.99, 0.95, and 0.85 at mRNA expression, protein expression, and phosphorylation levels for the two cycles monitored,
respectively (Fig. 1g). After normalization of the proteomic and phosphoproteomic data (Supplementary Fig. 1h), we analyzed the correlation among the multi-omics data, and found the
correlation of temporal variation between proteome and phosphoproteome is much higher than that between transcriptome and proteome (Supplementary Figs. 2, 3, 4a and Supplementary Note 1).
These results suggest that phosphorylation has a major role in regulating the temporal alterations of protein level. EMPLOYING ICMOD FOR INTEGRATING CIRCADIAN MULTI-OMICS DATA In this work,
we implemented a pipeline termed iCMod to integrate circadian multi-omics data, and to accurately predict mRNAs, proteins and p-sites with circadian oscillation (Fig. 2). For a protein
detected by proteomics/phosphoproteomics analysis, we believe its corresponding mRNA should be readily detectable in the transcriptomic data. For 16.70% and 16.80% of quantified proteins
from WT and _per__0_ flies, respectively, we observed that their corresponding mRNAs are expressed at a low level with FPKM < 1 (Supplementary Fig. 4b). Previous study has demonstrated
that mRNAs with FPKM < 1 cannot be reliably determined to be expressed19, and excluding weakly expressed transcripts enhances the reliability of protein identification20. Therefore, we
constructed customized protein sequence databases using only mRNAs with relatively high expression level (FPKM ≥ 1 in at least one sample per batch). Peptides and phosphopeptides were then
identified from proteomic and phosphoproteomic spectra by searching the reference databases, respectively (Fig. 2 and Supplementary Data 3–5). We employed ARSER21 to identify genes with
circadian expression from mRNAs with FPKM ≥ 1 detected in at least one of the 16 samples of WT and _per__0_ flies, respectively. For proteomic data, the average intensity value of all
proteins was normalized to 1 for each sample. ARSER was subsequently used to identify proteins that oscillate in abundance. As the phosphoproteome shows strong positive correlation of
temporal expression with the proteome (Supplementary Fig. 2a), it is possible that for many p-sites, oscillation of phosphorylation level is a result of oscillation in protein level.
Therefore, we normalized the phosphoproteomic data by calculating the ratio of raw phosphorylation abundance vs. raw protein abundance for each p-site to acquire normalized phosphorylation
level. We then used ARSER to identify NCPs, which reflect true oscillations at the phosphorylation level (Fig. 2). We adopted a previously developed tool, Group-based Prediction System 2.1
(GPS 2.1), to predict site-specific kinase–substrate relations (ssKSRs) for the p-sites22. This is followed by a two-sided hypergeometric test to determine protein kinases with substrates
enriched for NCPs, which we referred to as potential circadian kinases. MOLECULAR OSCILLATION LANDSCAPES REGULATED BY PER After processing the omics data sets with iCMod, we identified 661
(6.67%) mRNAs, 620 (16.42%) proteins, and 789 (16.84%) p-sites to be significantly oscillating in WT fly heads (Fig. 3a and Supplementary Data 6). In contrast with the commonly used
approach, which does not remove mRNAs with FPKM < 1 or normalize phosphorylation abundance to protein abundance, iCMod enabled more accurate identification of cycling molecules (Fig. 3a,
Supplementary Figs. 5, 6, and Supplementary Note 2). We compared our circadian multi-omics data with circadian gene database (CGDB, http://cgdb.biocuckoo.org/)23 which includes 2768
_Drosophila melanogaster_ genes with mRNAs reported to be cycling and found these genes to be enriched only in our cyclic mRNA data set but not in the cyclic protein or phosphoprotein data
sets (Fig. 3b). Moreover, we compared our circadian omics data with an oscillatory translatome data set acquired by ribosomal profiling of fly heads24, and found that genes rhythmically
translated are statistically enriched both in our cyclic mRNA and protein data sets, but not in cyclic phosphoprotein data set (Fig. 3b). Taken together, iCMod integrates multiple types of
omics data, and determines circadian oscillations at multiple levels with higher confidence and accuracy. To test whether these molecular oscillations are driven by the core molecular clock,
we used iCMod to process multi-omics data from _per__0_ heads (Fig. 3c). We observed that _per__0_ mutation abolishes the cycling of 93.95% of mRNAs, 84.52% of proteins and 87.96% of
p-sites, indicating that the majority of the molecular oscillations are controlled by PER, which means they are likely driven by the molecular clock. Moreover, we calculated the peak times
for the molecular oscillations and found that cycling transcripts tend to peak at CT12 (Fig. 3d). The peak times for cycling proteins appear to be rather evenly distributed throughout the
day, whereas NCPs tend to peak more during the subjective night from CT12 to CT0 (Fig. 3d, e). The amplitude of these oscillations is relatively low, with the amplitude of cycling at
phosphorylation level slightly higher than that at protein level (Fig. 3f). To understand the potential function of these molecular oscillations, GO-based enrichment analysis was performed
(Fig. 3g). Cycling mRNAs are enriched in light and visual signaling pathways, while cycling proteins are enriched in processes involved in Wnt regulation and endocytosis/exocytosis. NCPs are
enriched in pathways that regulate sarcomere organization and neural development. We did not identify any published cycling p-sites among the NCPs, which is probably because the published
sites are located on core clock proteins such as PER, TIM and CLK6. These core clock proteins are expressed at low levels in whole-head extracts and thus we were not able to detect the
reported phosphorylation rhythms on these proteins. We tried to validate some of our NCPs with antibodies available and was able to observe significant temporal variation at tyrosine 214 of
SHAGGY10 (SGG10) isoform of the SGG protein which is eliminated by _per__0_ mutation (Fig. 3h, i and Supplementary Fig. 7)25. Taken together, our analyses identified substantial molecular
oscillations occurring at the mRNA, protein, and phosphorylation levels that are largely controlled by PER and enriched in distinct biological pathways, which implies different biological
processes favor different levels of circadian regulation. PREDICTION AND VALIDATION OF A CIRCADIAN KINOME We used GPS to analyze the 789 NCPs identified in WT flies, and acquired 36,522
potential ssKSRs between 153 protein kinases and 778 phosphorylated substrates. We found that 98.10% of all identified NCPs were predicted with ≥2 kinases, indicating a complex
kinase–substrate phosphorylation network involved in circadian regulation. The top five groups of kinases are responsible for the modification of ~87% of total phosphorylation events,
whereas the top 10 kinase families identified carry out ~54% of total phosphorylation events (Fig. 4a, b). Next, we performed a two-sided hypergeometric test to analyze the enrichment of
NCPs among all predicted substrates for each kinase. Altogether, we predicted 27 potential circadian kinases that display significant enrichment in NCPs, which include seven kinases already
known to be involved in circadian regulation in flies (Fig. 4c, d)6,26,27. Eight of these kinases exhibit cycling at mRNA, protein and/or phosphorylation level, implicating a potential role
as an instructive signal in the circadian system. Among the predicted circadian kinases, there are 20 that have not been reported to participate in _Drosophila_ circadian regulation (Fig.
4d). Therefore, we validated these kinases by testing whether they play a role in modulating fly locomotor rhythms. We found six kinases to be involved or potentially involved in rhythm
regulation (i.e., when genetically manipulated, the target kinase can alter the period by at least 1 h or reduce the power of rhythm by 50% or more), including _gskt_, _Dsor1_, _bsk_,
_gish_, _hep,_ and _CKIalpha_ (Fig. 4e). _gskt_ is generated by retroposition of _sgg_, the fly homolog of mammalian glycogen synthase kinase-3β (GSK3β)28. _Dsor1_ encodes the _Drosophila_
MEK, which is activated by receptor tyrosine kinases and phosphorylates extracellular-signal-regulated kinase29. _bsk_ encodes the fly homolog of mammalian c-Jun amino terminal kinase (DJNK)
and is known to be phosphorylated and activated by JNK kinase HEP30. _gish_ encodes CKIγ and together with CKIalpha belong to casein kinase I (CKI) family31. We first examined the effects
of these kinases on circadian regulation by knocking down each kinase in all clock cells using a _tim_GAL4 driver or in circadian neurons along with a few other brain regions with a
_cryptochrome_ (_cry_)GAL4-1632. We tested 89 RNA interference (RNAi) lines, which produce double-stranded RNA hairpin structures that trigger sequence-specific post-transcriptional
silencing and RNAi responses33,34. We found that knocking down _gskt_, _Dsor1,_ and CG7094 with at least two independent RNAi lines lead to 1–3 h lengthening of circadian period, whereas
knocking down _Dsor1_ also substantially reduces power and rhythmicity (Fig. 5a, b and Supplementary Data 7). Knocking down _CKIalpha_ with one RNAi line almost completely abolishes the
rhythm, whereas with another RNAi line leads to 2–3 h longer period. We then verified that the mRNA levels of the target genes were indeed reduced by RNAi (Supplementary Fig. 8a). Although
two independent CG7094 RNAi lines exhibit lengthened period, only one of them shows significant mRNA reduction (Fig. 5a, b and Supplementary Fig. 8a). We reasoned that the period lengthening
effect of the other RNAi line may be owing to off-target effects, and thus did not consider CG7094 as a positive hit. There are several genes with only one RNAi line that exhibits
substantial changes in period or power of the rhythm, which may also be owing to off-target effects of this particular RNAi, so we did not consider these genes as positive hits either
(Supplementary Data 7). We tested nine overexpression lines and found that expressing a WT or dominant negative form of BSK in circadian neurons results in 1–3 h longer period, whereas
overexpressing two constitutively active forms of HEP almost completely abolishes the rhythm (Fig. 5c)35. Overexpressing a WT GISH shortens the period by ~1.5 h whereas expressing a kinase
dead form of GISH results in ~1.5 h lengthening of the period36. Overexpressing a WT CK1alpha substantially reduces the power of the rhythm. At last, we tested 33 mutant or potential mutant
lines and found three mutants displayed reduced power or lengthened period (Supplementary Figs. 8b, 9, and Supplementary Data 7). However, after backcrossing these lines onto an isogenic
background and/or testing additional alleles, we observed either no phenotype or weaker phenotype, which means the phenotypes previously observed are likely due to genetic background
differences rather than defects caused by the mutations (Supplementary Fig. 8c and Supplementary Data 7). Based on the strength of circadian phenotypes observed, we classified the remaining
20 predicted circadian kinases into three groups. Group 1 includes GSKT, DSOR1, and CKIalpha, the phenotypes of which were confirmed by multiple independent RNAi lines and thus are highly
likely to regulate the clock. Group 2 includes GISH, BSK, and HEP, which only demonstrated phenotypes when overexpressed and thus are potential regulators of the clock. The rest of the
predicted circadian kinases belong to Group 3, as they showed no clear evidence of involvement in locomotor rhythm modulation. All in all, nearly half (48%) of the predicted circadian
kinases appear to play (or potentially play) a role in regulating locomotor rhythms, demonstrating the power of iCMod in identifying kinases that function in the circadian system and
revealing insights regarding circadian control of phosphorylation (Fig. 5d). A SIGNAL WEB THAT CONTROLS MOLECULAR AND LOCOMOTOR RHYTHM According to our predicted ssKSRs and published
literature, the seven known circadian kinases and 3 Group 1 kinases that regulate locomotor rhythm can form a giant web that integrates our circadian omics data from multiple levels. First
of all, the activities of these 10 kinases can account for 81.6% of the NCPs identified (Supplementary Fig. 10 and Supplementary Data 8). For proteins that show circadian cycling in
abundance, 76 contain NCPs predicted to be phosphorylated by one of the 10 kinases, whereas 429 interact with at least one other protein that contains NCPs phosphorylated by one of the 10
kinases. Therefore, the activities of these kinases could potentially explain 81.5% of the circadian proteome. Moreover, computational analysis predicted that the transcription of all genes
oscillating at mRNA level is potentially activated by 33 transcription factors, 30 of which are predicted to be phosphorylated by at least one of these 10 kinases. These transcription
factors include core clock proteins CLK, CYC, VRILLE (VRI), and Par Domain Protein 1 (PDP1) as well as KAYAK (KAY) and MEF2, which have been shown to regulate the clock37,38. Notably, we
also observe SERPENT (SRP) among the transcription factors, which is believed to act in synergy with CLK/CYC to orchestrate tissue-specific outputs39. Taken together, these results suggest
that these kinases not only control rhythms at phosphorylation level, but also contribute to oscillation at mRNA level by modifying transcription factors and oscillation at protein level by
directly phosphorylating the target proteins or indirect modulation via protein–protein interactions (PPIs). Based on our predictions and published data, we further extracted a network of
signaling cascades that ultimately impinge on locomotor rhythm from the web (Fig. 6a and Supplementary Fig. 10). Within this network, there appears to be a major hub consisting of GSKT,
which possess the greatest number of connections with other kinases and clock proteins (Fig. 6b). GSKT sends out regulatory outputs targeting DSOR1 and 4 components of the clockwork (Fig.
6a, b). This implicates that GSKT is a potentially essential regulator of the kinase network. GSKT ACTS TO DECREASE TIM PROTEIN LEVELS Given the central role of GSKT within the circadian
kinase network, we further investigated how it affects locomotor rhythm by examining its predicted substrates (Fig. 7a). Among the potential substrates, SLMB, CUL-3, SGG, S6KII, and NEJIRE
(NEJ) are already known to regulate the molecular clock and locomotor rhythm6,40,41. Under DD conditions, SLMB and CUL-3 exert effects on the clock by impinging on PER and TIM protein
stability, whereas SGG times the clock by regulating PER/TIM nuclear translocation25,41,42. S6KII is believed to regulate the clock by targeting SGG and possibly PER, whereas NEJ binds with
CLK/CYC to modulate transcription of clock genes40,43. Therefore, we first tested whether knocking down _gskt_ affects PER and TIM protein level in fly heads. Indeed, we observed
significantly elevated TIM protein level and a trend of increase in PER protein level when _gskt_ is knocked down (Fig. 7b, c). Meanwhile, _tim, vri,_ and _Pdp1ɛ_ mRNA levels are not
significantly altered, whereas per mRNA level is moderately increased (Fig. 7d). As the period of locomotor rhythm in DD is determined by the small ventral lateral neurons (s-LNvs)44, we
assessed TIM levels in these cells and consistent with the changes observed at whole-head level, TIM is significantly increased at CT0 (Fig. 7e, f). Moreover, we co-expressed GSKT and TIM in
_Drosophila_ S2 cells and found significant reduction of TIM level compared to the control (Fig. 7g). Taken together, these results indicate that GSKT acts to reduce TIM protein level via
post-transcriptional mechanism. Because among the five potential substrates that may mediate the effects of GSKT on the clock, only SLMB and CUL-3 are known to affect TIM protein level, this
provides some potential candidate mechanisms regarding how GSKT may regulate TIM41. It is noteworthy that among the predicted substrates of GSKT are DSOR1, BSK, and GISH, implicating these
kinases may function together with GSKT to regulate locomotor rhythms. In short, this demonstrates an example of how our predictions can aid the process of characterizing the molecular
actions of a candidate kinase in the circadian system. DISCUSSION Here in our phosphoproteomic study, we detected 14,946 non-redundant p-sites, including 9333 sites that have not been
previously reported, which demonstrates the sensitivity of our system and provides a rich resource for future research. To further ensure the reliability of our data set, we removed all
mRNAs with FPKM < 1 and their corresponding peptides/phosphopeptides, which has not been conducted in previous circadian phosphoproteomic studies3,4,5. In an attempt to optimize our iCMod
pipeline, we removed this filter and re-performed the analysis only using the proteomic and phosphoproteomic data (Supplementary Fig. 11). We found this considerably lowered the accuracy of
circadian kinase prediction. Moreover, we only analyzed mRNAs, peptides, and p-sites that can be detected at all time points rather than just some of the time points. Most importantly, we
normalized the raw phosphorylation abundance of each p-site to its raw protein abundance to acquire NCPs, whereas previous studies directly analyzed phosphoproteomic data to identify
oscillating p-sites3,5. These additional processing (especially the normalization step) makes a tremendous difference in the cycling p-sites identified (only 36% overlap), indicating the
necessity of conducting at least the normalization procedure as this may completely change the oscillatory phosphorylation landscape identified. Wang et al.4 focused on cycling p-sites of
non-rhythmic proteins, but this will miss out on the cycling p-sites of rhythmic proteins. It is possible that both phosphorylation and protein levels are rhythmically regulated but their
phases are different. Indeed, we observed that ~29% of the proteome show a negative correlation of its temporal expression profile with corresponding phosphorylation level. We took one-step
further and tested whether these global molecular oscillations are regulated by the molecular clock. Indeed, we found that the majority of the oscillations are damped in _per__01_ flies,
suggesting that they are driven by the clock. Robles et al.3 found that the amplitude of oscillation at phosphorylation level is much higher than at transcript or protein level.
Consistently, we have also observed this trend in our data with the amplitude of the phosphoproteome slightly higher than that of the proteome. However, we observed much lower cycling
amplitude of global phosphorylation compared to what has been reported by Robles et al.3 This is in part owing to differences in assessment method. Robles et al. adopted label-free
quantification, whereas we used TMT labeling, which is known to compress differences in intensity levels45. Another possibility is that cells of the fly head are more heterogeneous than that
of the mouse liver, thus the rhythms are less synchronized and robust. In addition, the molecular clock is not present in all cells in the head46. Therefore, oscillatory expression patterns
in the clock cells could be masked by constant expression patterns in non-clock cells. Moreover, the amplitude that we calculated has been normalized to the protein level. This could be
another reason for not observing highly robust cycling of the phosphoproteome. Interestingly, NCPs are enriched in proteins that function at the synapse and/or in the axon, which indicates
that these sites favor rhythmic phosphorylation as a major contributor to rhythmicity in synaptic and axonal processes. This makes sense because neurites and in particular synapses are where
most of the neural activities occur and thus are in high demand for energy. Cycling of phosphorylation is a much more economical way to bring about rhythmicity in protein function compared
with cycling of protein level47. It is noteworthy that we observe substantial oscillations at mRNA, protein and phosphorylation levels even in _per__0_ animals. This is not unprecedented as
Hughes et al.48 have also reported 59 cycling mRNA in _per0_ flies under DD (JTK cycle, _p_ value < 0.01), which is ~1/4 of the number of cycling transcripts in WT. We observe a
comparable ratio here. Interestingly, we observe even more oscillations at protein and phosphorylation levels. It is possible that some of these rhythms are residual light-driven
oscillations from LD cycle. They may also reflect the activities of some unknown PER-independent oscillator(s) that is masked in the presence of PER. Further studies are required to
characterize the nature of these oscillations. Among the 27 predicted circadian kinases, 13 (48%) are involved (or potentially involved) in rhythm regulation. It should be noted that one of
our identified circadian kinases, CkIalpha, has very recently been reported to interact with DOUBLETIME (DBT) for synergistically regulating PER in fly brain49. This finding further supports
the accuracy of our predictions. As for the remaining 14 kinases that we have not been able to demonstrate a clear role in locomotor rhythm regulation, they may participate in modulating
rhythms of other biological processes such as metabolism or sensory functions. 12% of cyclic proteins contain NCPs that are predicted to be phosphorylated by the 10 circadian kinases
(including the seven known circadian kinases and three Group 1 kinases), which suggests these sites to be potential targets of these kinases. The cyclic phosphorylation on these proteins
could result in cycling of protein stability and thus circadian oscillation in their abundance. In all, 69% of the cyclic proteins do not contain NCPs but are predicted to interact with at
least one protein that contains NCP(s) potentially modified by one or more of the 10 kinases. These interactions may confer rhythmic modulation, rendering oscillatory protein levels. A
previous study reported that CLK binds to ~800 genomic sites in a temporal-dependent manner and 267 of these CLK direct target sites show oscillating occupancy of RNA polymerase II,
suggestive of rhythmic transcription from these sites50. However, there are still many cyclic mRNAs that do not appear to be direct targets of CLK. Here besides CLK, we predicted additional
32 transcription factors to participate in activating the transcription of the cyclic mRNAs that we detected here, which means these transcriptional activators could function together with
CLK to generate rhythms in the transcriptome. Moreover, 30 of the transcription factors are predicted to be phosphorylated by the 10 kinases, which could result in circadian cycling of their
activities in transcriptional regulation. Taken together, our findings imply a role for these circadian kinases not only in generating rhythmic phosphoproteome, but may also contribute to
global oscillations of the proteome and transcriptome. Clearly much more needs to be done to validate the actions of these kinases, which is beyond the scope of this study. Nonetheless, we
propose a complex web of interactions based on our predictions in conjunction with literature that integrates these kinases into multi-omics circadian regulation. We extracted and refined a
small subset of the signaling web that reveals how the 10 kinases form a network to influence locomotor rhythm. It is surprising to find GSKT as a potential key regulator of the kinase
network. _gskt_ has been reported to be expressed in male germline cells in flies and required for male germline survival28. Interestingly, recent RNA-seq analysis revealed expression of
_gskt_ in circadian neurons51 and moreover _gskt_ was identified to be rhythmically translated based on ribosomal profiling of fly heads24, implicating a potential role of GSKT in circadian
regulation. Consistently, here we demonstrate expression of _gskt_ in the head and a role for timing locomotor rhythm. Although GSKT is a paralog of SGG and deficiency in either one of these
two kinases leads to lengthened period, they appear to have taken on different functions within the circadian kinome based on our predictions. Indeed, our experimental results demonstrate a
role for GSKT in reducing TIM protein level, whereas SGG is known to phosphorylate PER/TIM and promotes their nuclear entry but does not appear to affect their protein levels25,42,52.
Further studies are required to verify the kinase–substrate relationships in the circadian kinase network, but nevertheless, we believe this network provides a basic framework regarding
phosphorylation regulation of the molecular clock that control locomotor rhythm. In conclusion, our data reveal a circadian kinome that is potentially responsible for global molecular
oscillations. We propose an intricate web formed by these kinases and their substrates, which in our opinion, is a significant step forward in understanding phosphorylation regulation of the
clockwork from a system’s level. METHODS FLY STOCKS For RNA-seq, proteomics, and phosphoproteomics studies, male _w__1118_ (Bloomington Stock Center, BL3605) flies were crossed with
_y__1__w__*_ and _per__01_53, respectively. Male flies of F1 generation were used for omics study. For behavioral experiments, only male flies were used. Fly lines used are listed in
Supplementary Table 1. We backcrossed _gish__EY06451_, _hep__G0107_, _Asator__KG05051_ lines onto the isogenic _w__1118_ background for two generations. For Western blotting, quantitative
real-time PCR (qRT-PCR) and immunofluorescence analysis, both male and female progenies were used. _UAS_-_gskt-RNAi_ (line1, V25640) was used for molecular analysis and GD background control
was used for control. FLY HEAD COLLECTION Flies were collected within 7 days of eclosion and entrained in 12 h/12 h light–dark (LD) schedule for 3 days. After that, flies were transferred
into DD. On the first day of DD, flies were collected and frozen at 3 h intervals for WT flies (WT_0, WT_3, WT_6, WT_9, WT_12, WT_15, WT_18, and WT_21) and _per_0 flies (_per__0__0,
_per__0__3, _per__0__6, _per__0__9, _per__0__12, _per__0__15, _per__0__18, and _per__0__21). Frozen flies were vortexed for 10 s to separate the head from the body. Fly heads were collected
and stored at −80 °C. RNA EXTRACTION AND RNA-SEQ In all, 200 fly heads were homogenized in Total RNA Isolation (TRIzol) Reagent (Invitrogen), by using a handheld motor with plastic pestle.
After mixing with trichloromethane, homogenates were centrifuged at 12,000 × _g_ and suspension was precipitated with 75% ethanol. After air dry, total RNA was treated with RQ1 DNase
(Promega) to remove genomic DNA and stored at −80 °C. Before sequencing, RNA purity was measured by NanoPhotometer (IMPLEN, CA, USA), whereas the concentration and integrity of RNA were
assessed by Qubit RNA Assay Kit in Qubit 2.0 Flurometer (Life Technologies, CA, USA) and RNA Nano 6000 Assay Kit of the Agilent Bioanalyzer 2100 system (Agilent Technologies, CA, USA)
(Supplementary Data 9). Agarose gel electrophoresis was also conducted for all samples (Supplementary Fig. 12a). According to the quality control, all 32 samples were classified as Class A,
which represents the highest quality and RNA-seq profilings could be conducted more than twice for each sample. To construct the libraries for mRNA sequencing, NEBNext Ultra RNA Library Prep
Kit for Illumina (NEB, USA) was used following the manufacturer’s recommendations using 1.5 μg RNA per sample. Poly-T oligo-attached magnetic beads were employed to purify mRNA from total
RNA, and then fragmentation was carried out with divalent cations under elevated temperature in NEBNext First Strand Synthesis Reaction Buffer (5×). First and second strand complementary
DNAs (cDNAs) were then synthesized by using random hexamer primers. For hybridization, NEBNext Adaptor with hairpin loop structure was ligated onto the 3’ ends of the fragments, which were
then purified by AMPure XP system (Beckman Coulter, Beverly, USA) to control for the length. PCR was performed after treating the cDNA with USER Enzyme for 15 min at 37 °C followed by 95 °C
for 5 min. The purity of PCR products and assessment of library quality were performed on the Agilent Bioanalyzer 2100 system. In order to perform cluster generation of the index-coded
samples, HiSeq 4000 PE Cluster Kit (Illumia) was used on a cBot Cluster Generation System. Sequencing of library preparations was performed on Illumina Hiseq 4000 platform. PROTEIN
EXTRACTION FOR PROTEOMIC ANALYSIS Fly heads were homogenized by sonification for 5 min in urea lysis buffer (8 M urea, 1× proteinase inhibitor and phosphatase inhibitor (Roche), 2 mM EDTA).
Homogenates were centrifuged at 20,000 × _g_ for 10 min and supernatants were collected. Finally, protein concentration was measured by BCA Protein Assay Kit (Thermo Scientific) and adjusted
to be consistent across the time series (Supplementary Data 9). According to the SDS-PAGE results (Supplementary Fig. 12b), all 33 samples were classified as Class A, which represents the
highest quality and further experiments could be performed more than twice for each sample. ISOLATION OF PEPTIDES AND TMT LABELING In order to digest the proteins, protein solution was first
treated by 5 mM dithiothreitol (DTT) at 56 °C for 30 min, followed by alkylation with 11 mM iodoacetamide for 15 min at room temperature in the dark. After that, 100 mM triethylammonium
bicarbonate (TEAB) was used to dilute the protein samples to reduce the concentration of urea to <2 M. Two trypsin digestions were performed, using the mass ratio of 1:50
trypsin-to-protein for overnight treatment and 1:100 for 4 h, respectively. After digestion, Strata X C18 SPE column (Phenomenex) and vacuum-dry were used to desalt the peptides and then the
peptides were reconstituted with 0.5 M TEAB. The peptides were subsequently processed by TMT kit following the manufacturer’s recommendations. The peptides were incubated with labeling
reagent at room temperature for 2 h, followed by desalting and vacuum drying. PHOSPHOPEPTIDE ENRICHMENT High pH reverse-phase HPLC with Thermo Betasil C18 column was used to fractionate the
tryptic peptides into fractions. The peptides were first separated into 60 fractions by a gradient of 8–32% acetonitrile (pH 9.0) for 60 min and then pooled into eight fractions. These
fractions were subsequently vacuum dried. To enrich phosphopeptides, Ti4+-immobilized metal affinity chromatography microsphere suspension with vibration in loading buffer (50% acetonitrile
and 6% trifluoroacetic acid) was used to incubate the peptide mixtures. The IMAC microspheres with enriched phosphopeptides were then collected by centrifugation. In order to remove the
nonspecifically adsorbed peptides, 50% acetonitrile with 6% trifluoroacetic acid and 30% acetonitrile with 0.1% trifluoroacetic acid were used to wash the microsphere successively. After
eluting the enriched phosphopeptides by vibration with elution buffer containing 10% NH4OH, the supernatant containing phosphopeptides was collected and lyophilized for further analysis.
LC-MS/MS ANALYSIS Liquid phase A (0.1% formic acid) was used to dissolved the tryptic peptides, which were then loaded onto a home-made reversed-phase analytical column (length: 15 cm, i.d.:
75 μm) and separated by EASY-nLC 1000 ultra-performance liquid chromatography system. Liquid phase B contains 0.1% formic acid in 98% acetonitrile. Liquid phase gradient setting was as
follows: 0~50 min, 5–25% B; 50~62 min, 25–38% B; 62~66 min, 38–80% B; 66~70 min, 80% B. The flow rate was maintained at 400 nL/min. Peptides were subjected to NSI ion source for ionization
followed by tandem mass spectrometry (MS/MS) in Q ExactiveTM Plus (Thermo). The electrospray voltage was set to 2.0 kV and Orbitrap was used for detection and analysis. For primary MS, the
scan range was 350–1800 m/z at a resolution of 70,000. Subsequently, normalized collision energy was set at 28% for selected peptides undergoing secondary MS/MS, with scan range starting at
100 m/z and resolution set at 17,500. A data-dependent procedure that alternated between one MS scan followed by 20 MS/MS scans was applied with 15.0 s dynamic exclusion. Automatic gain
control (AGC) was set at 5E4. STANDARD DATABASE SEARCH MaxQuant (v.1.5.3.30)54 was used for standard database search of MS/MS raw data. MS/MS spectra was searched against _Drosophila_
proteome database obtained from UniProt (Version 201706)18, which contained 13,558 unique fly protein sequences. The digestion mode was set to Specific and Trypsin/P was chosen as cleavage
enzyme allowing up to two missing cleavages. Carbamidomethyl (C) was the fixed modification, while Oxidation (M) and Acetyl (Protein N-term) were the variable modifications for searching
both proteomes and phosphoproteomes, and Phospho (STY) for phosphoproteomes only. Seven was set as the minimum peptide length and 4600 Da as the Maximum peptide mass. The false discovery
rates for peptide-spectrum match, protein and p-site decoy fraction were all set to <1% and minimum score for modified peptides was set to >40. LOCOMOTOR ACTIVITY MONITORING To knock
down or overexpress a kinase, timGAL4;UAS_-dcr2_ and UAS_-dcr2_;_cry-_GAL4-1655 were crossed to RNAi lines and overexpression lines. For controls, UAS and GAL4 lines were crossed to the
genetic background controls for TRIP, GD, and KK RNAi collections, _w__1118_ and _yw_ strains. Flies were reared on standard cornmeal–yeast–sucrose medium and kept in LD cycles at 25 °C.
Locomotor activity levels of adult male flies were monitored by _Drosophila_ Activity Monitoring System (DAMS, TriKinetics) for 7 days of LD followed by 7 days of DD. PDF AND TIM
IMMUNOFLUORESCENCE AND MICROSCOPY Adult male flies were entrained for 3 days at 25 °C and anesthetized with CO2. Brains were dissected in PBS buffer containing 3.7% formaldehyde. After
fixation at room temperature for 30 min, the brains were rinsed two times in PBS and incubated in PBS with 1% Triton for 10 min at room temperature. The brains were then incubated in 5%
donkey serum diluted in PBT (PBS with 0.5% Triton) for 30 min at room temperature, followed by incubation for two days in a mixture of 1:100 rat anti-TIM (rat TIM antibody is a generous gift
from Dr. Joanna Chiu) and 1:50 mouse anti-PDF (DHSB) in PBT containing 5% donkey serum at 4 °C. After PBT rinses for six times, the brains were incubated with 1:500 donkey anti-rat
AlexaFluor 488 (Invitrogen) for TIM immunostaining and 1:10–1:20 donkey anti-mouse AlexaFluor 594 (Invitrogen) for PDF immunostaining in PBT overnight at 4 °C. After final rinses in PBT,
brains were mounted in 80% glycerol diluted in PBS. PDF/TIM-labeled specimens were photographed with ×60 oil lens by Olympus FV1000 laser scanning confocal microscope (Olympus). The
microscope, laser, and filter settings for a given experiment were held constant. TRANSIENT TRANSFECTION S2 cells were plated in 12-well plates and transfected with FuGENE 6 (Promega). DNA
plasmids used for transfections were as follows: pActin-HA-tim-V5, pActin-gskt-V5-6×His and pActin-V5-6×His. Cells were harvested 44 h after transfection. PROTEIN EXTRACTION AND WESTERN BLOT
Proteins were extracted from fly brains or S2 cells using SDS lysis buffer (10 mM Tris-base, 1 mM sodium orthovanadate, 1% SDS, pH 8.0, 1 mM DTT, 1× proteinase inhibitor and phosphatase
inhibitor (Roche)). After homogenization, protein lysates were centrifuged at 12,000 × _g_ for 15 min at 4 °C and incubated at 95 °C in loading buffer for 5 min. Equal amounts of protein
were loaded into each well on 5% or 8% SDS-PAGE gels and then transferred to nitrocellulose membranes for 2 h at 90 V. Membranes were incubated with primary antibody at 4 °C overnight
followed by secondary antibody at room temperature for 1 h. The primary antibodies used were as follows: guinea pig PER (1:1000), rat TIM (1:1000), rabbit ACTB (1:5000, ABclonal), guinea pig
SGG (1:1000), and phospho-SGG Y214 (1:1000, Abcam). Donkey secondary antibodies (1:10000 dilution) were conjugated either with IRDye 680 or IRDye 800 (LI-COR Biosciences) and visualized
with an Odyssey Infrared Imaging System (LI-COR Biosciences). Rat TIM antibody, guinea pig SGG antibody, and guinea pig PER antibody were generous gifts from Dr. Joanna Chiu. PCR AND QRT-PCR
PCR was performed with Taq Plus MasterMix (CWbiotech). The PCR reaction was performed as following: 94 °C for 2 min followed by 94 °C for 10 s, 57 °C for 15 s and 72 °C for 1 min 20 s for
35 cycles. Quantitative real-time PCR was performed with One-Step RT-PCR SuperMix (Transgen). The PCR reaction was performed as follows: 45 °C for 5 min; 94 °C for 2 min; 94 °C for 5 s, 58
°C for 15 s, 72 °C for 20 s for 40 cycles (Applied Biosystems). The ΔΔCT method was used for quantification. _Beta-Actin_ was used as internal control. The primers used are listed in
Supplementary Table 2. RNA-SEQ ANALYSIS For the analysis of the RNA-seq data, raw reads were first mapped to the reference genome of _D. melanogaster_, which was downloaded from Ensembl
(release version 90, http://www.ensembl.rog/)56. The software packages of Bowtie2 (version 2.2.4) and TopHat (version 2.1.1) were used to generate the BAM files, whereas Cufflinks (version
2.2.1) was employed to assemble the reads and calculate the expression levels of individual mRNAs based on FPKM values57. SAMPLE CORRECTION AND NORMALIZATION Unexpectedly, six samples (WT_0,
WT_6, WT_12, WT_18, _per__0__6, _per__0__18) failed to pass the quality tests before RNA-seq in the first round. Therefore, we re-prepared these samples by adding WT_3 as a normalization
control, and re-performed the transcriptomic, proteomic, and phosphoproteomic analysis. Owing to the limitation that only 10 samples can be simultaneously labeled and analyzed by the TMT
technology, four batches of LC-MS/MS analyses were carried out for all 32 samples (Supplementary Table 3). We observed a considerable fluctuation between Batch 4 and the other three batches.
To improve the consistency of the four batches, we used the WT_3 sample quantified in both Batch 1 and Batch 4 as the normalization control for proteomic and phosphoproteomic data. First,
all proteins and p-sites quantified in both batches for the WT_3 sample were picked out, whereas the Batch 1: Batch 4 ratio was calculated for each protein and p-site, respectively. Then all
intensity values of these proteins and p-sites quantified in other six samples of Batch 4 were normalized with the ratio. CUSTOMIZED REFERENCE DATABASES For each batch, only mRNAs with FPKM
≥ 1 in at least one sample were considered, and their corresponding proteins were used to construct a sample-specific reference database. In total, there were 9461, 9619, 8649, and 8610
non-redundant protein sequences reserved for Batch 1, 2, 3, and 4, respectively. For these fly proteins, their reverse decoy sequences were separately generated for each database. Then
MaxQuant (v.1.5.3.30)54 was used for searching each reference database to identify peptides and phosphopeptides from proteomic and phosphoproteomic MS/MS spectra, respectively, with
identical parameters in standard database search. PROTEOMIC AND PHOSPHOPROTEOMIC DATA NORMALIZATION Sample-based normalization was conducted for the raw proteomic and phosphoproteomic data
using the global centering (GC) method58. For each sample, the identified non-phosphorylated peptides and phosphopeptides were re-mapped to 13,558 non-redundant fly protein sequences of the
_Drosophila_ proteome set, and the average intensity value of all proteins and p-sites was normalized to 1 (Mean = 1) for proteomic and phosphoproteomic data sets, respectively. To exclude
the bias of GC normalization for the correlation analysis, we employed four additional methods for normalization of the proteomic data using metaX (http://metax.genomics.cn/)59.
COMPUTATIONAL IDENTIFICATION OF CIRCADIAN OSCILLATIONS Circadian oscillations at different levels were identified by MetaCycle, an integrative R package that incorporated three computational
programs including ARSER, JTK_CYCLE, and Lomb-Scargle60. All three methods were tested, and very few hits were detected by JTK_CYCLE and Lomb-Scargle. Only ARSER recognized a considerable
number of mRNAs, proteins and p-sites to be potentially rhythmic (_p_ value < 0.01). PREDICTION OF SSKSRS WITH GPS Previously, we developed a software package of GPS
(http://gps.biocuckoo.org/)22, which classifies protein kinases into a hierarchical structure at four levels, including group, family, subfamily, and single kinase. In total, GPS contains
144 and 69 individual predictors to predict ssKSRs from primary sequences of proteins for serine/threonine kinases (STKs) and tyrosine kinases (TKs), respectively. From GPS 2.1, we manually
selected 48 and 15 predictors for 153 STKs and 16 TKs in _D. melanogaster_, respectively. To increase the coverage of p-sites with predicted protein kinases, a low threshold was chosen with
a false positive rate (FPR) of 10% for STKs and 15% for TKs, respectively. GPS 2.1 was then used to predict ssKSRs for all 789 p-sites identified by iCMod in all 16 samples of WT flies.
TWO-SIDED HYPERGEOMETRIC TEST In iCMod, two-sided hypergeometric test was adopted for identification of potential circadian kinases, which significantly prefer to modify NCPs rather than
non-oscillated p-sites based on predicted ssKSRs. For each protein kinase _k__i_ (_i_ = 1, 2, …, 169), we defined the following: _N_ = number of p-sites identified by iCMod. _n_ = number of
iCMod p-sites predicted to be phosphorylated by _k__i_. _M_ = number of NCPs. _m_ = number of NCPs predicted to be phosphorylated by _k__i_. The enrichment ratio (E-ratio) of _k__i_ was
computed, and the _p_ value was calculated with two-sided hypergeometric distribution as below: $${\mathrm{E}} - {\mathrm{ratio}} = \frac{m}{M}/\frac{n}{N}\qquad \quad$$ (1) $$p - value =
\mathop {\sum }\limits_{m^{\prime} = m}^n \frac{{\left( {\begin{array}{*{20}{c}} M \\ {m^{\prime} } \end{array}} \right)\left( {\begin{array}{*{20}{c}} {N - M} \\ {n - m^{\prime} }
\end{array}} \right)}}{{\left( {\begin{array}{*{20}{c}} N \\ n \end{array}} \right)}}\left( {E - {\mathrm{ratio}}\, \ge \,1} \right),$$ (2) $$p - value = \mathop {\sum }\limits_{m^{\prime} =
0}^m \frac{{\left( {\begin{array}{*{20}{c}} M \\ {m^{\prime} } \end{array}} \right)\left( {\begin{array}{*{20}{c}} {N - M} \\ {n - m^{\prime} } \end{array}} \right)}}{{\left(
{\begin{array}{*{20}{c}} N \\ n \end{array}} \right)}}\left( {E - {\mathrm{ratio}}\, <\, 1} \right).$$ (3) All protein kinases with substrates significantly enriched in NCPs (_p_ value
< 0.05 and E-ratio > 1) were referred to as potential circadian kinases. Two-sided hypergeometric test was also adopted for the GO-based enrichment analyses at mRNA, protein and
phosphorylation levels. GO annotation files (released on 22 January 2018)61 were downloaded from the EBI Web site (https://www.ebi.ac.uk/QuickGO/) and contained 12,452 fly proteins with at
least one GO term. We mapped 2768 genes with rhythmic mRNA expression collected in CGDB23 and 1255 translationally rhythmic genes identified by translating ribosome affinity purification24
to our cycling mRNA, protein and phosphoprotein data sets identified by iCMod. Two-sided hypergeometric test was performed for the enrichment analysis. RE-CONSTRUCTION OF THE CIRCADIAN
KINASE SIGNAL WEB At the phosphorylation level, a kinase–substrate network was first determined from predicted ssKSRs of NCPs regulated by the seven known circadian kinases and 3 Group 1
kinases. At the protein level, experimentally validated and pre-calculated PPIs from six public databases including BioGRID62, DIP63, MINT64, I2D65, IntAct66, and STRING67, with a total of
2,280,705 PPIs in 18,308 fly proteins, were downloaded and integrated into the kinase–substrate network of the 10 kinases. A cyclic protein identified by iCMod that interacts with at least
one member in the kinase–substrate network was retained and incorporated into the signal web. At the mRNA level, annotated transcription factors in _D. melanogaster_ were downloaded from a
previously developed database AnimalTFDB 3.068 to predict transcription factors that activate the transcription of genes that oscillate at mRNA level
(http://bioinfo.life.hust.edu.cn/AnimalTFDB/). For the prediction of transcription factors based on the presence of transcription factor binding sites (TFBSs), potential transcription factor
binding regions (2000 bp upstream and 500 bp downstream) of genes with circadian mRNAs were extracted from the.gtf file downloaded from Ensembl56, then the TFBS predictor implemented in
AnimalTFDB 3.068 was used. Because AnimalTFDB 3.068 could only predict TFBSs for human transcription factors, their orthologs in _D. melanogaster_ were computationally determined through a
classical approach of reciprocal best hits (RBHs)69. Then, we searched a comprehensive phosphorylation database EPSD (http://epsd.biocuckoo.org/) and retained transcription factors with at
least one experimentally identified p-site. GPS 2.122 was adopted to predict potential ssKSRs for these mapped p-sites, and PPIs between kinases and transcription factors were used to reduce
the false positive hits. Only transcription factors with at least one ssKSR regulated by one or more of the 10 kinases were incorporated into the web. In addition, we incorporated 2092 and
1141 TFBSs of CLK and CYC, respectively, from published data set using a cutoff of read density ≥ 2, as well as kinase–substrate relations published in literature39,70. To model the kinase
network that regulates locomotor rhythm, predicted ssKSRs between the 10 kinases and genes known to function in the clockwork were retained. After filtering by PPIs between kinases and
substrates, the core network contains the 10 kinases, four core clock genes (PER, TIM, CLK, and CYC) and three genes known to regulate the clock (S6KII, SLMB, and CUL-3). CIRCADIAN ANALYSIS
OF LOCOMOTOR ACTIVITY For DD rhythmicity, chi-squared periodogram analyses were performed by Clocklab (Actimetrics, Wilmette, IL). Rhythmic flies were defined as those in which the
chi-squared power was ≥ 10 above the significance line. Period calculations considered all flies with rhythmic power ≥ 10. Dead flies were defined by 0 activity on DD7 and removed from
analysis. TIM IMMUNOFLUORESCENCE QUANTIFICATION For TIM intensity quantification, all slides were coded for sample identity and remained until the numerical analysis stage. The contour of
each cell was circled and staining intensity was measured from single slice image using ImageJ (NIH). REPORTING SUMMARY Further information on research design is available in the Nature
Research Reporting Summary linked to this article. DATA AVAILABILITY The source data underlying Fig. 3h, i, 7b–d, f, and g and Supplementary Figs. 7–9 are provided as a Source Data file. The
RNA-seq data have been deposited into NCBI Sequence Read Archive (SRA, [https://www.ncbi.nlm.nih.gov/sra]) with the data set identifier SRP145574. The raw mass spectrometry proteomics data
have been deposited into the integrated proteome resources (iProX, [http://www.iprox.org/]) with the data set identifier IPX0001218000. The PPI data sets were integrated from six public
databases including BioGRID ([https://thebiogrid.org/], downloaded in 09/2016), DIP ([https://dip.doe-mbi.ucla.edu/dip/Main.cgi], downloaded in 11/2016), MINT
([https://mint.bio.uniroma2.it/], downloaded in 10/2016), I2D ([http://ophid.utoronto.ca/ophidv2.204/], downloaded in 09/2015), IntAct ([https://www.ebi.ac.uk/intact/], downloaded in
10/2016), and STRING ([https://string-db.org/cgi/], v10, downloaded in 11/2016). Known p-sites were downloaded from eight public databases, including dbPAF ([http://dbpaf.biocuckoo.org/],
downloaded in 01/2018), dbPTM 3.0 ([http://dbptm.mbc.nctu.edu.tw/], downloaded in 12/2015), Phospho.ELM ([http://phospho.elm.eu.org/], downloaded in 12/2015), PHOSIDA
([http://141.61.102.18/phosida/index.aspx], downloaded in 10/2015), PhosphoPep 2.0 ([http://www.phosphopep.org/], downloaded in 10/2015), PhosphoSitePlus ([http://www.phosphosite.org/],
downloaded in 09/2015), SysPTM 2.0 ([http://lifecenter.sgst.cn/SysPTM/], downloaded in 10/2015) and UniProt ([http://www.uniprot.org/], downloaded in 12/2015). GO annotation files (released
on 22 January 2018) were downloaded from the EBI Web site (https://www.ebi.ac.uk/QuickGO/). Drosophila proteome databaseset was obtained from UniProt (Version 201706). Known circadian genes
were downloaded from CGDB ([http://cgdb.biocuckoo.org/], downloaded 05/2018). Transcription factors in _D. melanogaster_ were downloaded from AnimalTFDB 3.0
[http://bioinfo.life.hust.edu.cn/AnimalTFDB/], downloaded in 12/2018). The p-sites inof transcription factors were searched against the database EPSD ([http://epsd.biocuckoo.cn/], downloaded
in 12/2018). CODE AVAILABILITY The source code of iCMod has been uploaded to GitHub [https://github.com/CuckooWang/iCMod]. REFERENCES * Bass, J. & Lazar, M. A. Circadian time signatures
of fitness and disease. _Science_ 354, 994–999 (2016). Article ADS CAS PubMed Google Scholar * Li, S. & Zhang, L. Circadian control of global transcription. _Biomed. Res. Int._
2015, 187809 (2015). PubMed PubMed Central Google Scholar * Robles, M. S., Humphrey, S. J. & Mann, M. Phosphorylation is a central mechanism for circadian control of metabolism and
physiology. _Cell Metab._ 25, 118–127 (2017). Article CAS PubMed Google Scholar * Wang, J. et al. Nuclear proteomics uncovers diurnal regulatory landscapes in mouse liver. _Cell Metab._
25, 102–117 (2017). Article PubMed PubMed Central CAS Google Scholar * Wang, Y. et al. A proteomics landscape of circadian clock in mouse liver. _Nat. Commun._ 9, 1553 (2018). Article
ADS PubMed PubMed Central CAS Google Scholar * Hardin, P. E. Molecular genetic analysis of circadian timekeeping in Drosophila. _Adv. Genet._ 74, 141–173 (2011). Article CAS PubMed
PubMed Central Google Scholar * Price, J. L. et al. _double-time_ is a novel _Drosophila_ clock gene that regulates PERIOD protein accumulation. _Cell_ 94, 83–95 (1998). Article CAS
PubMed Google Scholar * Chiu, J. C., Ko, H. W. & Edery, I. NEMO/NLK phosphorylates PERIOD to initiate a time-delay phosphorylation circuit that sets circadian clock speed. _Cell_ 145,
357–370 (2011). Article CAS PubMed PubMed Central Google Scholar * Nakajima, M. et al. Reconstitution of circadian oscillation of cyanobacterial KaiC phosphorylation in vitro. _Science_
308, 414–415 (2005). Article ADS CAS PubMed Google Scholar * Larrondo, L. F., Olivares-Yanez, C., Baker, C. L., Loros, J. J. & Dunlap, J. C. Circadian rhythms. Decoupling circadian
clock protein turnover from circadian period determination. _Science_ 347, 1257277 (2015). Article PubMed PubMed Central CAS Google Scholar * Ullah, S. et al. dbPAF: an integrative
database of protein phosphorylation in animals and fungi. _Sci. Rep._ 6, 23534 (2016). Article ADS CAS PubMed PubMed Central Google Scholar * Huang, K. Y. et al. dbPTM 2016: 10-year
anniversary of a resource for post-translational modification of proteins. _Nucleic Acids Res._ 44, D435–D446 (2016). Article CAS PubMed Google Scholar * Dinkel, H. et al. Phospho.ELM: a
database phosphorylation sites—update 2011. _Nucleic Acids Res._ 39, D261–D267 (2010). Article PubMed PubMed Central CAS Google Scholar * Gnad, F., Gunawardena, J. & Mann, M.
PHOSIDA 2011: the posttranslational modification database. _Nucleic Acids Res._ 39, D253–D260 (2011). Article CAS PubMed Google Scholar * Bodenmiller, B. & Aebersold, R.
Phosphoproteome resource for systems biology research. _Methods Mol. Biol._ 694, 307–322 (2011). Article CAS PubMed Google Scholar * Hornbeck, P. V. et al. PhosphoSitePlus, 2014:
mutations, PTMs and recalibrations. _Nucleic Acids Res._ 43, D512–D520 (2015). Article CAS PubMed Google Scholar * Li, J. et al. SysPTM 2.0: an updated systematic resource for
post-translational modification. _Database (Oxford)_ 2014, bau025 (2014). Article PubMed PubMed Central CAS Google Scholar * The UniProt, C. UniProt: the universal protein
knowledgebase. _Nucleic Acids Res._ 45, D158–D169 (2017). Article CAS Google Scholar * Mortazavi, A., Williams, B. A., McCue, K., Schaeffer, L. & Wold, B. Mapping and quantifying
mammalian transcriptomes by RNA-Seq. _Nat. Methods_ 5, 621–628 (2008). Article CAS PubMed Google Scholar * Uhlen, M. et al. Proteomics. Tissue-based map of the human proteome. _Science_
347, 1260419 (2015). Article PubMed CAS Google Scholar * Yang, R. & Su, Z. Analyzing circadian expression data by harmonic regression based on autoregressive spectral estimation.
_Bioinformatics_ 26, i168–i174 (2010). Article MathSciNet CAS PubMed PubMed Central Google Scholar * Xue, Y. et al. GPS 2.1: enhanced prediction of kinase-specific phosphorylation
sites with an algorithm of motif length selection. _Protein Eng. Des. Sel._ 24, 255–260 (2011). Article CAS PubMed Google Scholar * Li, S. et al. CGDB: a database of circadian genes in
eukaryotes. _Nucleic Acids Res._ 45, D397–D403 (2017). CAS PubMed Google Scholar * Huang, Y., Ainsley, J. A., Reijmers, L. G. & Jackson, F. R. Translational profiling of clock cells
reveals circadianly synchronized protein synthesis. _PLoS Biol._ 11, e1001703 (2013). Article PubMed PubMed Central CAS Google Scholar * Martinek, S., Inonog, S., Manoukian, A. S. &
Young, M. W. A role for the segment polarity gene shaggy/GSK-3 in the Drosophila circadian clock. _Cell_ 105, 769–779 (2001). Article CAS PubMed Google Scholar * Zheng, X. & Sehgal,
A. AKT and TOR signaling set the pace of the circadian pacemaker. _Curr. Biol._ 20, 1203–1208 (2010). Article CAS PubMed PubMed Central Google Scholar * Dusik, V. et al. The MAP kinase
p38 is part of Drosophila melanogaster’s circadian clock. _PLoS Genet._ 10, e1004565 (2014). Article PubMed PubMed Central CAS Google Scholar * Kalamegham, R., Sturgill, D., Siegfried,
E. & Oliver, B. Drosophila mojoless, a retroposed GSK-3, has functionally diverged to acquire an essential role in male fertility. _Mol. Biol. Evol._ 24, 732–742 (2007). Article CAS
PubMed Google Scholar * Hsu, J. C. & Perrimon, N. A temperature-sensitive MEK mutation demonstrates the conservation of the signaling pathways activated by receptor tyrosine kinases.
_Genes Dev._ 8, 2176–2187 (1994). Article CAS PubMed Google Scholar * Riesgo-Escovar, J. R., Jenni, M., Fritz, A. & Hafen, E. The Drosophila Jun-N-terminal kinase is required for
cell morphogenesis but not for DJun-dependent cell fate specification in the eye. _Genes Dev._ 10, 2759–2768 (1996). Article CAS PubMed Google Scholar * Qi, H. et al. Asator, a
tau-tubulin kinase homolog in Drosophila localizes to the mitotic spindle. _Dev. Dyn._ 238, 3248–3256 (2009). Article CAS PubMed Google Scholar * Emery, P., So, W. V., Kaneko, M., Hall,
J. C. & Rosbash, M. CRY, a Drosophila clock and light-regulated cryptochrome, is a major contributor to circadian rhythm resetting and photosensitivity. _Cell_ 95, 669–679 (1998).
Article CAS PubMed Google Scholar * Dietzl, G. et al. A genome-wide transgenic RNAi library for conditional gene inactivation in Drosophila. _Nature_ 448, 151–156 (2007). Article ADS
CAS PubMed Google Scholar * Ni, J. Q. et al. A genome-scale shRNA resource for transgenic RNAi in Drosophila. _Nat. Methods_ 8, 405–407 (2011). Article CAS PubMed PubMed Central
Google Scholar * Kuranaga, E. et al. Reaper-mediated inhibition of DIAP1-induced DTRAF1 degradation results in activation of JNK in Drosophila. _Nat. Cell Biol._ 4, 705–710 (2002). Article
CAS PubMed Google Scholar * Gault, W. J., Olguin, P., Weber, U. & Mlodzik, M. Drosophila CK1-gamma, gilgamesh, controls PCP-mediated morphogenesis through regulation of vesicle
trafficking. _J. Cell Biol._ 196, 605–621 (2012). Article CAS PubMed PubMed Central Google Scholar * Blanchard, F. J. et al. The transcription factor Mef2 is required for normal
circadian Behavior in drosophila. _J. Neurosci._ 30, 5855–5865 (2010). Article CAS PubMed PubMed Central Google Scholar * Ling, J., Dubruille, R. & Emery, P. KAYAK-alpha modulates
circadian transcriptional feedback loops in Drosophila pacemaker neurons. _J. Neurosci._ 32, 16959–16970 (2012). Article CAS PubMed PubMed Central Google Scholar * Meireles-Filho, A. C.
A., Bardet, A. F., Yanez-Cuna, J. O., Stampfel, G. & Stark, A. cis-regulatory requirements for tissue-specific programs of the circadian clock. _Curr. Biol._ 24, 1–10 (2014). Article
CAS PubMed Google Scholar * Hung, H. C., Maurer, C., Kay, S. A. & Weber, F. Circadian transcription depends on limiting amounts of the transcription co-activator nejire/CBP. _J. Biol.
Chem._ 282, 31349–31357 (2007). Article CAS PubMed Google Scholar * Grima, B., Dognon, A., Lamouroux, A., Chelot, E. & Rouyer, F. CULLIN-3 controls TIMELESS oscillations in the
Drosophila circadian clock. _PLoS Biol._ 10, e1001367 (2012). Article CAS PubMed PubMed Central Google Scholar * Top, D., Harms, E., Syed, S., Adams, E. L. & Saez, L. GSK-3 and CK2
kinases converge on timeless to regulate the master clock. _Cell Rep._ 16, 357–367 (2016). Article CAS PubMed PubMed Central Google Scholar * Beck, K., Hovhanyan, A., Menegazzi, P.,
Helfrich-Forster, C. & Raabe, T. Drosophila RSK influences the pace of the circadian clock by negative regulation of protein kinase shaggy activity. _Front. Mol. Neurosci._ 11, 122
(2018). Article PubMed PubMed Central CAS Google Scholar * Stoleru, D., Peng, Y., Nawathean, P. & Rosbash, M. A resetting signal between Drosophila pacemakers synchronizes morning
and evening activity. _Nature_ 438, 238–242 (2005). Article ADS CAS PubMed Google Scholar * Hogrebe, A. et al. Benchmarking common quantification strategies for large-scale
phosphoproteomics. _Nat. Commun._ 9, 1045 (2018). Article ADS PubMed PubMed Central CAS Google Scholar * Zhao, J. et al. Drosophila clock can generate ectopic circadian clocks. _Cell_
113, 755–766 (2003). Article CAS PubMed Google Scholar * Shacter, E., Chock, P. B. & Stadtman, E. R. Energy consumption in a cyclic phosphorylation/dephosphorylation cascade. _J.
Biol. Chem._ 259, 12260–12264 (1984). CAS PubMed Google Scholar * Hughes, M. E., Grant, G. R., Paquin, C., Qian, J. & Nitabach, M. N. Deep sequencing the circadian and diurnal
transcriptome of Drosophila brain. _Genome Res._ 22, 1266–1281 (2012). Article CAS PubMed PubMed Central Google Scholar * Lam, V. H. et al. CK1alpha collaborates with DOUBLETIME to
regulate PERIOD function in the drosophila circadian clock. _J. Neurosci._ 38, 10631–10643 (2018). Article CAS PubMed PubMed Central Google Scholar * Abruzzi, K. C. et al. Drosophila
CLOCK target gene characterization: implications for circadian tissue-specific gene expression. _Genes Dev._ 25, 2374–2386 (2011). Article CAS PubMed PubMed Central Google Scholar *
Abruzzi, K. C. et al. RNA-seq analysis of Drosophila clock and non-clock neurons reveals neuron-specific cycling and novel candidate neuropeptides. _PLoS Genet._ 13, e1006613 (2017). Article
PubMed PubMed Central CAS Google Scholar * Ko, H. W. et al. A hierarchical phosphorylation cascade that regulates the timing of PERIOD nuclear entry reveals novel roles for
proline-directed kinases and GSK-3beta/SGG in circadian clocks. _J. Neurosci._ 30, 12664–12675 (2010). Article CAS PubMed PubMed Central Google Scholar * Konopka, R. J. & Benzer, S.
Clock mutants of Drosophila melanogaster. _Proc. Natl Acad. Sci._ 68, 2112–2116 (1971). Article ADS CAS PubMed PubMed Central Google Scholar * Tyanova, S., Temu, T. & Cox, J. The
MaxQuant computational platform for mass spectrometry-based shotgun proteomics. _Nat. Protoc._ 11, 2301–2319 (2016). Article CAS PubMed Google Scholar * Emery, P. et al. Drosophila CRY
is a deep brain circadian photoreceptor. _Neuron_ 26, 493–504 (2000). Article CAS PubMed Google Scholar * Zerbino, D. R. et al. Ensembl 2018. _Nucleic Acids Res._ 46, D754–D761 (2018).
Article CAS PubMed Google Scholar * Trapnell, C. et al. Differential gene and transcript expression analysis of RNA-seq experiments with TopHat and Cufflinks. _Nat. Protoc._ 7, 562–578
(2012). Article CAS PubMed PubMed Central Google Scholar * Kauko, O. et al. Label-free quantitative phosphoproteomics with novel pairwise abundance normalization reveals synergistic RAS
and CIP2A signaling. _Sci. Rep._ 5, 13099 (2015). Article ADS CAS PubMed PubMed Central Google Scholar * Wen, B., Mei, Z., Zeng, C. & Liu, S. metaX: a flexible and comprehensive
software for processing metabolomics data. _BMC Bioinformatics_ 18, 183 (2017). Article PubMed PubMed Central CAS Google Scholar * Wu, G., Anafi, R. C., Hughes, M. E., Kornacker, K.
& Hogenesch, J. B. MetaCycle: an integrated R package to evaluate periodicity in large scale data. _Bioinformatics_ 32, 3351–3353 (2016). Article CAS PubMed PubMed Central Google
Scholar * Huntley, R. P. et al. The GOA database: gene Ontology annotation updates for 2015. _Nucleic Acids Res._ 43, D1057–D1063 (2015). Article CAS PubMed Google Scholar *
Chatr-Aryamontri, A. et al. The BioGRID interaction database: 2017 update. _Nucleic Acids Res._ 45, D369–D379 (2017). Article CAS PubMed Google Scholar * Salwinski, L. et al. The
Database of Interacting Proteins: 2004 update. _Nucleic Acids Res._ 32, D449–D451 (2004). Article CAS PubMed PubMed Central Google Scholar * Licata, L. et al. MINT, the molecular
interaction database: 2012 update. _Nucleic Acids Res._ 40, D857–D861 (2012). Article CAS PubMed Google Scholar * Brown, K. R. & Jurisica, I. Unequal evolutionary conservation of
human protein interactions in interologous networks. _Genome Biol._ 8, R95 (2007). Article PubMed PubMed Central CAS Google Scholar * Orchard, S. et al. The MIntAct project–IntAct as a
common curation platform for 11 molecular interaction databases. _Nucleic Acids Res._ 42, D358–D363 (2014). Article CAS PubMed Google Scholar * Szklarczyk, D. et al. The STRING database
in 2017: quality-controlled protein-protein association networks, made broadly accessible. _Nucleic Acids Res._ 45, D362–D368 (2017). Article CAS PubMed Google Scholar * Hu, H. et al.
AnimalTFDB 3.0: a comprehensive resource for annotation and prediction of animal transcription factors. _Nucleic Acids Res._ 47, D33–D38 (2019). Article CAS PubMed Google Scholar *
Tatusov, R. L., Koonin, E. V. & Lipman, D. J. A genomic perspective on protein families. _Science_ 278, 631–637 (1997). Article ADS CAS PubMed Google Scholar * Kim, E. Y. &
Edery, I. Balance between DBT/CKI epsilon kinase and protein phosphatase activities regulate phosphorylation and stability of Drosophila CLOCK protein. _Proc. Natl Acad. Sci._ 103, 6178–6183
(2006). Article ADS CAS PubMed PubMed Central Google Scholar Download references ACKNOWLEDGEMENTS This work was supported by grants from the Natural Science Foundation of China
(31930021, 31970633, 31671215, 31471125, 31671360, and 31801095), the Special Project on Precision Medicine under the National Key R&D Program (2017YFC0906600 and 2018YFC0910500), the
National Program for Support of Top-Notch Young Professionals, Young Changjiang Scholars Program of China, the program for HUST Academic Frontier Youth Team, and the Fundamental Research
Funds for the Central Universities (2019kfyRCPY043). We would like to thank Drs. Joanna Chiu (UC Davis), Yong Zhang (Univ. of Nevada, Reno), Ravi Allada (Northwestern University) and
Guanghui Wang (Soochow University) for reagents used in this study. We thank Dr. Xi Zhou (Wuhan University) for _Drosophila_ S2 cells used in this study. We thank Dr. Bing Zhang (Baylor
College of Medicine) for his helpful comments. We would also like to thank Tsinghua Fly Center for providing fly stocks. AUTHOR INFORMATION Author notes * These authors contributed equally:
Chenwei Wang, Ke Shui. AUTHORS AND AFFILIATIONS * Key Laboratory of Molecular Biophysics of Ministry of Education, Hubei Bioinformatics and Molecular Imaging Key Laboratory, Center for
Artificial Intelligence Biology, College of Life Science and Technology, Huazhong University of Science and Technology, Wuhan, Hubei, 430074, China Chenwei Wang, Ke Shui, Shanshan Ma,
Shaofeng Lin, Ying Zhang, Wankun Deng, Haodong Xu, Hui Hu, Anyuan Guo, Yu Xue & Luoying Zhang * Department of Molecular and Human Genetics, Lester and Sue Smith Breast Center, Baylor
College of Medicine, Houston, TX, 77030, USA Bo Wen * Institute of Brain Research, Huazhong University of Science and Technology, Wuhan, Hubei, 430074, China Yu Xue & Luoying Zhang
Authors * Chenwei Wang View author publications You can also search for this author inPubMed Google Scholar * Ke Shui View author publications You can also search for this author inPubMed
Google Scholar * Shanshan Ma View author publications You can also search for this author inPubMed Google Scholar * Shaofeng Lin View author publications You can also search for this author
inPubMed Google Scholar * Ying Zhang View author publications You can also search for this author inPubMed Google Scholar * Bo Wen View author publications You can also search for this
author inPubMed Google Scholar * Wankun Deng View author publications You can also search for this author inPubMed Google Scholar * Haodong Xu View author publications You can also search
for this author inPubMed Google Scholar * Hui Hu View author publications You can also search for this author inPubMed Google Scholar * Anyuan Guo View author publications You can also
search for this author inPubMed Google Scholar * Yu Xue View author publications You can also search for this author inPubMed Google Scholar * Luoying Zhang View author publications You can
also search for this author inPubMed Google Scholar CONTRIBUTIONS Y.X. and L.Z. initiated the project and oversaw all aspects of the project. C.W.W carried out the data analysis and
prediction. K.S. and S.S.M. performed the experiments. S.F.L., Y.Z., B.W., W.K.D., H.D.X., H.H., and A.Y.G. put forward helpful suggestions for the analysis of data. Y.X. and L.Z. wrote the
manuscript with input from all the authors. All authors reviewed and approved the manuscript for publication. CORRESPONDING AUTHORS Correspondence to Yu Xue or Luoying Zhang. ETHICS
DECLARATIONS COMPETING INTERESTS The authors declare no competing interests. ADDITIONAL INFORMATION PEER REVIEW INFORMATION _Nature Communications_ thanks Rendong Yang and other anonymous
reviewer(s) for their contribution to the peer review of this work. Peer reviewer reports are available. PUBLISHER’S NOTE Springer Nature remains neutral with regard to jurisdictional claims
in published maps and institutional affiliations. SUPPLEMENTARY INFORMATION SUPPLEMENTARY INFORMATION PEER REVIEW FILE DESCRIPTION OF SUPPLEMENTARY FILES SUPPLEMENTARY DATA 1 SUPPLEMENTARY
DATA 2 SUPPLEMENTARY DATA 3 SUPPLEMENTARY DATA 4 SUPPLEMENTARY DATA 5 SUPPLEMENTARY DATA 6 SUPPLEMENTARY DATA 7 SUPPLEMENTARY DATA 8 SUPPLEMENTARY DATA 9 REPORTING SUMMARY RIGHTS AND
PERMISSIONS OPEN ACCESS This article is licensed under a Creative Commons Attribution 4.0 International License, which permits use, sharing, adaptation, distribution and reproduction in any
medium or format, as long as you give appropriate credit to the original author(s) and the source, provide a link to the Creative Commons license, and indicate if changes were made. The
images or other third party material in this article are included in the article’s Creative Commons license, unless indicated otherwise in a credit line to the material. If material is not
included in the article’s Creative Commons license and your intended use is not permitted by statutory regulation or exceeds the permitted use, you will need to obtain permission directly
from the copyright holder. To view a copy of this license, visit http://creativecommons.org/licenses/by/4.0/. Reprints and permissions ABOUT THIS ARTICLE CITE THIS ARTICLE Wang, C., Shui,
K., Ma, S. _et al._ Integrated omics in _Drosophila_ uncover a circadian kinome. _Nat Commun_ 11, 2710 (2020). https://doi.org/10.1038/s41467-020-16514-z Download citation * Received: 24
January 2019 * Accepted: 06 May 2020 * Published: 01 June 2020 * DOI: https://doi.org/10.1038/s41467-020-16514-z SHARE THIS ARTICLE Anyone you share the following link with will be able to
read this content: Get shareable link Sorry, a shareable link is not currently available for this article. Copy to clipboard Provided by the Springer Nature SharedIt content-sharing
initiative