Play all audios:
ABSTRACT Extranodal NK/T-cell lymphoma (ENKTCL) is an Epstein-Barr virus (EBV)-related neoplasm preferentially involving the upper aerodigestive tract. Here we show that NK-cell-specific
_Trp53_ disruption in mice leads to the development of NK-cell lymphomas after long latency, which involve not only the hematopoietic system but also the salivary glands. Before tumor onset,
_Trp53_ knockout causes extensive gene expression changes, resulting in immature NK-cell expansion, exclusively in the salivary glands. Both human and murine NK-cell lymphomas express
tissue-resident markers, suggesting tissue-resident NK cells as their cell-of-origin. Murine NK-cell lymphomas show recurrent _Myc_ amplifications and upregulation of MYC target gene
signatures. EBV-encoded latent membrane protein 1 expression accelerates NK-cell lymphomagenesis and causes diverse microenvironmental changes, particularly myeloid propagation, through
interferon-γ signaling. In turn, myeloid cells support tumor cells via CXCL16-CXCR6 signaling and its inhibition is effective against NK-cell tumors in vivo. Remarkably, KLRG1-expressing
cells expand in the tumor and are capable of repopulating tumors in secondary recipients. Furthermore, targeting KLRG1 alone or combined with MYC inhibition using an eIF4 inhibitor is
effective against NK-cell tumors. Therefore, our observations provide insights into the pathogenesis and highlight potential therapeutic targets, including CXCL16, KLRG1, and MYC, in ENKTCL,
which can help improve its diagnostic and therapeutic strategies. SIMILAR CONTENT BEING VIEWED BY OTHERS GENOMIC PROFILING IDENTIFIES DISTINCT GENETIC SUBTYPES IN EXTRA-NODAL NATURAL
KILLER/T-CELL LYMPHOMA Article 13 June 2022 VIRAL TRANSDUCTION OF PRIMARY HUMAN LYMPHOMA B CELLS REVEALS MECHANISMS OF NOTCH-MEDIATED IMMUNE ESCAPE Article Open access 20 October 2022 BCOR
LOSS PROMOTES RICHTER TRANSFORMATION OF CHRONIC LYMPHOCYTIC LEUKEMIA ASSOCIATED WITH NOTCH1 ACTIVATION IN MICE Article Open access 20 March 2025 INTRODUCTION Extranodal NK/T-cell lymphoma
(ENKTCL) is an aggressive NK/T-cell neoplasm, which is characterized by angiodestruction, cytotoxic phenotype, and constant association with Epstein-Barr virus (EBV)1,2. ENKTCL is prevalent
among Asian and South American populations and preferentially involves the upper aerodigestive tract, including the nasal cavity and nasopharynx. However, what mechanisms underlie such site
predilection and which NK-cell subpopulation is responsible for ENKTCL remain unclear. The therapeutic approach to ENKTCL presents substantial challenges2,3; traditional chemotherapy is
ineffective due to P-glycoprotein overexpression. Despite the use of current standard regimens containing L-asparaginase, advanced-stage ENKTCL has a poor prognosis. Therefore, exploring the
pathogenic mechanisms and developing novel therapeutic strategies are required in ENKTCL. ENKTCL generally expresses latent membrane protein (LMP) 1 and 2 and EBV nuclear antigen 1
(EBNA1)4,5,6. Although their precise oncogenic functions remain unknown, these viral proteins, particularly LMP1, contribute to NK/T-cell transformation. Besides, somatic alterations are
essential for the ENKTCL development. Several studies revealed the genetic landscape of ENKTCL and identified recurrent somatic alterations, including those affecting tumor suppressors (such
as _TP53_)7,8,9. However, whether and how these viral proteins and genetic alterations contribute to the ENKTCL pathogenesis in vivo remains unclear. ENKTCL is occasionally accompanied by
heavy inflammatory cell infiltration1. In addition, tumor immune microenvironment subtypes are reported to be associated with disease severity10,11. Furthermore, ENKTCL harbors frequent
alterations in immune-related molecules, with _CD274_ structural variations being the most frequent8,9. These observations suggest the importance of the tumor immune microenvironment, but
its role and related molecular network remain elusive. An important limitation of the field is the lack of a genetically engineered mouse model (GEMM) recapitulating genetic events in human
ENKTCL. Although cell lines and xenografts have been developed in ENKTCL12,13, these models are heterogeneous and unable to reproduce the tumor immune microenvironment. In this work, to
model ENKTCL in mice, we have generated GEMM harboring NK-cell-specific _Trp53_ deletion. This model develops NK-cell lymphomas preferentially involving the salivary glands (SG), which is
accelerated by _LMP1_ expression. Using these models, we reveal the cell-of-origin, microenvironmental changes, and therapeutic targets of ENKTCL. RESULTS _TRP53_ LOSS INDUCES NK-CELL
LYMPHOMAS FREQUENTLY INVOLVING THE SALIVARY GLANDS To model ENKTCL in mice, we crossed mice carrying two floxed _Trp53_ alleles (_Trp53_flox/flox) with mice expressing iCre recombinase under
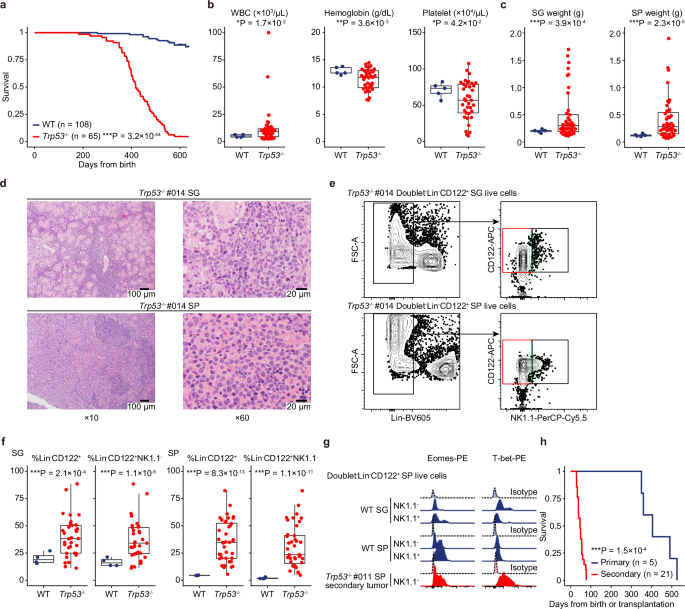
the _Ncr1_ promoter (_Ncr1-iCre_) to generate NK-cell-specific _Trp53_ conditional knockout mice (referred subsequently as _Trp53_−/−) (Supplementary Fig. 1a). Most (81.5 %) of _Trp53_−/−
mice survived more than a year but died earlier than wild-type (WT) mice, with a median survival of 417 days (Fig. 1a). Complete blood count (CBC) showed mild leukocytosis, anemia, and
thrombocytopenia in _Trp53_−/− mice (Fig. 1b). Macroscopic evaluation demonstrated the enlargement of the SG, in addition to hepatosplenomegaly and occasional abdominal mass, in _Trp53_−/−
mice (Fig. 1c and Supplementary Fig. 1b), suggesting that these mice developed a lethal hematopoietic neoplasm involving the SG. Histological examination revealed large-sized atypical
lymphoid infiltration in the SG and spleen (SP) (Fig. 1d and Supplementary Fig. 1c). Flow cytometry of the tumors identified a population of Lin (Gr1, Ter119, CD19, and CD3)−CD122+NK1.1−
cells, suggesting that these tumors were of NK-cell origin (Fig. 1e). The proportion of these cells was significantly increased in both the SG and SP in _Trp53_−/− tumor-bearing mice
compared with age-matched WT controls (Fig. 1f and Supplementary Fig. 1d). These cells also expressed NK-cell transcription factors (such as Eomes and T-bet), consistent with a recent report
analyzing human ENKTCL13. They also showed variable expressions of lineage-committed NK-cell markers (such as CD43, CD146 [MCAM], CD226 [DNAM1], and Ly6C), but had no or almost no
expressions of CD62L and CD11b (Fig. 1g and Supplementary Fig. 1e). To confirm their lymphomagenic potential, we transplanted _Trp53_−/− tumor cells into lethally irradiated recipients, all
of which developed NK-cell tumors and died within 77 days (Fig. 1h). Taken together, NK-cell-specific _Trp53_ disruption induces transplantable NK-cell lymphomas after long latency that
frequently involve the SG and the hematopoietic system. _TRP53_ DISRUPTION PREDOMINANTLY AFFECTS TISSUE-RESIDENT NK CELLS IN THE SALIVARY GLANDS SG NK cells are tissue-resident NK cells that
are distinct from conventional NK cells in the peripheral blood (PB), SP, and bone marrow (BM)14. To determine the cell-of-origin of _Trp53_−/− NK-cell lymphomas, we investigated whether
and how _Trp53_ deficiency has different effects on NK cells across these tissues in the pre-tumor state. CBC showed no differences between WT and _Trp53_−/− mice at eight weeks old
(Supplementary Fig. 2a, b). Remarkably, _Trp53_−/− mice exhibited increased Lin−CD122+NK1.1− cells and decreased Lin−CD122+NK1.1+CD11b+ cells in the SG, while there was no difference in the
frequency of NK-cell subpopulations in the SP and BM between WT and _Trp53_−/− mice (Fig. 2a and Supplementary Fig. 2c), suggesting that _Trp53_ disruption increases immature NK cells
exclusively in the SG. Cell-cycle analysis revealed an increase of Ki-67+ cells only in the SG from _Trp53_−/− mice, with no difference in the SP and BM (Fig. 2b and Supplementary Fig. 2d).
By contrast, there was no difference in the apoptotic status in all examined tissues (Supplementary Fig. 2e). These results suggest that _Trp53_ deficiency exerts differential effects on
conventional circulating NK cells in the SP and BM and tissue-resident NK cells in the SG. To investigate gene expression profiles underlying phenotypic differences in NK cells across
tissues, we performed RNA-sequencing (RNA-seq) analysis of Lin−CD122+ NK cells from the SG, SP, and BM of WT and _Trp53_−/− mice (Supplementary Fig. 2f). Importantly, there were almost no
differentially expressed genes between WT and _Trp53_−/− NK cells in the SP and BM, whereas 81 genes were upregulated in _Trp53_−/− SG NK cells (Fig. 2c). Gene set enrichment analysis (GSEA)
demonstrated overrepresentation of extracellular matrix (ECM)-associated signatures exclusively in the SG (Fig. 2d, Supplementary Fig. 2g, h, and Supplementary Data 1). We also evaluated
RNA-seq of human samples, which revealed upregulation of 162 signatures in ENKTCL tumors compared with normal NK cells (Supplementary Data 2, 3). Among them, 15 signatures were related to
ECM dynamics (Supplementary Fig. 2i and Supplementary Data 3). These results suggest that _Trp53_ disruption induces ECM-associated transcriptomic changes in the SG, which are characteristic
of ENKTCL. The predominant effect of _Trp53_ disruption on tissue-resident NK cells in the SG led us to evaluate characteristic phenotypes of tissue-resident NK cells in _Trp53_−/− tumors.
Similar to SG NK cells, these tumors highly expressed tissue-resident markers, such as CD69 and CD49a14, in both the SG and SP (Fig. 2e). We then evaluated the origin of human ENKTCL cells
using RNA-seq data, which demonstrated upregulation of a tissue-resident NK-cell signature, including _ITGA1_ (encoding CD49a) and _CCR5_ expressions, and downregulation of a circulating
NK-cell signature, including _S1PR5_ and _CX3CR1_ expressions, in ENKTCL tumors (Fig. 2f, Supplementary Fig. 2j, and Supplementary Data 4). High expression of CD49a was detected in human
ENKTCL by immunohistochemistry (Fig. 2g and Supplementary Fig. 2k). These results suggest that human and murine ENKTCL cells are derived from tissue-resident NK cells. NK-CELL TUMORS SHOW
GENOMIC AND TRANSCRIPTOMIC ALTERATIONS INVOLVING _MYC_ To investigate genetic profiles of _Trp53_−/− tumors, we performed whole-exome sequencing (WES), which confirmed the clonality (defined
as having >3 mutations) in 7 out of 11 tumors (Supplementary Fig. 3a–c). Although these tumors harbored a median number of 23 (range, 11‒61) non-synonymous mutations, the mutant allele
frequency was generally low, suggestive of low tumor content. These tumors showed a similar pattern of copy number alterations (CNAs), probably reflecting the _Trp53_-induced genomic
instability (Supplementary Fig. 3d). Particularly, two _Trp53_−/− tumors harbored focal amplifications involving _Myc_, whose activation is frequently observed in human ENKTCL9,15. By
contrast, no CNAs were detected in the remaining four tumors. The absence of the _Trp53_ deletion confirmed no or few neoplastic cells in these tumors (Supplementary Fig. 3b). However,
despite the slightly longer latency, all recipients transplanted with clonally unconfirmed tumor cells developed NK-cell neoplasms (Supplementary Fig. 3e). Moreover, WES analysis detected
somatic alterations in secondary tumors (Supplementary Fig. 3c), suggesting that these tumors contain a small proportion of neoplastic clonal cells. RNA-seq showed the significant enrichment
of proliferation-related and MYC target gene signatures in _Trp53_−/− tumors (Supplementary Fig. 3f and Supplementary Data 5), which is consistent with upregulated signatures in human
_TP53_-mutated ENKTCL samples (Supplementary Fig. 3g and Supplementary Data 6). These results suggest that _Myc_ is genomically and/or transcriptionally deregulated in _Trp53_-deficient
NK-cell tumors. LMP1 ACCELERATES THE TUMOR DEVELOPMENT AND ALTERS THE IMMUNE MICROENVIRONMENT Although EBV-encoded LMP1 is involved in ENKTCL pathogenesis4,5,6, its in vivo role in NK-cell
lymphomagenesis remains unknown. To address this, we crossed _Ncr1-iCre_; _Trp53_flox/flox (_Trp53_−/−) mice to _LMP1_stop conditional knock-in (_LMP1_+) mice to generate _Ncr1-iCre_;
_Trp53_flox/flox; _LMP1_stop (_Trp53_−/−_LMP1_+). _Trp53_−/−_LMP1_+ mice developed a lethal NK-cell lymphoma with a median survival of 258 days, which was significantly shorter than that of
mice with either disease allele alone (_Trp53_−/− or _LMP1_+) (Fig. 3a). Thus, _Trp53_ loss and _LMP1_ expression cooperate to induce NK-cell lymphomagenesis. We observed severer
thrombocytopenia in _Trp53_−/−_LMP1_+ mice than _Trp53_−/− mice, while there was no difference in WBC and hemoglobin counts and the extent of organ enlargement (Fig. 3b and Supplementary
Fig. 4a). Consistent with _Trp53_−/− tumors, flow cytometric analysis showed a population of Lin−CD122+NK1.1− cells in _Trp53_−/−_LMP1_+ tumors (Supplementary Fig. 4b). Pathologically,
_Trp53_−/−_LMP1_+ tumors showed more extensive myeloid infiltration and coagulative necrosis associated with vascular destruction, resembling the pathology of human ENKTCL (Fig. 3c and
Supplementary Fig. 4c). WES analysis showed a comparable number of somatic mutations between _Trp53_−/− and _Trp53_−/−_LMP1_+ tumors (Fig. 3d and Supplementary Fig. 4d). By contrast,
_Trp53_−/−_LMP1_+ tumors had a significantly smaller number of CNAs than _Trp53_−/− tumors, although a similar CNA pattern, including _Myc_ amplification, was observed between them (Fig. 3d
and Supplementary Fig. 4e–g). These results suggest that _LMP1_ expression can substitute for secondary CNAs in NK-cell lymphomagenesis. We next characterized mutational processes in murine
NK-cell tumors and revealed that clock-like (84.7%) and reactive oxygen species (15.3%) signatures were dominant, which is highly concordant with those found in human ENKTCL (Supplementary
Fig. 4h). DIVERSE CHANGES IN THE MULTICELLULAR ECOSYSTEM OF MURINE NK-CELL TUMORS As neoplastic tumor cells accounted for only a limited fraction of cells, we elucidated the complexity of
the tumor immune microenvironment of murine NK-cell tumors. We constructed single-cell (sc) transcriptomic maps of 18,542 malignant and 66,008 nonmalignant CD45+ cells from 9 _Trp53_−/− and
4 _Trp53_−/−_LMP1_+ tumors and SG and SP from 2 WT and 2 _Trp53_−/− mice at pre-tumor stage, identifying 20 clusters, consisting of 7 malignant and 13 nonmalignant ones (Fig. 4a, b,
Supplementary Fig. 5a–f, and Supplementary Data 7, 8). Nonmalignant clusters accounted for the majority of cells and consisted of 2 T-cell, 4 B-cell, 1 NK-cell, and 5 myeloid cell clusters
based on canonical lineage markers. Compared with pre-tumor samples, _Trp53_−/− tumors exhibited a decreased proportion of CD4+ and CD8+ T cells, NK cells, and myeloid cells, while B cells
were slightly increased in the extranodal tissues (including the SG and other sites) and SP (Fig. 4c). Importantly, myeloid cells were markedly increased in both SG and SP from
_Trp53_−/−_LMP1_+ tumors, whereas the proportion of other nonmalignant clusters was almost comparable between _Trp53_−/− and _Trp53_−/−_LMP1_+ tumors (Supplementary Data 9). These findings
were confirmed by flow cytometric analysis (Fig. 4d). In addition, deconvolution of RNA-seq data of human ENKTCL revealed that myeloid cell infiltration was observed in all tumors, with
significantly higher proportions compared with normal tonsils (Supplementary Fig. 5g, h and Supplementary Data 10). These observations suggest that LMP1 predominantly induces myeloid
propagation in the tumor microenvironment. To further characterize immune cell clusters, we performed subclustering, which identified 3 CD4+ T-cell (naive, effector/memory [EM], and Treg), 5
CD8+ T-cell (naive, central/memory [CM], EM, resident/memory [RM], and exhausted [EX]), and 3 B-cell (immature, mature, and plasmablasts) subclusters (Supplementary Fig. 5i, j and
Supplementary Data 8). Both _Trp53_−/− and _Trp53_−/−_LMP1_+ tumors showed decreased naive T cells, whereas CD8+ T EX cells were increased in the extranodal tissues from _Trp53_−/−_LMP1_+
tumors (Fig. 4c and Supplementary Data 9), suggesting enhanced T-cell exhaustion in _Trp53_−/−_LMP1_+ tumors. LMP1 INDUCES MASSIVE EXPANSION OF TUMOR-PROMOTING MYELOID CELLS As the most
prominent change in the tumor microenvironment was myeloid expansion by _LMP1_ expression, we focused on myeloid clusters in NK-cell tumors. The myeloid subclusters included monocyte (Mono),
macrophage (Macro), type 1 and 2 conventional dendritic cell (cDC1 and cDC2), plasmacytoid DC (pDC), mature DC enriched in immunoregulatory molecules (mregDC), and myeloid-derived
suppressor cell (MDSC) (Fig. 5a, Supplementary Fig. 6a, and Supplementary Data 8). A higher proportion of Mono and cDC1 were observed in _Trp53_−/−_LMP1_+ tumors from both the extranodal
tissues and SP, whereas MDSC was strongly enriched in the SP (Fig. 5b and Supplementary Data 9). By contrast, Macro, pDC, and mregDC were decreased in the SP from _Trp53_−/−_LMP1_+ tumors.
The increase of cDC1 was confirmed by flow cytometric analysis (Supplementary Fig. 6b). GSEA analysis showed upregulation of metabolic pathways in various myeloid subclusters from _Trp53_−/−
tumors (Fig. 5c and Supplementary Data 11). On the other hand, interferon (IFN)-α/γ response and TNFα/NF-κB signaling were upregulated in _Trp53_−/−_LMP1_+ tumors (Fig. 5c and Supplementary
Data 12). IFN-γ response activation was also observed in several T- and B-cell subclusters (Supplementary Fig. 6c and Supplementary Data 12), suggesting that enhanced IFN-γ signaling is
pervasive across immune cells of _Trp53_−/−_LMP1_+ tumors. Then, we inferred cell-cell interactions using CellChat, which showed that IFN-II signaling (including only IFN-γ) was the most
upregulated outgoing signaling in _Trp53_−/−_LMP1_+ tumor cells compared with _Trp53_−/− tumor cells (Fig. 5d, Supplementary Fig. 6d, and Supplementary Data 13). Comparison of the
information flow between _Trp53_−/− and _Trp53_−/−_LMP1_+ tumors confirmed the highest upregulation of IFN-II signaling (Supplementary Fig. 6e). Intracellular flow cytometry confirmed
elevated IFN-γ protein expression in _Trp53_−/−_LMP1_+ tumor cells (Fig. 5e and Supplementary Fig. 6f). IFN-II signal was mainly transmitted to myeloid cells, including Mono and cDC1 (Fig.
5f). Given LMP1 induces IFN-γ production and secretion16, these results suggest that LMP1-mediated IFN-γ signaling is a dominant contributor of microenvironmental changes, particularly
myeloid expansion, in _Trp53_−/−_LMP1_+ tumors. Next, we investigated how altered immune cells affect _Trp53_−/−_LMP1_+ tumor cells in the tumor microenvironment. Among the incoming
signaling to tumor cells, CXC chemokine ligand (CXCL) signaling was significantly upregulated in _Trp53_−/−_LMP1_+ tumor cells compared with _Trp53_−/− tumor cells (Fig. 5d, Supplementary
Fig. 6d, and Supplementary Data 13). This signaling included _Cxcl16_-_Cxcr6_ and _Cxcl9_-_Cxcr3_ signaling, which was mainly derived from myeloid cells, especially from cDC1 (Fig. 5f). Flow
cytometric analysis confirmed higher expressions of CXCR6 and CXCR3 in _Trp53_−/−_LMP1_+ tumor cells (Fig. 5g and Supplementary Fig. 6g). RNA-seq of human samples showed increased
expressions of these chemokine ligands and receptors and their correlation with _LMP1_ expression in ENKTCL (Fig. 5h and Supplementary Fig. 6h, i). We also validated the presence of CD11c+
DC in the tumor microenvironment and CXCR6 and CXCR3 protein expressions in tumor cells by immunohistochemical analysis of human ENKTCL (Fig. 5i and Supplementary Fig. 6j). We next
investigated whether chemokine signaling from myeloid cells can support the development of NK-cell tumors. First, we examined the effect of CXCL16 or CXCL9 in vitro and found that these
chemokines supported the expansion of _Trp53_−/−_LMP1_+ tumor cells (Fig. 5j). Then, we performed co-culture with cDC in vitro, which was found to promote proliferation of _Trp53_−/−_LMP1_+
tumor cells (Fig. 5k). Then, we administered anti-CXCL16 antibody to mice transplanted with _Trp53_−/−_LMP1_+ tumor cells. This treatment significantly prolonged the survival of the
tumor-bearing mice (Fig. 5l). Similar findings were obtained when _Trp53_−/−_LMP1_+ tumor cells were transplanted into _Cxcl16_ knockout mice (Fig. 5m). These results point to the crucial
role of CXCL16-CXCR6 signaling and related myeloid lineage in NK-cell lymphomagenesis. Given that CXCR6 and CXCR3 are tissue-resident NK-cell markers and involved in their retention in
specific organs, _Trp53_−/−_LMP1_+ tumor cells leverage a tissue-resident NK-cell phenotype for their maintenance and progression. IDENTIFICATION OF KLRG1 AND MYC AS A POTENTIAL THERAPEUTIC
TARGET IN ENKTCL These findings led us to hypothesize that dynamic changes in the tumor microenvironment hampered the exploration of tumor cells themselves in bulk sample analysis. Thus, we
compared normal and malignant NK cells in scRNA-seq data and found a significant enrichment of proliferation-related, MYC target gene, and metabolic signatures in malignant NK cells in GSEA
analysis (Supplementary Fig. 7a and Supplementary Data 14). Among NK-cell markers, tumor cells showed a marked increase in _Klrg1_ expression (Fig. 6a). Flow cytometric analysis confirmed an
increased proportion of Lin−KLRG1+ and Lin−CD122+KLRG1+ cells in _Trp53_−/− and _Trp53_−/−_LMP1_+ tumors, although the proportions were slightly lower in _Trp53_−/−_LMP1_+ tumors than in
_Trp53_−/− tumors, probably due to more extensive inflammatory responses in _Trp53_−/−_LMP1_+ tumors (Fig. 6b and Supplementary Fig. 7b). In addition, the Lin−CD122+KLRG1+ fraction
correlated with mutant allele frequency in WES (Supplementary Fig. 7c). These results suggest that KLRG1 expression can efficiently capture NK-cell tumor cells. Also, we transplanted
Lin−KLRG1− and Lin−KLRG1+ cells from _Trp53_−/− tumors into secondary recipients and found that only Lin−KLRG1+ cells developed into NK-cell tumors (Fig. 6c), suggesting that KLRG1
expression can mark tumor cells. We confirmed that _KLRG1_ expression was upregulated in a substantial proportion of ENKTCL samples in human RNA-seq data (Fig. 6d), which was further
supported by immunohistochemical analysis showing positive expression of KLRG1 in tumor cells in human ENKTCL, albeit with heterogeneity in KLRG1 positivity across samples. (Fig. 6e and
Supplementary Fig. 7d). Then, we examined whether targeting tumor cells with anti-KLRG1 antibody is effective against murine NK-cell tumors and found that anti-KLRG1 antibody treatment
reduced the SP size to almost normal in mice transplanted with _Trp53_−/− tumors (Supplementary Fig. 7e). In addition, anti-KLRG1 antibody strikingly prolonged the survival of tumor-bearing
mice, despite short-term treatment (Fig. 6f). Furthermore, anti-KLRG1 antibody was also effective against _Trp53_−/−_LMP1_+ tumors (Fig. 6g). As the effectiveness of anti-KLRG1 antibody was
modest against _Trp53_−/−_LMP1_+ tumors, we further explored another therapeutic target and identified further upregulation of MYC target gene signature in _Trp53_−/−_LMP1_+ tumors compared
with _Trp53_−/− tumors in scRNA-seq data (Fig. 6h, Supplementary Fig. 7f and Supplementary Data 15), although the MYC target gene signature was enriched even in _Trp53_−/− tumors. Therefore,
we administered silvestrol, an eIF4A inhibitor known to inhibit Myc translation17, in mice transplanted with _Trp53_−/−_LMP1_+ tumors. This treatment slightly prolonged the survival of
tumor-bearing mice (Fig. 6i). Conspicuously, a combination of anti-KLRG1 antibody and silvestrol further extended the survival (Fig. 6i). These observations suggest that targeting KLRG1
alone and combined with MYC is a promising therapeutic approach against ENKTCL. DISCUSSION Through modeling ENKTCL in mice, we demonstrate that _Trp53_ deficiency induces NK-cell neoplasms
primarily involving the SG and that _LMP1_ expression accelerated their development. Differential effects of _Trp53_ loss on tissue-resident NK cells at the pre-tumor stage and high
expression of tissue-resident markers in mouse and human NK-cell tumors suggest that tissue-resident NK cells are a putative cell-of-origin of ENKTCL. Among NK-cell transcription factors,
T-bet is expressed from NK-cell progenitors and indispensable for the transition from NK-cell progenitors to immature NK cells, while Eomes, together with maturation markers (such as NK1.1
and CD11b), is expressed in mature NK cells and essential for the development of mature NK cells18. Therefore, it is difficult to determine which NK-cell maturation stage mouse NK-cell
tumors resemble, but _Trp53_-mediated immature NK-cell expansion at the pre-tumor stage implies that these cells are responsible for ENKTCL development. Our findings align with and
complement a recent study showing that ENKTCL cells exhibit a similar surface immunophenotype and DNA methylation signature to NK-cell developmental intermediates present in the tonsils
and/or peripheral blood, thereby suggesting that ENKTCL cells are arrested at earlier stages of NK-cell maturation13. Unlike conventional circulating NK cells, tissue-resident NK cells
display a preferential distribution in various non-lymphoid tissues14. Probably reflecting interspecies differences, the upper aerodigestive tract is preferentially affected in human ENKTCL,
whereas _Trp53_-deficient murine NK-cell tumors predominantly arise from the SG. Tissue-resident NK cells across different tissues have common features, including an immature phenotype and
expression of tissue-resident markers and chemokine receptors14. Still, these cells show substantial differences with respect to phenotype, function, and transcription factor requirement.
Notably, SG NK cells are more susceptible to _Trp53_ deficiency-mediated transformation, providing insights into NK-cell heterogeneity and its oncogenesis. Although LMP1 is essential for
EBV-mediated B-cell transformation in vitro, its expression induces strong cytotoxic T-cell responses in vivo19,20. Thus, disruption of immune surveillance is required for B-cell lymphoma
development, suggesting a tumor-suppressive role of surrounding T cells. By contrast, our single-cell analyses have uncovered that _LMP1_ expression drives myeloid expansion, which can
support NK-cell neoplastic proliferation, pointing to a cell-extrinsic, tumor-promoting effect of LMP1. Accumulating evidence suggests that myeloid cells are involved in tumor development
and progression21. In human ENKTCL, tumor-associated macrophages are commonly abundant and their frequency correlates with worse prognosis10,11,22. More importantly, mutual crosstalk between
NK cells and cDC has been well-documented in various immune responses23,24. In NK-cell lymphomas, malignant NK cells may hijack this interaction, which can be further augmented by
LMP1-induced IFN-γ secretion and chemokine ligand-receptor axis. These observations suggest an increasing significance of myeloid lineage and related signaling pathways, highlighting its
potential as a therapeutic target in ENKTCL. Targeting surface markers using monoclonal antibodies has been established as one of the most successful therapeutic strategies. Here we have
shown that KLRG1 is selectively expressed in mouse and human neoplastic cells and anti-KLRG1 antibody can efficiently eliminate NK-cell tumors in mice. KLRG1, a co-inhibitory receptor
belonging to the killer cell lectin-like receptor family, is expressed on a subset of NK and T cells and is postulated to be a marker of differentiation and senescence25. Given a monoclonal
antibody against KLRG1 (ABC008) is currently under clinical development26, KLRG1 targeting and its combination with other immunomodulatory agents are worth further clinical investigation in
ENKTCL. Another important therapeutic target identified in this study is MYC. We have demonstrated that _Myc_ is genomically and/or transcriptionally activated in _Trp53_−/− tumors and
further deregulated in _Trp53_−/−_LMP1_+ tumors. Moreover, MYC inhibition with an eIF4A inhibitor strongly enhanced the efficacy of anti-KLRG1 antibody even in _Trp53_−/−_LMP1_+ tumors. As
MYC activation is common in human ENKTCL9,15, combined targeting of KLRG1 and MYC can be a promising therapeutic strategy against ENKTCL. In conclusion, using GEMM recapitulating the human
disease, we have delineated the cell-of-origin and microenvironmental changes and exploited potential therapeutic targets, including CXCL16, KLRG1, and MYC, for ENKTCL. These observations
prove that our mouse models will serve as valuable tools for elucidating the pathogenic mechanisms and refining diagnostic and therapeutic strategies in ENKTCL. METHODS MICE
B6.129P2-Trp53tm1Brn/J (_Trp53_flox/flox, catalog number: 008462) and B6.Cg-Ncr1tm1.1(icre)Viv/Or (_Ncr1_-iCre, catalog number: EM05625) were purchased from The Jackson Laboratory and The
Institut national de la santé et de la recherche médicale, respectively. _LMP1_stop conditional knock-in mice were kindly provided by Dr. Yasui. To generate _Trp53_−/− mice, _Trp53_flox/flox
mice were crossed with _Ncr1-iCre_ mice. To generate _Trp53_−/−_LMP1_+ mice, _Trp53_−/− mice were crossed with _LMP1_stop conditional knock-in mice. C57BL/6-SR-PSOX (Cxcl16 knockout) mice
(nbio 196) at 8 weeks old were obtained from the Laboratory Animal Resource Bank of the National Institute of Biomedical Innovation, Health, and Nutrition. Female C57BL/6 mice at 8 weeks old
were obtained from CLEA Japan, Tokyo, Japan. C57BL/6-SR-PSOX mice were used at 8 weeks old for transplantation experiments, while C57BL/6 mice were used at 8 and 60 weeks old. For
_Trp53_flox/flox, _Trp53_−/−, _LMP1_+, and _Trp53_−/−_LMP1_+ mice, we used naturally bred cohorts for long-term observation. Additionally, 8-week-old mice from these strains were used for
pre-tumor analyses. All mice were maintained under specific pathogen-free conditions and maintained on a 12-h light/dark cycle at room temperature (22 ± 0.5 °C) with constant humidity (55 ±
10%). Mice were monitored daily and euthanized when they appeared moribund or lost >25% of their body weight. All mouse experiments were approved by the Animals Committee for Animal
Experimentation of the National Cancer Center (approval ID: T17-081) and met the Guidelines for Proper Conduct of Animal Experiments (the Science Council of Japan). PATIENT SAMPLES ENKTCL
was diagnosed according to the 2008 or 2017 World Health Organization classification depending on the date of diagnosis and biopsies were reviewed by an expert panel of hematopathologists
including those of the French national Lymphopath program1,27. All samples were collected from patients with informed consent without compensation, except for already-collected, anonymized
samples whose use was permitted by the institutional review board. This study was approved by the National Cancer Center Institutional Review Board and the Ethical Committee of Kurume
University and performed in accordance with the Declaration of Helsinki. Sex- and gender-based analyses were not performed. SAMPLE PREPARATION SP and BM cells from the femur and tibia were
filtered through a 70 µm mesh filter to obtain single-cell suspensions. The samples were then resuspended in PBS containing 3% fetal bovine serum (FBS; Biosera). The suspension was layered
over Histopaque (Sigma-Aldrich) and centrifuged at 400 × _g_ for 20 min. The interphase was subsequently washed with 3% FBS-containing PBS. SG and other site tumor samples were processed
using the Tumor Dissociation Kit (Miltenyi Biotec) and the GentleMACS dissociator (Miltenyi Biotec), following the manufacturer’s instructions. After centrifugation at 300 × _g_ for 5 min at
4 °C, the samples were resuspended in red cell lysis buffer (156 mM NH4Cl, 20 mM NaHCO3, and 0.1 mM EDTA [Nacalai Tesque]) and incubated for 5 min at room temperature. The samples were then
centrifuged again, with the supernatant being discarded. PB was treated with 700 µL of red cell lysis buffer for 5 min at room temperature. After centrifugation at 300 × _g_ for 5 min at
room temperature, the supernatant was removed. Lysis and washing were repeated twice. ANALYSIS OF _TRP53_ − / − AND _TRP53_ − / − _LMP1_ +MICE CBC was measured using an automated analyzer
PCE-210N (ERMA). The SG, SP, and other site tumors were harvested and subjected to further analyses, such as histologic examination, flow cytometric analysis, RNA-seq, and WES. Genomic DNA
and RNA were extracted from each organ of the sacrificed mice using the QIAmp DNA Blood Mini Kit and QIAmp RNA Mini Kit (both Qiagen), respectively. Total RNA was reverse transcribed using
ReverTra Ace qPCR RT Master Mix (TOYOBO). WT, _Trp53_−/−, and _Trp53_−/−_LMP1_+ mice were genotyped using a PCR-based assay. Genomic DNA was isolated from tail biopsies or various subsets of
NK cells and subjected to PCR. PCR products were resolved by agarose gel electrophoresis. All steps were followed according to the manufacturer’s instructions. PCR protocol is described in
Supplementary Data 16 and primers are listed in Supplementary Data 17. The diagnosis of NK-cell tumors was based on CBC, macroscopic and histological examination, immunophenotyping with flow
cytometry, evaluation of lymphomagenic potential in secondary transplantation, and whole-exome sequencing. HISTOLOGY Mouse tissues were fixed overnight in formalin, embedded in paraffin
blocks, and sectioned. Tissue sections were stained with hematoxylin and eosin, following standard procedures. Immunohistochemical analysis was performed using 3-µm-thick formalin-fixed
paraffin-embedded tissue sections from the tissue microarray. Slides were deparaffinized with xylene, followed by ethanol. After rehydration with water, antigen retrieval was performed with
Tris-EDTA buffer (pH 9.0) in a microwave oven at 95 °C for 20 min for KLRG1 and CD11c and for 40 min for CD49a, CXCR6, and CXCR3. After cooling and rinsing with buffer, slides were
immunostained using the Dako EnVision FLEX detection system (Agilent Technologies) on a Dako Autostainer Link48 (Agilent Technologies). Slides were incubated with antibodies as indicated in
Supplementary Data 18. EBV-encoded small RNA (EBER) in situ hybridization was performed using fluorescein isothiocyanate (FITC)-labeled EBV PNA Probe (Agilent Technologies) and anti-FITC
antibody (Thermo Fisher Scientific). Human diffuse large B-cell lymphoma samples were used to confirm the specificity of the antibodies (Supplementary Fig. 8). To quantify myeloid cell
infiltration, we counted polymorphonuclear cells in five 60× high-power field for each of two samples of _Trp53_−/− and _Trp53_−/−_LMP1_+ tumors. FLOW CYTOMETRY Antibodies are listed in
Supplementary Data 18. Cells were stained with antibodies and 4′,6-diamidino-2-phenylindole (DOJINDO) or Zombie Aqua (BioLegend), and were analyzed on LSRFortessa X-20 (BD Biosciences).
Various subsets of NK cells were sorted on FACSAria II or III Cell Sorter (BD Biosciences). For intracellular flow cytometry of IFN-γ, Eomes, and T-bet expressions, we used the eBioscience™
Foxp3/Transcription Factor Staining Buffer Set according to the manufacturer’s instructions. Isotype controls were used for intracellular flow cytometry, while fluorescence minus one (FMO)
controls were used for all other flow cytometric analyses. Cell cycle and apoptotic status were analyzed using the Fixation/Permeabilization Solution Kit (BD Biosciences), and Annexin V
Apoptosis Detection Kit (Thermo Fisher Scientific), respectively, following the manufacturer’s instructions. Data were analyzed with FlowJo software (BD Biosciences). The gating strategy is
shown in Supplementary Fig. 9. IN VITRO CHEMOKINE TREATMENT To assess the effect of CXCL16 or CXCL9 on the proliferation of tumor cells, 1 × 10⁵ Lin− _Trp53_−/− or Lin− _Trp53_−/−_LMP1_+
tumor cells were cultured in RPMI 1640 medium with 50% FBS, 1% PS, and 10 ng/mL IL-15 (PEPROTECH). The cells were treated with either no chemokine (control), 10 ng/mL CXCL16 (R&D
Systems), or 100 ng/mL CXCL9 (R&D Systems). After 48 h of culture, the total cell count was determined using the automated cell counter model R1 (OLYMPUS) and normalized relative to the
average of the control samples. IN VITRO CO-CULTURE WITH CDC To assess the effect of cDC on proliferation of _Trp53_−/−_LMP1_+ tumor cells, 1 × 10⁵ Lin− _Trp53_−/−_LMP1_+ tumor cells were
co-cultured with or without 1 × 10⁴ WT SP-derived CD11c+ cDC in RPMI 1640 medium with 50% FBS, 1% PS, and 10 ng/mL IL-15. After 1 week of co- or mono-culture, cells were collected and
analyzed for KLRG1 and mEGFP (a surrogate marker of LMP1) expressions. The tumor cell counts were determined by multiplying the KLRG1 and GFP positivity by the total cell count measured by
the automated cell counter Cell Counter model R1 (OLYMPUS). TUMOR MODELS AND IN VIVO TREATMENT Secondary transplantation to confirm the lymphomagenic potential was performed by transferring
bulk 1 × 10⁶ SP, 2 × 10⁴ Lin−KLRG1+, or 2 × 10⁴ Lin−KLRG1− cells intravenously into lethally irradiated (8.5 Gy) C57BL/6 mice. For in vivo treatment, sub-lethally irradiated (5.5 Gy) mice
were transplanted with Lin+-depleted 5 × 10⁵ tumor cells from secondary tumor of _Trp53_−/− #008 (Fig. 6f), primary tumor of _Trp53_−/−_LMP1_+ #025 (Figs. 5l and 6g), and secondary tumor of
_Trp53_−/−_LMP1_+ #029 (Figs. 5m and 6i) intravenously. Five mg/kg of anti-CXCL16 antibody (R&D Systems) or their isotype Rat IgG2A antibody (R&D Systems) was administered
intraperitoneally every one week beginning from day 5 post-transplantation. Five mg/kg of anti-KLRG1 antibody (BioXcell) or their isotype Syrian hamster IgG antibody (BioXcell) was
administered intraperitoneally every three days beginning from day 7 to day 37 post-transplantation. Silvestrol (MCH MedChemexpress) was dissolved in 5% dimethyl sulfoxide and stocked. Each
stock was suspended in 5.2% PEG400, 5.2% Tween 80, and 84.6% ddH2O, and 0.25 mg/kg of silvestrol was administered intraperitoneally every other day beginning from day 7 to day 37
post-transplantation. WES WES libraries were constructed for 13 (11 primary and 2 secondary) _Trp53_−/− and 14 _Trp53_−/−_LMP1_+ tumor samples as well as matched tail samples (as germline
controls) using SureSelectXT Mouse All Exon v1 (Agilent Technologies). The libraries were sequenced on the HiSeq platform (Illumina) with a 150-bp paired-end read protocol at Macrogen.
Sequence alignment and mutation calling were performed using the Genomon pipeline version 2.6.3 (https://github.com/Genomon-Project/), as previously described28,29. Reads were mapped to the
mouse reference genome (GRCm38/mm10). Candidate mutations with (i) Fisher’s exact P value < 10−1.5; (ii) EBCall30 P value < 10−3; (iii) ≥4 variant reads in tumor samples; (iv) mutant
allele frequency ≥0.05 in tumor samples; and (v) allele frequency in germline control <0.05 were adopted and further filtered by excluding (i) synonymous single nucleotide variants; (ii)
variants only present in unidirectional reads; (iii) variants occurring in repetitive genomic regions; (iv) variants in mouse single nucleotide polymorphism database (NCBI dbSNP137, 138, and
140); or (v) variants detected in multiple tumor samples, which were considered to be germline. Finally, mutations were manually checked by Integrative Genomics Viewer (IGV)31 version
2.11.4. In the subsequent analysis, tumor samples with >3 mutations were considered as clonally confirmed. Pearson’s correlation analysis was performed to investigate the association
between the median mutant allele frequency and the proportion of Lin−CD122+KLRG1+ cells by flow cytometry in tumor samples. The median mutant allele frequency for samples in which no
mutations were detected was set to zero. CNAs were detected using CNVkit32 version 0.9.9, using the above-mentioned tail samples from 9 _Trp53_−/− and 10 _Trp53_−/−_LMP1_+ male mice as a
panel of normal samples. After estimating tumor purity (at ≥0.3) from mutant allele frequencies, absolute integer copy numbers were determined for each sample using ‘call’ command. CNAs were
filtered to exclude (i) chromosome X deletions in males; and (ii) CNAs with ≤10 Mb in length, unless they were homozygous deletions (copy number = 0) or high amplifications (copy number
>5). Finally, all detected CNAs were curated by visual inspection. MUTATIONAL SIGNATURE SigProfilerMatrixGenerator version 1.1.23 was used to categorize mutations into 96 classes and plot
the mutational pattern, with the parameter “exome = True”. We decomposed the overall mutational pattern into 72 signatures from the COSMIC v3.1 compendium using SigProfilerExtractor version
1.1.0 with the default setting, and the proportion of clock-like (SBS1 and SBS5) and reactive oxygen species (SBS17a, SBS17b, and SBS18) signatures were calculated. To compare the mutation
pattern between mouse NK-cell tumors and human ENKTCL, we analyzed previously published WES data of 66 ENKTCL cases from our (accession number EGAS00001006906) and other studies (SRP057085
and SRP049695)33. Mutation calling and mutational signature analysis were performed in a similar manner to the mouse analysis. BULK RNA-SEQ AND ANALYSIS RNA concentration and RNA integrity
number (RIN) were measured by 4200 TapeStation (Agilent Technologies). RNA-seq libraries were prepared for samples with RIN ≥ 7 using NEBNext Ultra II RNA Library Prep Kit for Illumina (New
England Biolabs) and NEBNext Poly(A) mRNA Magnetic Isolation Module (New England Biolabs) for mouse, according to the manufacturer’s instructions. The libraries were sequenced on the HiSeq
platform (Illumina) with a 150-bp paired-end read protocol at Macrogen. In mice, SG, SP, and BM samples from 5 WT and 3 _Trp53_−/− mice at the pre-tumor stage (8 weeks old) as well as 4
_Trp53_−/− clonally confirmed tumors were analyzed. Mapping and expression analyses were conducted using the Genomon pipeline version 2.6.3 (https://github.com/Genomon-Project/) with the
mouse reference genome GRCm38/mm10. Expression for RefSeq genes was calculated as raw read counts using featureCounts34. Differentially expressed genes between the two groups were detected
using the edgeR35 version 3.36.0, with the raw read count matrix. To perform dimensionality reduction and clustering, we first calculated transcripts per million (TPM) values from raw read
counts and performed principal component analysis (PCA) using log2(TPM + 1) value. Then, the resultant clusters were visualized on a UMAP (uniform manifold approximation and projection)
embedding using the umap version 0.2.10 with the first 10 principal components. In humans, RNA-seq data for 21 ENKTCL tumors and 3 normal NK cells from healthy donors were described in our
previous study (accession number EGAS00001006906)33. Publicly available RNA-seq data for 20 ENKTCL tumors and 3 normal tonsils from ENKTCL patients and 1 normal NK cell from a healthy donor
(accession number SRP0570857, SRP04969536, and GSE19092437) were also obtained from the National Center for Biotechnology Information Sequence Read Archive. Mapping and expression analyses
were conducted using the Genomon pipeline version 2.6.2 with the human reference genome hs37d5, which included the EBV genomic sequence (NC_007605). Expression for RefSeq genes and _LMP1_
were calculated as fragments per kilobase of exon per million reads mapped values (FPKM). The batch effect among datasets was corrected using the ComBat function in the R package sva
(version 3.42.0) while preserving cell type-specific effects38. Adjusted expression values below zero were subsequently set to zero. A detailed analysis of the human RNA-seq dataset was
published elsewhere33. FUNCTIONAL ENRICHMENT ANALYSIS IN BULK RNA-SEQ GSEA version 4.1.0 was conducted using hallmark, Reactome, and WikiPathways gene sets from the mouse and human Molecular
Signatures Database (MSigDB) (version 2022.1) for mice and humans, respectively39. Raw read counts normalized by the trimmed mean of the M-values method using edgeR (for mouse) and FPKM
values (for human) were used as input. Phenotype permutation was used when at least seven samples were available for each phenotype, otherwise gene set permutation was chosen. Gene sets with
a false discovery rate (FDR) < 0.25 and <0.05 were considered significantly enriched for phenotype permutation and gene set permutation, respectively. Tissue-resident and circulating
NK-cell signatures were created based on the previous study comparing CD56brightCD16− and CD56dimCD16+ NK-cell subsets in humans40. IMMUNE CELL DECONVOLUTION USING CIBERSORTX To estimate the
proportions of different immune cell types, the FPKM values were uploaded to the CIBERSORTx online platform (https://cibersortx.stanford.edu/) for each cell type. The LM22 signature matrix
was used with the following parameters; quantile normalization disabled, absolute run mode, and 100 permutations. As discriminating tumor cells and normal T and NK cells is difficult, the
proportion in nonmalignant cells was estimated after excluding T and NK cells. LIBRARY PREPARATION AND SEQUENCING FOR SCRNA-SEQ ANALYSIS Frozen mouse tumor samples were rapidly thawed,
followed by staining with TruStain FcX PLUS (anti-mouse CD16/32) Antibody (BioLegend) according to the manufacturer’s instructions. Subsequently, cells were stained with anti-CD45 antibody
(BioLegend) and hash-tag antibody (Total-seqB, BioLegend). In each sample, 15,000 CD45+ cells were sorted and multiplexed at two samples. scRNA-seq libraries were prepared using the Chromium
Next GEM Single Cell 3ʹ Kit v3.1 (PN-1000268), Chromium Next GEM Chip G Single Cell Kit (PN-1000120), Dual Index Kit TT Set A (PN-1000215), according to manufacturer’s instructions
(CG000315 Rev E) (10x Genomics). These libraries were sequenced on the NovaSeq 6000 platform (Illumina) to yield paired-end 150 bp reads at Macrogen. PREPROCESSING OF SINGLE-CELL DATA As
previously described41, raw scRNA-seq results were demultiplexed and converted to FASTQ format using 10x Genomics Cell Ranger (version 5.0.1). scRNA-seq data were aligned to the reference
genome created using ‘cellranger mkref’ with mouse reference (GRCm38) and _LMP1_ (NC_007605). Unique molecular identifiers (UMI) of scRNA-seq data were counted using ‘cellranger count’ and
aggregated using ‘cellranger aggr’. Gene-barcode matrix was then analyzed using Seurat (version 4.3.0)42. To exclude low-quality cells, we removed (i) cells with ≤200 or ≥8000 detected
genes, and (ii) cells with ≥10% of transcripts from mitochondrial genes. The UMI count matrix of scRNA-seq data was normalized, scaled, and centered using ‘SCTransform’ function. Then, 3000
most variable genes were selected based on standardized variance, from which TCR _(Trav_, _Trbv_, _Trdv_, and _Trgv_), immunoglobulin (_Igkc_, _Igkv_, _Iglc_, _Iglv_, _Ighg_, _Ighv_, _Igha_,
_Ighm_, and _Jchain_), ribosomal (_Rps_ and _Rpl_), and mitochondrial variable genes were excluded. Dimensionality reduction was performed based on PCA using the ‘RunPCA’ function. Then, a
K-nearest neighbor (KNN) graph was constructed based on the result of PCA using the ‘FindNeighbors’ function. To group the cells into different clusters, a smart local moving clustering
algorithm was applied based on the KNN graph using the ‘FindClusters’ function with a resolution of 0.2. Then, we removed doublets detected by DoubletFinder package (version 2.0.3)43. The
remaining 84,550 cells were subsequently analyzed. IDENTIFICATION OF CELL CLUSTERS ON SCRNA-SEQ For the remaining cells, the KNN graph-based clustering was repeated with a resolution of
0.11. For visualization, the dimensionality was further reduced using UMAP44 with the ‘RunUMAP’ function. Seven malignant and 13 nonmalignant cell clusters were identified. Malignant cell
clusters were classified into _LMP1_ negative or positive. Nonmalignant cell clusters were assigned to known broad cell types (T/NK, B, and myeloid cells) based on the expression of
canonical lineage markers, while the remaining cells were classified into others. We applied the same normalization, dimensionality reduction, and clustering pipeline as described above to
each dataset of T/NK, B, and myeloid cells to identify subclusters within these broad cell types. T/NK-cell cluster was subclassified into CD4+ T, CD8+ T, and NK cells. Then, both CD4+ T and
CD8+ T cells were processed again using the same pipeline and further classified into more specific subclusters. These individual subclusters were assigned to known subsets based on the
expression of representative mRNA markers. To quantify the enrichment of cell clusters across organs (SG/Other and SP) and groups (pre-tumor, _Trp53_−_/_− tumor, and _Trp53_−_/_−_LMP1__+_
tumor), we compared the observed and expected cell numbers in each cluster by computing the _R_o/e value using the epitools package (version 0.5-10.1) according to the following formula:
_R_o/e = Observed/Expected, where the expected cell numbers for each combination of cell clusters and organs were obtained from the chi-square test. Statistical significance was assessed
using the binomial test for each cell cluster. FUNCTIONAL ENRICHMENT ANALYSIS FOR DIFFERENTIALLY EXPRESSED MRNAS IN SCRNA-SEQ To identify significantly enriched pathways, GSEA was performed
using ClusterProfiler package (version 4.6.2) and hallmark, Reactome, and WikiPathways gene sets from the mouse MSigDB (version 2022.1). Gene lists were generated by the Wilcoxon rank sum
test between two clusters/subclusters using the Seurat ‘FindMarkers’ function, and genes in each list were ranked according to log2(fold change) in descending order. Statistical significance
was calculated by a phenotype permutation test and FDR < 0.1 was considered significant. INFERENCE OF CELL-CELL COMMUNICATION AND SIGNALING PATHWAYS Cell-cell communication analysis was
performed using the R package CellChat (version 1.6.1)45. Normalized mRNA expression data derived from _Trp53_−_/_− and _Trp53_−_/_−_LMP1__+_ tumors were used to create the CellChat object.
We applied the recommended preprocessing functions with default parameters. Cell-cell communication and signaling networks of individual ligand-receptor pairs were inferred using the
CellChatDB.mouse database and depicted as chord diagrams using the ‘netVisual_individual’ function. Outgoing or incoming signals across cell clusters were calculated and visualized using the
‘netAnalysis_signalingRole_heatmap’ function. Information flow for each signaling, which is defined by the sum of communication probability among all pairs of cell clusters in the inferred
network, was compared between _Trp53_−/− and _Trp53_−/−_LMP1_+ tumors and visualized using the ‘rankNet’ function. REAGENTS All commercial reagents used in this study are listed in
Supplementary Data 19. STATISTICAL ANALYSIS Statistical analyses were performed with R3.6.1 software (The R Foundation for Statistical Computing). Comparison of continuous data was performed
using the two-sided Welch’s t-test unless otherwise specified. Survival analyses were conducted using the log-rank test. All measurements shown are distinct biological replicates unless
otherwise noted. REPORTING SUMMARY Further information on research design is available in the Nature Portfolio Reporting Summary linked to this article. DATA AVAILABILITY Mouse RNA-seq, WES,
and scRNA-seq data have been deposited in the DNA Data Bank of Japan (DDBJ) BioProject database under accession number PRJDB16976. The human data from other studies used in this paper are
available in the European Genome-phenome Archive under accession number EGAS00001006906, the NCBI Sequence Read Archive under accession numbers SRP057085 and SRP049695, and the NCBI Gene
Expression Omnibus under accession number GSE190924 (https://www.ncbi.nlm.nih.gov/geo/query/acc.cgi?acc=GSE190925). The remaining data are available within Supplementary Information and
Source Data file. Source data are provided with this paper. CODE AVAILABILITY The original code used for single-cell analyses has been deposited in Github:
https://github.com/nccmo/mouse-NK-lymphoma-2024 and in Zenodo: https://doi.org/10.5281/zenodo.13837293. All other codes used in this study are available upon request from the corresponding
author. REFERENCES * S. H. Swerdlow, et al. _WHO Classification of Tumours of Haematopoietic and Lymphoid Tissues_ (International Agency for research on cancer, 2017). * Tse, E., Zhao,
W.-L., Xiong, J. & Kwong, Y.-L. How we treat NK/T-cell lymphomas. _J. Hematol. Oncol._ 15, 74 (2022). Article CAS PubMed PubMed Central Google Scholar * Yamaguchi, M., Suzuki, R.
& Oguchi, M. Advances in the treatment of extranodal NK/T-cell lymphoma, nasal type. _Blood_ 131, 2528–2540 (2018). Article CAS PubMed Google Scholar * Münz, C. Latency and lytic
replication in Epstein-Barr virus-associated oncogenesis. _Nat. Rev. Microbiol_ 17, 691–700 (2019). Article PubMed Google Scholar * de Mel, S., Hue, S. S., Jeyasekharan, A. D., Chng, W.
J. & Ng, S. B. Molecular pathogenic pathways in extranodal NK/T cell lymphoma. _J. Hematol. Oncol._ 12, 33 (2019). Article PubMed PubMed Central Google Scholar * Blossom, D.,
Shannon, C. K. & Nancy, R.-T. Epstein-Barr virus: biology and clinical disease. _Cell_ 185, 3652–3670 (2022). Article Google Scholar * Jiang, L. et al. Exome sequencing identifies
somatic mutations of DDX3X in natural killer/T-cell lymphoma. _Nat. Genet._ 47, 1061–1066 (2015). Article CAS PubMed Google Scholar * Kataoka, K. et al. Frequent structural variations
involving programmed death ligands in Epstein-Barr virus-associated lymphomas. _Leukemia_ 33, 1687–1699 (2019). Article CAS PubMed PubMed Central Google Scholar * Xiong, J. et al.
Genomic and transcriptomic characterization of natural killer T cell lymphoma. _Cancer Cell_ 37, 403–419.e406 (2020). Article CAS PubMed Google Scholar * Cho, J. et al. Immune subtyping
of extranodal NK/T-cell lymphoma: a new biomarker and an immune shift during disease progression. _Mod. Pathol._ 33, 603–615 (2020). Article CAS PubMed Google Scholar * Kim, S. J. et al.
Avelumab for the treatment of relapsed or refractory extranodal NK/T-cell lymphoma: an open-label phase 2 study. _Blood_ 136, 2754–2763 (2020). Article CAS PubMed Google Scholar *
Nagata, H. et al. Characterization of novel natural killer (NK)-cell and gammadelta T-cell lines established from primary lesions of nasal T/NK-cell lymphomas associated with the
Epstein-Barr virus. _Blood_ 97, 708–713 (2001). Article CAS PubMed Google Scholar * Mundy-Bosse, B. L. et al. Identification and targeting of the developmental blockade in extranodal
natural killer/T-cell lymphoma. _Blood Cancer Discov._ 3, 154–169 (2022). Article PubMed PubMed Central Google Scholar * Peng, H. & Tian, Z. Diversity of tissue-resident NK cells.
_Semin Immunol._ 31, 3–10 (2017). Article CAS PubMed Google Scholar * Oishi, N. et al. Genetic and immunohistochemical profiling of NK/T-cell lymphomas reveals prognostically relevant
BCOR-MYC association. _Blood Adv._ 7, 178–189 (2023). Article CAS PubMed Google Scholar * Vaysberg, M., Lambert, S. L., Krams, S. M. & Martinez, O. M. Activation of the JAK/STAT
pathway in Epstein Barr virus+-associated posttransplant lymphoproliferative disease: role of interferon-gamma. _Am. J. Transpl._ 9, 2292–2302 (2009). Article CAS Google Scholar * Cerezo,
M. et al. Translational control of tumor immune escape via the eIF4F-STAT1-PD-L1 axis in melanoma. _Nat. Med._ 24, 1877–1886 (2018). Article CAS PubMed Google Scholar * Gordon, S. M. et
al. The transcription factors T-bet and Eomes control key checkpoints of natural killer cell maturation. _Immunity_ 36, 55–67 (2012). Article CAS PubMed PubMed Central Google Scholar *
Kaye, K. M., Izumi, K. M. & Kieff, E. Epstein-Barr virus latent membrane protein 1 is essential for B-lymphocyte growth transformation. _Proc. Natl Acad. Sci. USA_ 90, 9150–9154 (1993).
Article ADS CAS PubMed PubMed Central Google Scholar * Zhang, B. et al. Immune surveillance and therapy of lymphomas driven by Epstein-Barr virus protein LMP1 in a mouse model. _Cell_
148, 739–751 (2012). Article CAS PubMed PubMed Central Google Scholar * van Vlerken-Ysla, L., Tyurina, Y. Y., Kagan, V. E. & Gabrilovich, D. I. Functional states of myeloid cells
in cancer. _Cancer Cell_ 41, 490–504 (2023). Article PubMed PubMed Central Google Scholar * Wang, H. et al. High numbers of CD68+ tumor-associated macrophages correlate with poor
prognosis in extranodal NK/T-cell lymphoma, nasal type. _Ann. Hematol._ 94, 1535–1544 (2015). Article CAS PubMed Google Scholar * Walzer, T., Dalod, M., Robbins, S. H., Zitvogel, L.
& Vivier, E. Natural-killer cells and dendritic cells: “l’union fait la force. _Blood_ 106, 2252–2258 (2005). Article CAS PubMed Google Scholar * Degli-Esposti, M. A. & Smyth, M.
J. Close encounters of different kinds: dendritic cells and NK cells take centre stage. _Nat. Rev. Immunol._ 5, 112–124 (2005). Article CAS PubMed Google Scholar * Henson, S. M. &
Akbar, A. N. KLRG1–more than a marker for T cell senescence. _Age_ 31, 285–291 (2009). Article CAS PubMed PubMed Central Google Scholar * Naddaf, E. Inclusion body myositis: update on
the diagnostic and therapeutic landscape. _Front. Neurol._ 13, 1020113 (2022). Article PubMed PubMed Central Google Scholar * Sabattini, E., Bacci, F., Sagramoso, C. & Pileri, S. A.
WHO classification of tumours of haematopoietic and lymphoid tissues in 2008: an overview. _Pathologica_ 102, 83–87 (2010). CAS PubMed Google Scholar * Tabata, M. et al. Inter- and
intra-tumor heterogeneity of genetic and immune profiles in inherited renal cell carcinoma. _Cell Rep._ 42, 112736 (2023). Article CAS PubMed Google Scholar * Kataoka, K. et al.
Integrated molecular analysis of adult T cell leukemia/lymphoma. _Nat. Genet._ 47, 1304–1315 (2015). Article CAS PubMed Google Scholar * Shiraishi, Y. et al. An empirical Bayesian
framework for somatic mutation detection from cancer genome sequencing data. _Nucleic Acids Res._ 41, e89 (2013). Article CAS PubMed PubMed Central Google Scholar * Robinson, J. T. et
al. Integrative genomics viewer. _Nat. Biotechnol._ 29, 24–26 (2011). Article CAS PubMed PubMed Central Google Scholar * Talevich, E., Shain, A. H., Botton, T. & Bastian, B. C.
CNVkit: genome-wide copy number detection and visualization from targeted DNA sequencing. _PLoS Comput. Biol._ 12, e1004873 (2016). Article ADS PubMed PubMed Central Google Scholar *
Ito, Y. et al. Comprehensive genetic profiling reveals frequent alterations of driver genes on the X chromosome in extranodal NK/T-cell lymphoma. _Cancer Res._ 84, 2181–2201 (2024). Article
CAS PubMed Google Scholar * Liao, Y., Smyth, G. K. & Shi, W. featureCounts: an efficient general purpose program for assigning sequence reads to genomic features. _Bioinformatics_
30, 923–930 (2014). Article CAS PubMed Google Scholar * Robinson, M. D., McCarthy, D. J. & Smyth, G. K. edgeR: a Bioconductor package for differential expression analysis of digital
gene expression data. _Bioinformatics_ 26, 139–140 (2010). Article CAS PubMed Google Scholar * Küçük, C. et al. Activating mutations of STAT5B and STAT3 in lymphomas derived from γδ-T or
NK cells. _Nat. Commun._ 6, 6025 (2015). Article ADS PubMed Google Scholar * Zhou, J. et al. Super-enhancer-driven TOX2 mediates oncogenesis in natural killer/T cell lymphoma. _Mol.
Cancer_ 22, 69 (2023). Article CAS PubMed PubMed Central Google Scholar * Johnson, W. E., Li, C. & Rabinovic, A. Adjusting batch effects in microarray expression data using
empirical Bayes methods. _Biostatistics_ 8, 118–127 (2007). Article PubMed Google Scholar * Subramanian, A. et al. Gene set enrichment analysis: a knowledge-based approach for
interpreting genome-wide expression profiles. _Proc. Natl Acad. Sci. USA_ 102, 15545–15550 (2005). Article ADS CAS PubMed PubMed Central Google Scholar * Dogra, P. et al. Tissue
determinants of human NK cell development, function, and residence. _Cell_ 180, 749–763 e713 (2020). Article CAS PubMed PubMed Central Google Scholar * Koya, J. et al. Single-cell
analysis of the multicellular ecosystem in viral carcinogenesis by HTLV-1. _Blood Cancer Discov._ 2, 450–467 (2021). Article CAS PubMed PubMed Central Google Scholar * Butler, A.,
Hoffman, P., Smibert, P., Papalexi, E. & Satija, R. Integrating single-cell transcriptomic data across different conditions, technologies, and species. _Nat. Biotechnol._ 36, 411–420
(2018). Article CAS PubMed PubMed Central Google Scholar * McGinnis, C. S., Murrow, L. M. & Gartner, Z. J. DoubletFinder: doublet detection in single-cell RNA sequencing data using
artificial nearest neighbors. _Cell Syst._ 8, 329–337.e4 (2019). Article CAS PubMed PubMed Central Google Scholar * Becht, E. et al. Dimensionality reduction for visualizing single-cell
data using UMAP. _Nat. Biotechnol._ https://doi.org/10.1038/nbt.4314 (2018). * Jin, S. et al. Inference and analysis of cell-cell communication using CellChat. _Nat. Commun._ 12, 1088
(2021). Article ADS CAS PubMed PubMed Central Google Scholar Download references ACKNOWLEDGEMENTS This work was supported by Japan Society for the Promotion of Science (JSPS) KAKENHI
(JP21H05051 [K.K.] and JP22H03108 [J.K.]), Japan Science and Technology Agency Moonshot R&D Program (JPMJMS2022 [K.K.]), Japan Agency for Medical Research and Development (JP20ck0106442
[J.K.] and JP23gm1810002 [K.K.]), SGH Foundation [J.K.], Princess Takamatsu Cancer Research Fund [K.K.], MSD Life Science Foundation [K.K.], and Takeda Science Foundation[K.K.], Nippon
Shinyaku Co., Ltd. Research Grant [J.K.]. We thank Fumie Ueki, Yoko Hokama, and Yoshiko Ito for their technical assistance. The sequencing resources were partly provided by Fundamental
Innovative Oncology Core at the National Cancer Center. The supercomputing resources were provided by the Human Genome Center, the Institute of Medical Science, The University of Tokyo.
AUTHOR INFORMATION Author notes * These authors contributed equally: Junji Koya, Tomohiko Tanigawa. AUTHORS AND AFFILIATIONS * Division of Molecular Oncology, National Cancer Center Research
Institute, Tokyo, Japan Junji Koya, Tomohiko Tanigawa, Kota Mizuno, Haryoon Kim, Yuta Ito, Mitsuhiro Yuasa, Kentaro Yamaguchi, Yasunori Kogure, Yuki Saito, Sumito Shingaki, Mariko Tabata,
Koichi Murakami & Keisuke Kataoka * Division of Hematology, Department of Medicine, Keio University School of Medicine, Tokyo, Japan Junji Koya, Tomohiko Tanigawa, Kota Mizuno, Haryoon
Kim, Kentaro Yamaguchi, Koichi Murakami & Keisuke Kataoka * Division of Clinical Oncology and Hematology, Department of Internal Medicine, The Jikei University School of Medicine, Tokyo,
Japan Yuta Ito * Department of Pathology, Graduate School of Medicine, The University of Tokyo, Tokyo, Japan Mitsuhiro Yuasa * Department of Gastroenterology, Keio University School of
Medicine, Tokyo, Japan Yuki Saito * Department of Urology, Graduate School of Medicine, The University of Tokyo, Tokyo, Japan Mariko Tabata * Division of Genome Analysis Platform
Development, National Cancer Center Research Institute, Tokyo, Japan Kenichi Chiba, Ai Okada & Yuichi Shiraishi * Laboratory of cellular and molecular mechanisms of hematological
disorders and therapeutic implications, INSERM UMR_S 1163, Imagine Institute, Université Paris Cité, Paris, France Amira Marouf, Raphaël Liévin, Olivier Hermine & Lucile Couronné *
Hematology department, Limoges University Hospital, Limoges, France Sammara Chaubard & Arnaud Jaccard * Hematology Department, Necker Children’s Hospital, Assistance Publique - Hôpitaux
de Paris (APHP), Paris, France Olivier Hermine * Institute of Pathology, Department of Laboratory Medicine and Pathology, Lausanne University Hospital and Lausanne University, Lausanne,
Switzerland Laurence de Leval * Department of Hematology, Clermont-Ferrand University Hospital, Clermont Auvergne University, Clermont-Ferrand, France Olivier Tournilhac * Department of
Hematology, Caen University Hospital, Normandy University, Caen, France Gandhi Damaj * University Paris Est Créteil, INSERMU955, IMRB, Créteil, France Philippe Gaulard * Pathology
Department, Henri Mondor University Hospital, Assistance Publique -Hôpitaux de Paris (APHP), Créteil, France Philippe Gaulard * Laboratory of Onco-Hematology, Necker Children’s Hospital,
Assistance Publique -Hôpitaux de Paris (APHP), Paris, France Lucile Couronné * Laboratory of Infectious Diseases and Immunity, Microbial Research Center for Health and Medicine, National
Institutes of Biomedical Innovation, Health and Nutrition, Ibaraki City, Japan Teruhito Yasui * Division of Molecular Psychoneuroimmunology, Institute for Genetic Medicine, Hokkaido
University, Sapporo, Japan Teruhito Yasui * Division of Pathology, Kurume University, Fukuoka, Japan Kazutaka Nakashima, Hiroaki Miyoshi & Koichi Ohshima Authors * Junji Koya View author
publications You can also search for this author inPubMed Google Scholar * Tomohiko Tanigawa View author publications You can also search for this author inPubMed Google Scholar * Kota
Mizuno View author publications You can also search for this author inPubMed Google Scholar * Haryoon Kim View author publications You can also search for this author inPubMed Google Scholar
* Yuta Ito View author publications You can also search for this author inPubMed Google Scholar * Mitsuhiro Yuasa View author publications You can also search for this author inPubMed
Google Scholar * Kentaro Yamaguchi View author publications You can also search for this author inPubMed Google Scholar * Yasunori Kogure View author publications You can also search for
this author inPubMed Google Scholar * Yuki Saito View author publications You can also search for this author inPubMed Google Scholar * Sumito Shingaki View author publications You can also
search for this author inPubMed Google Scholar * Mariko Tabata View author publications You can also search for this author inPubMed Google Scholar * Koichi Murakami View author publications
You can also search for this author inPubMed Google Scholar * Kenichi Chiba View author publications You can also search for this author inPubMed Google Scholar * Ai Okada View author
publications You can also search for this author inPubMed Google Scholar * Yuichi Shiraishi View author publications You can also search for this author inPubMed Google Scholar * Amira
Marouf View author publications You can also search for this author inPubMed Google Scholar * Raphaël Liévin View author publications You can also search for this author inPubMed Google
Scholar * Sammara Chaubard View author publications You can also search for this author inPubMed Google Scholar * Arnaud Jaccard View author publications You can also search for this author
inPubMed Google Scholar * Olivier Hermine View author publications You can also search for this author inPubMed Google Scholar * Laurence de Leval View author publications You can also
search for this author inPubMed Google Scholar * Olivier Tournilhac View author publications You can also search for this author inPubMed Google Scholar * Gandhi Damaj View author
publications You can also search for this author inPubMed Google Scholar * Philippe Gaulard View author publications You can also search for this author inPubMed Google Scholar * Lucile
Couronné View author publications You can also search for this author inPubMed Google Scholar * Teruhito Yasui View author publications You can also search for this author inPubMed Google
Scholar * Kazutaka Nakashima View author publications You can also search for this author inPubMed Google Scholar * Hiroaki Miyoshi View author publications You can also search for this
author inPubMed Google Scholar * Koichi Ohshima View author publications You can also search for this author inPubMed Google Scholar * Keisuke Kataoka View author publications You can also
search for this author inPubMed Google Scholar CONTRIBUTIONS J.K. and T.T. performed functional assays. K.Y., S.S., and K.Murakami supported functional assays. K.Mizuno., H.K., Y.I., M.Y.,
and L.C. performed sequencing data analyses. Y.K., Y.Saito, M.T, K.C., A.O., and Y Shiraishi assisted sequencing data analyses T.Y. created _LMP1_+ mice. K.N. H.M. and K.O. performed a
pathological assessment. A.M., R.L., S.C., A.J., O.H., L.L., O.T., G.D., P.G., and L.C. prepared samples. J.K., T.T., and K.K. generated figures and tables and wrote the manuscript. K.K. led
the entire project. All authors participated in discussions and interpretation of the data and results. CORRESPONDING AUTHOR Correspondence to Keisuke Kataoka. ETHICS DECLARATIONS COMPETING
INTERESTS The authors declare no competing interests. PEER REVIEW PEER REVIEW INFORMATION _Nature Communications_ thanks Nicholas Huntington and the other, anonymous, reviewer(s) for their
contribution to the peer review of this work. A peer review file is available. ADDITIONAL INFORMATION PUBLISHER’S NOTE Springer Nature remains neutral with regard to jurisdictional claims in
published maps and institutional affiliations. SUPPLEMENTARY INFORMATION SUPPLEMENTARY INFORMATION SUPPLEMENTARY DATA 1-19 REPORTING SUMMARY TRANSPARENT PEER REVIEW FILE SOURCE DATA SOURCE
DATA RIGHTS AND PERMISSIONS OPEN ACCESS This article is licensed under a Creative Commons Attribution-NonCommercial-NoDerivatives 4.0 International License, which permits any non-commercial
use, sharing, distribution and reproduction in any medium or format, as long as you give appropriate credit to the original author(s) and the source, provide a link to the Creative Commons
licence, and indicate if you modified the licensed material. You do not have permission under this licence to share adapted material derived from this article or parts of it. The images or
other third party material in this article are included in the article’s Creative Commons licence, unless indicated otherwise in a credit line to the material. If material is not included in
the article’s Creative Commons licence and your intended use is not permitted by statutory regulation or exceeds the permitted use, you will need to obtain permission directly from the
copyright holder. To view a copy of this licence, visit http://creativecommons.org/licenses/by-nc-nd/4.0/. Reprints and permissions ABOUT THIS ARTICLE CITE THIS ARTICLE Koya, J., Tanigawa,
T., Mizuno, K. _et al._ Modeling NK-cell lymphoma in mice reveals its cell-of-origin and microenvironmental changes and identifies therapeutic targets. _Nat Commun_ 15, 9106 (2024).
https://doi.org/10.1038/s41467-024-53376-1 Download citation * Received: 27 February 2024 * Accepted: 10 October 2024 * Published: 22 October 2024 * DOI:
https://doi.org/10.1038/s41467-024-53376-1 SHARE THIS ARTICLE Anyone you share the following link with will be able to read this content: Get shareable link Sorry, a shareable link is not
currently available for this article. Copy to clipboard Provided by the Springer Nature SharedIt content-sharing initiative