Play all audios:
ABSTRACT Deep single-cell multi-omic profiling offers a promising approach to understand and overcome drug resistance in relapsed or refractory (rr) acute myeloid leukemia (AML). Here, we
combine single-cell ex vivo drug profiling (pharmacoscopy) with single-cell and bulk DNA, RNA, and protein analyses, alongside clinical data from 21 rrAML patients. Unsupervised data
integration reveals reduced ex vivo response to the Bcl-2 inhibitor venetoclax (VEN) in patients treated with both a hypomethylating agent (HMA) and VEN, compared to those pre-exposed to
chemotherapy or HMA alone. Integrative analysis identifies both known and unreported mechanisms of innate and treatment-related VEN resistance and suggests alternative treatments, like
targeting increased proliferation with the PLK inhibitor volasertib. Additionally, high CD36 expression in VEN-resistant blasts associates with sensitivity to CD36-targeted antibody
treatment ex vivo. This study demonstrates how single-cell multi-omic profiling can uncover drug resistance mechanisms and treatment vulnerabilities, providing a valuable resource for future
AML research. SIMILAR CONTENT BEING VIEWED BY OTHERS A CHEMOGENOMIC APPROACH TO IDENTIFY PERSONALIZED THERAPY FOR PATIENTS WITH RELAPSE OR REFRACTORY ACUTE MYELOID LEUKEMIA: RESULTS OF A
PROSPECTIVE FEASIBILITY STUDY Article Open access 03 June 2020 LEUKEMIA STEMNESS AND CO-OCCURRING MUTATIONS DRIVE RESISTANCE TO IDH INHIBITORS IN ACUTE MYELOID LEUKEMIA Article Open access
10 May 2021 COMBINED INHIBITION OF XIAP AND BCL2 DRIVES MAXIMAL THERAPEUTIC EFFICACY IN GENETICALLY DIVERSE AGGRESSIVE ACUTE MYELOID LEUKEMIA Article 18 March 2021 INTRODUCTION The outcome
of patients with relapsed or refractory (rr) acute myeloid leukemia (AML) is poor with an estimated survival of <12 months1,2. Innate and acquired resistance to standard chemotherapy is
driven by a complex landscape of somatic mutations and clonal evolution3. Single-cell genomic and transcriptomic sequencing revealed a cellular hierarchy governed by leukemic stem cells
giving rise to a variety of aberrant progenitor cells with patient-specific gene expression and differentiation profiles3,4,5,6,7. Thus, heterogeneity exists even within clonal populations.
Combined with the scarcity of approved targeted therapies for most AML, this makes patient stratification based on genomic alterations alone challenging, and more comprehensive approaches
are needed to identify active drugs, particularly in rrAML. Functional precision medicine (FPM) strategies directly assess the therapeutic impact of drugs on primary patient material. A
variety of studies performing ex vivo drug testing have been performed8,9,10,11,12,13, and observational trials reported concordance with ex vivo and clinical responses13,14,15,16,17,18.
These findings enabled the transition to prospective interventional studies. Recently, FPM-guided treatment in AML and other hematologic malignancies was successfully implemented into
clinical decision-making19,20,21. In particular, using pharmacoscopy (PCY), a single-cell image-based platform, more than half of 56 patients with aggressive blood cancers treated according
to PCY recommendations achieved progression-free survival 1.3 times longer than on their previous treatment duration20,22. This finding was confirmed in a subsequent interventional trial
specifically focusing on AML patients with exhausted standard-of-care treatment options21. Integrating FPM data with molecular information has the potential to elucidate mechanisms
underlying drug sensitivity and resistance and to identify drug targets and vulnerabilities. Two recent AML studies11,23 integrated bulk RNA and genomic sequencing data from over 800
patients with ex vivo drug sensitivities. By applying computational deconvolution of bulk transcriptomics data, the maturation state of each AML was inferred and linked to outcome and ex
vivo drug sensitivity. In particular, the histone deacetylase (HDAC) inhibitor panobinostat and the B-cell lymphoma 2 (Bcl-2) inhibitor venetoclax showed completely opposite drug responses
based on the AML maturation state. In another study, bulk proteomic, transcriptomic, and genomic profiles integrated with ex vivo drug responses revealed an AML phenotype characterized by
high levels of mitochondrial proteins associated with poor outcome24. This proteomic signature was uncorrelated to the corresponding gene expression, highlighting the complementary nature of
the two measurements. Despite the promising results of integrative analyses, comprehensive studies combining single-cell resolved measurements of different molecular entities with
functional profiling are lacking. In this work, we perform in-depth molecular characterization of rrAML samples at the single-cell level and integrate the data with single-cell resolved ex
vivo drug responses. This approach reveals consistency among the molecular changes underlying both innate and acquired resistance to the Bcl-2 inhibitor (BCL2i) venetoclax (VEN) and suggests
alternative treatment options for BCL2i resistant patients. We provide a unique resource of single-cell resolved and clinically annotated multi-omic (DNA, RNA, protein) and functional (ex
vivo drug response) profiling of rrAML patients with clinical implications. RESULTS SINGLE-CELL MOLECULAR AND FUNCTIONAL PROFILING OF RRAML SAMPLES To gain insights into the molecular
determinants of the AML drug response landscape and identify actionable vulnerabilities, we integrated single-cell and bulk molecular measurements with ex vivo drug responses for rrAML
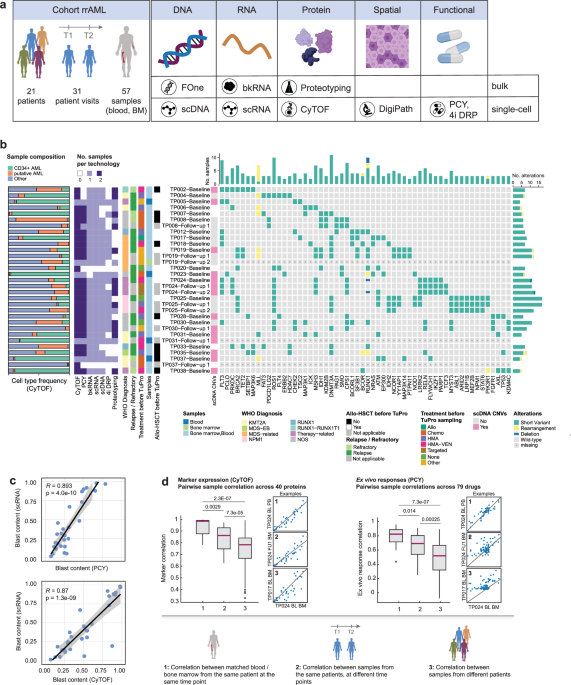
patients from the Tumor Profiler (TuPro) study25. Mononuclear cells (MNCs) isolated from blood or bone marrow biopsies were comprehensively characterized at the molecular and functional
level (Fig. 1a, Supplementary Data 1) using both clinically established workflows such as (digital) pathology and targeted next-generation sequencing (NGS), as well as experimental
technologies, referred to as TuPro technologies. Our genetic analysis encompassed mutational profiling at the bulk level (FoundationOne Heme assay, Supplementary Data 2), as well as analysis
of single-cell copy number variations (CNV, Supplementary Data 3). Moreover, we quantified RNA and protein levels in bulk (RNA-seq, Supplementary Data 4; proteotyping, Supplementary Data 5)
and with single-cell resolution (scRNA-seq, Supplementary Data 6; CyTOF, Supplementary Data 7). Finally, we assayed ex vivo responses to drug perturbations using two image-based screening
technologies: iterative indirect immunofluorescence imaging drug response profiling (4i DRP,26, Supplementary Data 8) focusing on short-time signaling responses, and pharmacoscopy
(PCY,13,20,21,27,28, Supplementary Data 9), which measures on-target reductions in AML blasts after 24 h of ex vivo treatment. Our cohort included 21 patients in total (Fig. 1a,
Supplementary Data 1), of which seven were profiled at multiple visits during the course of treatment. These longitudinal samples are further detailed in the Supplementary Case Studies and
Supplementary Figs. 1–6. For the majority of patients, both blood and bone marrow were collected. Emphasizing the feasibility of such multi-omic patient sample profiling, the majority of
patient visits (28/31) were analyzed by at least five technologies, and 10 visits (32%) were analyzed by all technologies (Fig. 1b). The turnaround time from sampling to completion of
analysis across all nodes was maximally 2 weeks, and 30/31 patient visits (97%) were discussed within 4 weeks of sampling in a pre-molecular tumor board (pre-MTB) consisting of members of
each technology node as well as clinical hemato-oncology experts. Because this trial was designed as an observational study with feasibility as the primary outcome, the pre-MTB results were
not used for actual treatment decisions. Nevertheless, the rapid availability of results underlines the feasibility of multi-modal tumor profiling for guiding treatment decisions. CyTOF,
PCY, and proteotyping analyzed blood and bone marrow, whereas all other technologies focused on a single sample per visit. The main reason for missing data was insufficient numbers of viable
cells for distribution across all technologies (“not received” in sheet 2 of Supplementary Data 1). The cohort spanned diverse WHO subtypes and treatment histories. Mutations commonly
affected _FLT3_ (7/21 patients)_, DNMT3A_ (8/21 patients), and _RUNX1_ (8/21 patients) (Fig. 1b), consistent with larger cohorts such as TCGA29 or BEAT-AML30. In addition, we observed a high
frequency (5/21 patients) of single-nucleotide changes with unknown somatic impact in _ROS1_, which are absent in TCGA or BEAT-AML. Large-scale copy number variations (CNVs) were rare, with
approximately half (12/26) of the samples analyzed by scDNA-seq not containing any CNVs (Fig. 1b). To assess whether different single-cell technologies were able to robustly quantify the
fraction of AML blasts per sample, we compared the blast content between different TuPro technologies (Supplementary Fig. 7a, Fig. 1c) and validated their consistency with the blast
fractions obtained by cytology (or histology if no cytology readout was available) performed in clinical routine diagnostics (Supplementary Fig. 7b, Supplementary Data 10). We found strong
agreement among the technologies for blast content, with an average Pearson correlation of 0.67 between TuPro methods, which increased to 0.84 when excluding blast content estimates derived
from scDNA-seq, in line with the large fraction of copy number-neutral tumors. All technologies were in agreement with pathology (_R_ ≥ 0.7, mean _R_ = 0.76). Furthermore, we assessed the
correlation of features measured on matched blood and bone marrow samples from the same patient visit for CyTOF and PCY (Fig. 1d). Blood and bone marrow samples taken at the same visit
showed highly similar protein levels and ex vivo drug responses. This similarity slightly decreased when comparing samples from the same patient across different time points, likely
reflecting the effect of treatment between visits. Nevertheless, it remained greater than that of unmatched samples. Taken together, these results show that our approach robustly measures
molecular and functional profiles in AML patient samples, enabling in-depth integrated analysis of drug responses and their molecular determinants. VENETOCLAX EXPOSURE SHAPES THE EX VIVO
DRUG RESPONSE LANDSCAPE Drug responses in rrAML are governed by a variety of mechanisms, some of which are intrinsic to a patient’s disease, while others are induced by exposure to
treatments. In order to shed light on the drug response landscape of rrAML, we assessed ex vivo drug responses by PCY (Fig. 2a). Overall, we measured responses to 79 drugs or drug
combinations across 48 samples from 18 patients, and included the 38 samples with >5% blast content by pathology in the downstream analysis. We used a “PCY score” corresponding to a
concentration-aggregated relative reduction in AML blasts (relative blast fraction, RBF) as a readout13,20,21. Thus, the PCY score measures a “cellular on-target effect”, i.e., a specific
reduction in the target AML blast cell population. Treatments commonly used in AML, such as chemotherapeutic agents (cladribine, cytarabine, fludarabine) and BCL2i (VEN, navitoclax), were
among the drugs with the highest proportion of on-target effects (Supplementary Fig. 8a). In addition, crenolanib, afatinib, elesclomol, alvocidib, and omacetaxine mepesuccinate also
frequently scored on-target. Interestingly, we observed a subset of 11 samples from 5 patients with low sensitivity to the above-mentioned treatments (Fig. 2a, highlighted in red). These
samples were increasingly sensitive to a group of compounds including the receptor tyrosine kinase (RTK) inhibitors ponatinib, crizotinib, crenolanib, lapatinib, and afatinib as well as
volasertib, a polo-like kinase 1 (PLK1) inhibitor (Fig. 2a, Supplementary Fig. 8b, c). This finding indicates that resistance to specific drug classes may be associated with sensitivity to
others, consistent with previously observed opposite sensitivity patterns across samples for multiple drug classes in the BEAT-AML cohort11. To investigate the relationship between clinical
parameters and ex vivo drug responses and to identify clinically relevant patterns, we next associated PCY scores for each of the tested compounds with sample metadata (Fig. 2a, b).
Parameters with less than five patient observations were excluded from this analysis. The strongest association was identified between treatment with HMA-VEN right before or at the time of
sampling and the ex vivo response to VEN. VEN PCY scores were significantly higher in samples from patients who were not exposed to VEN at the time of sampling compared to those who were
(Fig. 2c). This suggests that we capture treatment-related resistance to VEN in our PCY assay. However, there was a large spread in the response strength (i.e., the percentage of reduction
in the blast fraction) within the non-exposed samples, suggesting that some are innately resistant to Bcl-2i. These observations were further confirmed by 4i DRP, an independent drug
screening measuring morphological and signaling responses after 8 h of ex vivo drug treatment. Across all features recorded by 4i DRP, absolute changes in response to short-term VEN exposure
correlated with the strength of response measured independently by PCY after 24 h (Supplementary Fig. 9a). This was particularly pronounced in early markers of cell death, including
elevated levels of cleaved caspase 3 and reduced nucleus area, as well as signaling by phospho-AKT and phospho-STAT3 (Fig. 2d, Supplementary Fig. 9b). MULTI-MODAL RECOVERY OF INNATE AND
ACQUIRED VEN RESISTANCE MECHANISMS Given the ex vivo VEN resistance observed in patients exposed to VEN at the time of sampling, we compared this treatment-related VEN resistance with the
innate VEN resistance observed ex vivo among the samples from VEN-naive patients who had never been treated with venetoclax (Fig. 3a, Supplementary Data 1). The primary target of VEN is
Bcl-2 (encoded by _BCL2_)31,32. We therefore first focused on the relationship between VEN resistance and Bcl-2 protein and RNA levels in AML blasts. Lower levels of Bcl-2 protein or RNA
were associated with VEN resistance irrespective of whether resistance was treatment-related or innate (Fig. 3b). To further investigate this relationship at the single-cell level, we
clustered the scRNA-seq profiles of 40,369 AML cells from all samples profiled by both PCY and scRNA-seq and visualized them using t-distributed stochastic neighbor embedding (t-SNE, Fig.
3c). As expected, single cells from patients with innate and treatment-related resistance to VEN clustered together, and both showed decreased expression of _BCL2_, suggesting a shared
molecular state. Interestingly, some samples contained cells that spanned multiple phenotypes, indicative of intra-AML heterogeneity with distinct VEN sensitivity in different cell subsets
(Supplementary Fig. 10). Part of this heterogeneity could be explained by differences in blast maturation states, where in some patient samples, blasts covered the full spectrum from a
hematopoietic stem cell-like phenotype to a myeloid-like cell, while other samples were restricted to either only immature or only more differentiated phenotypes (Supplementary Fig. 10c).
Besides downregulation of _BCL2_, several mechanisms of VEN resistance in AML have been described and reviewed33,34,35,36,37. Common resistance mechanisms include mutations in _BCL2, TP53,
KRAS, NRAS_, or _FLT3_38,39. Altered apoptotic dependencies, changes in metabolism, and maturation state are additional known drivers of VEN resistance which are detectable by changes in
transcription (Supplementary Table 1, Fig. 3d, Supplementary Fig. 11a–c). Consistent with previous reports, we found decreased expression of _BCL2_ and _PMAIP1_ (NOXA) to be associated with
VEN resistance, and expression of _BIK_ showed a similar but weaker trend. _CD34_ expression was higher in VEN-sensitive samples, consistent with the notion that VEN primarily targets more
immature AML11,15,23. Finally, the strongest associations in our cohort were found for previously reported metabolic changes related to mitochondrial structure and function (upregulation of
_CLPB_40) and fatty acid metabolism (upregulation of _CD36_41). CD36 was measured both at the protein (CyTOF, proteotyping) and RNA (single-cell and bulk) levels, and its levels in AML
blasts were strongly associated with VEN resistance (Fig. 3e, Supplementary Fig. 11d, e). At the single-cell level, _CD36_ and _BCL2_ expression was nearly mutually exclusive, with only 2%
of cells expressing both genes (Fig. 3c, f). In summary, innate and treatment-related VEN resistance was accompanied by similar molecular features, and linked to known mechanisms of
treatment resistance, such as decreased levels of Bcl-2, more mature cellular state, and changes in mitochondrial metabolism reflected by upregulation of _CLPB_ and _CD36_. GLOBAL
TRANSCRIPTIONAL ANALYSIS LINKS OXIDATIVE PHOSPHORYLATION, PROLIFERATION, AND MITOCHONDRIAL METABOLISM TO VEN RESISTANCE After investigating previously reported mechanisms of VEN resistance
(Supplementary Table 1), we extended our analysis to the whole transcriptome in order to identify the gene expression networks underlying VEN resistance in an unbiased fashion. Consistent
with our previous findings, the associations between innate and treatment-related resistance were strongly correlated (Fig. 4a, Supplementary Fig. 12a–c). To link the individual genes to
pathways, we performed a gene set enrichment analysis (GSEA) using the average strength of associations with innate and acquired resistance to rank the gene list. This revealed an enrichment
of genes related to oxidative phosphorylation (OXPHOS), cell division, ribosome biogenesis, and mitochondrial organization among resistance-associated genes (Supplementary Fig. 12d). This
finding was further confirmed by investigating the top 100 genes associated with VEN resistance in the context of their protein-protein interaction network (based on the STRING database,
Fig. 4b). In addition, we calculated a pathway activation score (singscore42, reflecting the relative expression level of all genes in a pathway) for the terms “nuclear division” and
“OXPHOS”, and these pathway scores were negatively correlated with VEN PCY scores (Fig. 4c). Consistent with previous reports24, the abundance of proteins in the respiratory chain complex
followed a trend opposite to that observed at the level of RNA expression (Supplementary Fig. 12e, f). We next aimed to identify alternative treatments among the drugs tested by PCY that
might be effective for patients with VEN resistance. We utilized our ex vivo drug response data to find compounds that scored on-target in the majority of VEN-resistant samples
(Supplementary Fig. 12g). Among the top candidates, volasertib, an inhibitor of polo-like kinase 1 (PLK1) was on-target in six out of eight VEN-resistant samples (Fig. 4d), coinciding with a
negative correlation between _PLK1_ expression and VEN sensitivity (Fig. 4e). However, _PLK1_ expression alone did not fully explain volasertib response (Supplementary Fig. 12h), and half
of the VEN-sensitive samples were sensitive to volasertib despite low _PLK1_ expression, suggesting that there are additional mechanisms governing drug response. Taken together, integrating
functional and whole-transcriptome data uncovers similarity in the molecular mechanisms underlying both innate and treatment-related resistance to VEN, and identifies a trend towards
increased volasertib sensitivity in VEN resistance. TARGETING CD36 IN VEN-RESISTANT RRAML At the single-cell level, both protein and RNA levels of CD36 were strongly associated with VEN
resistance (Fig. 3d, e). CD36 is a membrane glycoprotein, which, among other functions, acts as a receptor and transporter of fatty acids43, and has been previously implicated in AML
sensitivity to venetoclax41,44,45,46,47. Consistently, we found high levels of CD36 to correlate with reduced overall survival of AML patients in the TCGA and BEAT-AML cohorts (Fig. 5a and
Supplementary Fig. 13). Re-analysis of data from two independent studies that performed bulk RNA-seq and ex vivo drug sensitivity testing to venetoclax further confirmed this association
(Fig. 5b, c). We hypothesized that antibody-mediated blocking of CD36 function may target VEN-resistant AML blasts. We therefore quantified the effect of the anti-CD36 clone FA6-152, which
blocks all functions of CD3648,49, on seven primary AML specimens by PCY (Fig. 5d, e). We included samples with low, medium, and high CD36 levels according to CyTOF measurements
(Supplementary Data 11). In two out of three CD36 high samples, we observed a decrease in AML cells after anti-CD36 exposure (Fig. 5f). This effect was most pronounced in one sample from
patient TP038 taken at the first visit and was dose-dependent, while CD36 blocking had no effect even at the highest dose in CD36-low samples such as TP031 baseline (Fig. 5g). The reduction
in AML cells was accompanied by increased cell-cell interactions (Figure 5h, i), which was again associated with CD36 expression levels in the tested samples. The majority of
cell-interaction clusters observed consisted of a mixture of cell types including AML cells, T-cells, monocytes, and others. To assess potential off-target effects of targeting CD36, we
further investigated which cell types express _CD36_ in our scRNA-seq dataset (Fig. 5j). Expression was highest in mature monocyte-like and erythroid cells, followed by myeloid-like AML.
Immature AML blasts expressed lower levels of _CD36_, consistent with the idea that the CD36-high AML cells may represent a more differentiated monocytic phenotype46 and are selectively
targeted by anti-CD36 antibodies. This notion is further supported by the increased CD36 expression observed in AML with (myelo-)monocytic and erythroid phenotypes in the BEAT-AML cohort
(Fig. 5k). DISCUSSION In this work, we present deep single-cell multiomics profiling of a cohort of 21 patients with rrAML that was characterized at the level of DNA, RNA, protein, and drug
response. Our dataset is a unique resource that complements existing datasets, which typically focus on measurements at the bulk level (TCGA, BEAT-AML11,29,30), and extends the repository of
available scRNA-seq data on AML4,50,51,52,53,54,55,56 with matching single-cell resolved and sample-matched DNA, protein, and functional data. We leveraged the TuPro dataset to investigate
clinical and molecular correlates of drug responses in rrAML. An ex vivo drug response landscape of rrAML measured by PCY highlighted diverse patterns of sensitivity and resistance. Commonly
used AML treatments such as cytarabine induced a reduction of AML blasts in a large fraction of samples, suggesting the presence of a chemosensitive blast population in rrAML. We further
observed a subset of samples with markedly different drug response patterns: While sensitivity to cytarabine, as well as cladribine, fludarabine, and VEN was decreased, these samples were
increasingly sensitive to different RTK inhibitors and the PLK1 inhibitor volasertib. This is in line with previous reports highlighting opposite drug sensitivity patterns in a
maturation-associated manner11,23. Consistently, we report a positive correlation between expression of the leukemic stem cell marker CD34 and venetoclax sensitivity. By analyzing
associations between clinical parameters and ex vivo response, we identified exposure to the Bcl-2i VEN at the time of sampling as one of the main drivers of ex vivo VEN resistance. In
addition, large variability in VEN ex vivo responses among VEN naive samples suggested the presence of innate resistance. In combination with hypomethylating agents, VEN has markedly changed
the perspective of patients ineligible for intensive chemotherapy and almost doubled overall survival38,39. In addition, it has become one of the most promising treatments for rrAML with
response rates of up to 70%, which is remarkable in this disease setting2,57,58,59,60. However, the development of treatment resistance is still common and treatment options for
VEN-resistant patients are limited. We, therefore, focused on understanding the mechanisms underlying innate and treatment-related VEN resistance by performing an in-depth integrative
analysis of the TuPro technologies. Our analysis highlighted similar mechanisms governing both avenues of treatment resistance. We first focused on known molecular changes involved in Bcl-2
inhibitor response33,34,35,36,37. Altered apoptotic dependency was reflected in decreased levels of Bcl-2 (protein and RNA), _PMAIP1_ (NOXA), and _BIK_. Changes in mitochondrial structure
and function affect the readiness to undergo apoptosis in AML cells, and deletion of _CLPB_, which promotes the formation of tighter mitochondrial cristae rescued VEN sensitivity40.
Consistent with these observations, high _CLPB_ expression was associated with innate and treatment-related VEN resistance in this cohort. In addition to changes in mitochondrial structure,
alterations in OXPHOS have also been implicated in VEN resistance44,45,61,62,63. In this cohort, increased expression of genes involved in OXPHOS was associated with VEN resistance, in
addition to elevated levels of the fatty acid receptor and transporter CD36. Switching from amino acids to fatty acids to fuel the TCA cycle and OXPHOS has previously been identified as a
mechanism by which AML cells circumvent the metabolic effects of Bcl-2 inhibition45, thereby leading to venetoclax resistance41. Based on these prior studies and our data, we hypothesize
that increased OXPHOS might be linked to increased availability of fatty acids (through CD36) to fuel the TCA cycle. In turn, high metabolic activity might enable increased proliferation
rates, which we also observe in VEN-resistant samples. CD36 has been implicated in multiple cancers, and high expression is generally associated with poor prognosis64. CD36 in solid tumors
is associated with increased proliferation, plasticity, epithelial-mesenchymal transition, and metastatic potential. Blocking CD36 in a mouse model of human oral carcinomas decreased
metastasis potential49. Anti-CD36 thus emerged as a promising target to prevent cancer spread and is currently being developed as a therapeutic agent65. In the context of AML, high
expression of CD36 correlates with poor prognosis in TCGA and BEAT-AML and was associated with chemoresistance, relapse, and extramedullary disease66 as well as resistance to VEN41,46,47.
Having observed a correlation between VEN ex vivo sensitivity and CD36 levels, we used antibody-mediated CD36 blocking to specifically target VEN-resistant AML cells. We observed reduced
numbers of AML cells upon exposure to anti-CD36, in conjunction with increased cell clumping. Cell clusters were composed of both AML cells, T-cells, and myeloid cells. Increased cell-cell
interaction likely indicates an immune activation phenotype triggered by the presence of antibody-coated cells. Thus, we hypothesize that CD36 treatment may target leukemic cells on multiple
levels. Firstly, by blocking the CD36-mediated uptake of fatty acids, it may impact the cells metabolic landscape and potentially lower OXPHOS and cell growth41,45. Second, it may guide the
immune-mediated destruction of CD36-expressing cells. Interestingly, blocking CD36 on T-cells has also been reported to decrease the immunosuppressive function of regulatory T-cells67,
which could further enhance this effect. Overall, our findings propose CD36 as a promising immunotherapeutic target for VEN-resistant rrAML. CD36 blockage showed promising activity in vivo
in a mouse model of human oral carcinoma49. In the future, our findings will need to be validated in an AML patient-derived xenograft model treated with an anti-CD36 blocking antibody in
order to improve the pre-clinical evaluation of this approach. Our data also highlighted a role for increased proliferation in VEN-resistant samples, which has been observed before in CLL68
but not AML. This proliferative signature was accompanied by increased expression of _PLK1_ and ex vivo sensitivity to the PLK1 inhibitor volasertib in 75% of the VEN-resistant samples.
Volasertib as a monotherapy or in combination with low-dose cytarabine or decitabine has shown promising activity as a treatment for AML patients who are not eligible for intensive
chemotherapy in phase 1/2 clinical trials69,70. However, this could not be confirmed in a follow-up phase 3 trial, and volasertib development has since been discontinued71. These findings
suggest that Volasertib could still be evaluated in the setting of VEN resistance, particularly in rrAML patients with high PLK1 expression. In conclusion, we here provide a valuable
resource of multi-modal molecular and functional profiling of rrAML at single-cell resolution. Analysis results were available within 2 weeks of sampling, highlighting the feasibility and
clinical applicability of our approach. The resulting integrative analysis revealed shared molecular signatures of innate and acquired resistance to venetoclax and identified emerging
treatment opportunities. METHODS STUDY DESIGN AND PARTICIPANTS The Swiss TumorProfiler (TuPro) was conducted as a prospective, non-randomized observational clinical study with feasibility as
the primary outcome. Treatments of this AML cohort during the study were solely based on current clinical guidelines and the decisions made by the treating physician and the patient. For
the hematology arm of the TuPro presented in this work, patients with acute myeloid leukemia according to WHO 2016 who were refractory to standard therapy or who developed a relapse were
eligible if they fulfilled the following additional criteria: * Age ≥ 18 years * Written informed consent according to national legal and regulatory requirements prior to any
project-specific procedures Patients, who fulfilled the following exclusion criteria were not considered for this project: * Any other serious underlying medical, psychiatric, psychological,
familial, or geographical condition, which in the judgment of the project leader may interfere with the project or affect patient compliance * Concurrent history of active malignancy in the
two past years prior to diagnosis (except basal and squamous cell carcinoma of the skin and in situ carcinoma of the cervix) * Concurrent severe and/or uncontrolled medical condition (e.g.,
uncontrolled diabetes, infection, hypertension, pulmonary disease) * Cardiac dysfunction (NYHA classification II-IV or unstable angina or unstable cardiac arrhythmias) * Legal incompetence
In total, 21 patients were enrolled in this study over a period of 18 months starting in September 2019 and finishing at the end of March 2021. Follow-up samples were obtained for 7
patients. TP035 was a patient with myelodysplastic syndrome with excess of blasts with disease progression at the time of TuPro sampling. At the majority of patient visits, both blood and
bone marrow were sampled, resulting in a total of 57 samples collected and included in this study. Cohort characteristics are summarized in Supplementary Data 1. The research project was
carried out in accordance with the research plan and with principles enunciated in the current version of the Declaration of Helsinki (DoH), the Principles of Good Clinical Practice (GCP),
the Swiss Law, and Swiss regulatory authority’s requirements as applicable. All patients provided written informed consent to publish their anonymized clinical and molecular data as part of
this study. Ethical approval was granted by the Ethics Committee of the Canton of Zurich (CEC Zurich, BASEC-Nr: 2019-01326). SAMPLE PREPARATION Blood samples and/or bone marrow aspirates
were collected in BD vacutainer EDTA tubes and PBMC was immediately isolated by histopaque gradient purification (Histopaque-1077, Sigma-Aldrich). Live cell number was established using a
nucleocounter NC 200 using Via1 Cassettes (Chemometec) and the required number of cells was prepared for the different technology platforms. For Pharmacoscopy and scRNA sequencing, cells
were viably frozen in 10% DMSO in RPMI 1640 medium (Gibco). For Proteotyping, cells were snap frozen as a dry pellet in liquid nitrogen upon red blood cell lysis (10x Red Blood Cell Lysis
solution, Biolegend). For CyTOF, cells were stained for dead cells using 25 μM Pt194 (Standard BioTools) in a 1 min pulse before quenching with 10% FBS. Cells were then fixed with 1.6%
paraformaldehyde (Electron Microscopy Sciences) for 10 min at room temperature and stored at −80 °C. Ready-to-use samples were sent to the technology platforms in a coordinated way to be
processed simultaneously, with an expected 2-week turn-around time. PHARMACOSCOPY EXPERIMENTAL COMPOUNDS AND DRUG PLATES All compounds were purchased from Sigma-Aldrich as 5 mM stock
solutions in DMSO. 384-well flat-bottom plates (Perkin Elmer PhenoPlate) containing between 0.1 and 10 μM of drugs or drug combinations per well (Supplementary Data 12) were prepared using
an Echo liquid handling robot (Labcyte). Plates were sealed with aluminum foil and stored at −20 °C until used. EX VIVO DRUG RESPONSE ASSAY Pharmacoscopy (PCY) was performed as previously
described13,20,27,72. Briefly, mononuclear cells isolated from blood or bone marrow were resuspended in media (RPMI-1640 (Gibco) + 10% fetal bovine serum (Gibco)) at a density of around 0.1
million cells/ml. 50 μl of cell suspension (5000 cells) were then seeded into each well of a drug assay plate. Cells were incubated with compounds at 37 °C, 5% CO2 for 24 h. Afterward, the
media was aspirated and cells were fixed with 10% (v/v) formalin (Sigma-Aldrich F8775, 36–38% formaldehyde + 10–15% methanol in water) for 10 min at room temperature. Fixative was aspirated
and the cells were resuspended in PBS. To quench background fluorescence, the plate was put on an LED lamp overnight. Afterward, PBS was aspirated and 20 μl / well of 5% (v/v) FBS, 0.1%
(v/v) Triton-X, 5 μg/ml 4′,6-Diamidino-2-phenyl-indol-dihydrochlorid (DAPI) were added to the cells to block nonspecific antibody binding, permeabilize them and stain the nucleus. After 30
min at room temperature, this solution was aspirated and 20 μl/well staining solution (10 mg/ml BSA in PBS, fluorescently labeled antibodies CD117 [AF488, BioLegend 313234], CD34 [PE,
BioLegend 343505], and CD33 [AF647, BioLegend 366626], each antibody at 1:300 dilution) was added. Cells were stained overnight at 4 °C. Afterwards, the staining solution was aspirated and
wells were covered with 70 μl of PBS. CD36 BLOCKING EXPERIMENT CD36 blocking experiment was performed analogous to ex vivo drug screening described above. Instead of small molecules, we
added between 0.01 and 1 μg/ml anti-CD36 FA6-152 (Abcam ab17044) or matching isotype control (Mouse IgG1 kappa, BioLegend 401401) per well. Cells were fixed and stained as described above,
with the only difference being that we swapped the CD33 antibody for a combination of CD3 (BioLegend 300416) and CD14 (BioLegend 325612). HIGH-THROUGHPUT CONFOCAL MICROSCOPY All plates were
imaged on an automated spinning-disk confocal microscope (PerkinElmer Opera Phenix), using 10x magnification and 9 images per well to cover the entire well area. We used five channels with
non-overlapping excitation/emission filters to image the following features: Channel 1 (transmission / 650–760 nm) for brightfield to capture general cell shape and texture, channel 2 (405
nm/435–480 nm) for DAPI/nuclei, channel 3 (488 nm/500–550 nm) for CD117, channel 4 (561 nm/570–630 nm) for CD34, and channel 5 (640 nm/650–760 nm) for CD33. For the CD36 blocking experiment,
we used the same parameters but imaged at 20x magnification with 25 images per well. ANALYSIS IMAGE ANALYSIS AND FEATURE EXTRACTION Raw images were first analyzed using CellProfiler
v.2.2.073. Individual cells were detected based on maximum correlation thresholding of the DAPI signal. Staining intensities were extracted for the nucleus and a region of 6 pixels around
the nucleus that was used as a proxy for cytoplasmic intensity. For downstream analysis, intensities were log10 transformed and corrected for variation in local background as described by
Vladimer et al.74. FILTERING Cells with very low DAPI intensities or abnormally high or low nucleus area likely represent segmentation artifacts and were therefore removed from the analysis
by manual gating. In addition, outlier wells (very low or high total cell numbers, or aberrant staining patterns) were removed if the observed patterns could be attributed to pipetting
mistakes or the presence of large cell clumps by visual inspection. IDENTIFICATION OF AML CELLS AML cells were identified by thresholding the CD117 and CD34 intensities. Any cell positive
for at least one of these two markers was considered a blast. CALCULATION OF DRUG RESPONSE SCORES Drug response scores (1-relative blast fraction, RBF) per well were calculated as follows:
1-RBF = 1-(fraction of blast cells in drug condition/mean(fraction of blast cells in DMSO)) The responses were then averaged (mean) across replicate wells per condition (where a condition
describes one drug at one concentration), and responses per drug were further aggregated into a PCY score by taking the mean across these condition averages per drug. Thus, PCY score = mean
per drug(mean per condition(1-RBF)). CLUSTERING OF DRUG RESPONSES FOR VISUALIZATION For visualization in Fig. 2A, drug responses were clustered across drugs and samples using hierarchical
clustering as implemented by the Matlab _linkage_ function, using Euclidean distance and complete linkage. Only samples with > 5% blasts by pathology were included in this analysis.
ASSOCIATIONS WITH CLINICAL PARAMETERS Associations with clinical parameters were calculated for each individual drug. Samples were split by the levels of each clinical parameter, and each
level was tested separately against all the others. For statistical testing, a Wilcoxon rank-sum test was used (Matlab _ranksum_). _P_ values were corrected for multiple testing using the
Benjamini-Hochberg procedure. (Matlab _mafdr_ with BHFDR set to true). QUANTIFICATION OF CELL-CELL INTERACTIONS Cell-cell interactions in the CD36 blocking experiment were quantified from
the nucleus center positions obtained from CellProfiler. A cell was considered to be interacting if there was at least one other nucleus within 30 pixels from its own nucleus center. We used
the fraction of interacting cells among all cells per well as a readout. Due to the non-adherent nature of AML cells, cells tend to cluster at the edges of the well and in the corners as a
result of our washing and staining procedure. To avoid technical artifacts, we therefore restricted this analysis to nuclei that were at least 3000 pixels (900 μm) away from the well border.
SCRNA-SEQ EXPERIMENTAL Viability and cell count of the single-cell suspensions were assessed with a Cellometer K2 (Nexcelom Bioscience). Single cells were captured with the Chromium
Controller and scRNA-seq libraries were prepared with the Chromium Single Cell 3’ v3 Library & Gel Bead Kit (10x Genomics) according to the manufacturer’s instructions. QC assessment of
cDNAs and libraries was performed with Fragment Analyzers (Advanced Analytical, AATI). Libraries were sequenced with Illumina NextSeq 500 and NovaSeq 6000 systems according to the
manufacturer’s guidelines. ANALYSIS DATA PRE-PROCESSING A detailed description of the scRNA analysis pipeline used in this study was published previously75. Briefly, the analysis consists of
the following steps: (1) read data processing, quality control, and normalization, (2) cellular composition analysis including cell type classification and unsupervised clustering, (3)
differential gene expression analysis, (4) gene expression and pathway scoring. CELL TYPING Each cell in the dataset was assigned a label using the scROSHI76 workflow. Briefly, cells are
classified based on expression of cell-type specific genes (Supplementary Data 13) using a two-step procedure that takes into account the hierarchical nature of cell types. In the first
step, a “major cell type” (e.g., myeloid blast, T-cell, B-cell) is assigned. In the second step, this assignment is refined and cell subtypes are assigned within each major cell type. The
gene lists for the major cell types were generated based on unsupervised clustering and marker identification (Seurat: FindMarkers77,78) of the first three samples in this study (Sample IDs:
DOROFEG, UBADAFA, DOROBOF). The markers for non-malignant cell subtypes were obtained from CIBERSORT79, and the markers for AML subtypes were based on van Galen et al.4. BULKIFICATION For
cohort-level analyses, where the patient is the fundamental subject of observation, and in order to reduce complexity, read counts for each gene were aggregated (summed up) selectively
across groups of cells within a patient. Depending on the focus of the analysis, the grouping is performed on cells within a cell type or within a cluster of cells within a cell type. This
procedure is sometimes called selective bulkification. As a consequence of this aggregation, gene counts are not low and sparse as in single-cell data but large and frequent enough to be
analyzed with conventional bulk methods. For all sample-level analyses presented in this manuscript, we used selective bulkification across all cells typed as “AML” per sample. Thus, the
scRNA-seq expression represents the average expression in AML blasts per sample. AGGREGATION ACROSS PATIENTS AND CALCULATION OF TSNE For the t-SNEs shown in Fig. 3c, f, and Supplementary
Fig. 10a–c, raw counts of all cells classified as AML from all samples with >5% blast content were aggregated and normalized using scran (v.1.20.1)80. The normalized counts were then
batch-corrected using the _mnnCorrect_ function implemented in the Batchelor R package (v.1.8.0)81, with patient IDs as batches. Top 10% most variable genes were identified by the NBDrop
method implemented in the M3Drop R package (v.1.18.0) applied to the raw counts. The batch-corrected expression values of these most variable genes were used as input for t-SNE. The
embedding was calculated using _fitsne_ implemented in the R package snifter (v.1.2.0), which provides a wrapper to the FI-tSNE implementation from the Python package openTNSE82,83.
Perplexity was set to 50 and exaggeration to 1. All other parameters were left at their defaults. CLUSTERING OF SINGLE-CELL EXPRESSION PROFILES Single-cell clusters shown in Supplementary
Fig. 10 were obtained by spectral clustering using Rphenograph (v.0.99.1). The batch-corrected expression values were used as input, and the number of nearest neighbors _k_ = 50 was used.
All other parameters were left at their default values. CALCULATION OF PATHWAY SCORES Pathway activation scores were calculated from bulkified expression profiles using a rank-based method
as implemented in the singscore R package42, with all parameters left at their default values. This method works by first ranking all genes per sample by increasing expression level. A
directed pathway score (assuming that a pathway is more active the higher the corresponding genes are expressed) for a given gene set is then defined as the average, mean-centered rank of
all genes in that gene set. Pathway scores thus reflect the relative mean percentile rank of the target gene sets within each sample, and a sample with a high score has higher relative
expression of the genes in a given pathway. SCDNA-SEQ EXPERIMENTAL Viability and cell count of the single-cell suspensions were assessed with a Cellometer K2 (Nexcelom Bioscience). Single
cells were captured with the Chromium Controller and scDNA-seq libraries were prepared with the Chromium Single Cell DNA Library & Gel Bead Kit (10x Genomics) according to the
manufacturer’s instructions. QC assessment of sequencing libraries was performed with Fragment Analyzers (Advanced Analytical, AATI). Libraries were sequenced with Illumina’s NovaSeq 6000
system according to the manufacturer’s guidelines. ANALYSIS In total, 26 clinical samples were processed from 18 patients. After each sample was sequenced, the barcoded reads were mapped and
assigned to their individual cells. The reads are binned into 20 kb genomic regions which are corrected for GC content and mappability using the CellRanger software. The adjusted number of
reads in each bin reflects the underlying copy number state of that genomic region. To identify copy number aberrations, we first detect potential breakpoints by pooling information related
to differences in read counts across all cells. After segmenting the genome in this fashion, cells are clustered into clones and the copy number profiles of the clones along with their
phylogenetic relationships are inferred. These analyses were performed using a version of the SCICoNE software84. Close to half (12/26) of the AML samples have no detected CNAs. Amongst the
non-diploid cells, the downstream analysis identified 34 clones among the remaining 14 samples. BULK RNA-SEQ EXPERIMENTAL Total RNA was isolated from cell suspensions using the Quick-RNA
Microprep Kit (Zymo Research) including DNase I treatment according to the manufacturer’s instructions. The quality of the isolated RNA was checked with a 4200 TapeStation device (Agilent).
RNA-seq libraries were prepared using TruSeq Stranded Total RNA Library Prep Gold reagent kits (Illumina) according to Illumina’s guidelines. QC of sequencing libraries was performed using
Fragment Analyzer systems (Advanced Analytical, AATI). Libraries were pooled and sequenced PE100 on an Illumina NovaSeq 6000 system to target 100 million reads per library. ANALYSIS
Alignment to the reference genome (GRCh38) was performed with STAR85. The raw expression counts were obtained using simple counting, an in-house pipeline accessible through github:gromics
(at commit #67e1f4e). Counts were normalized for differences in library size using relative log expression as implemented in edgeR’s calcNormFactor, with the method parameter set to ‘RLE’.
Note that this is equivalent to the default normalization employed by DESeq2. For downstream analysis, a pseudocount of 1 was added to the normalized counts and they were log2 transformed.
CYTOF EXPERIMENTAL PBMCs isolated from BM or peripheral blood were stained for viability with 25 μM cisplatin (Enzo Life Sciences) in a 1 min pulse before quenching with 10% FBS. Up to 10
patient samples were barcoded and mixed with a pre-barcoded set of reference cells as described previously in order to allow for batch correction86. Pooled barcoded cells were incubated for
10 min at 4 °C with FcR blocking reagent (Miltenyi Biotec) and were subsequently split in two aliquots and stained with 100 µL of an AML antibody panel per 107 cells (Supplementary Data 14).
Upon staining, cells were washed three times in Cell Staining Media (CSM, PBS 0.5% BSA and 2 mM EDTA). To enable cell detection, cells were stained overnight at 4 °C with the DNA
intercalator Ir191/193 (0.5 µM, Standard BioTools). Samples were then prepared for CyTOF acquisition by washing the cells successively in CSM, PBS, and water. Cells were then diluted to 0.5
× 106 cells/mL in Cell Acquisition Solution (Standard BioTools) containing 10% EQ™ Four Element Calibration Beads (Standard BioTools) and acquired on a Helios upgraded CyTOF 2 (Standard
BioTools). ANALYSIS DATA PRE-PROCESSING AND CELL TYPE CLASSIFICATION FCS files were preprocessed as described previously to identify individual patient samples based on single-cell
debarcoding and to perform spillover correction, batch correction, and live cell identification86,87. The main cell types present in each sample, including B-cells, T/NK-cells, myeloid
cells, granulocytes, platelets, and AML cells were identified using a random forest classifier trained on manually gated cell populations in Cytobank. Specifically, CD34-positive AML cells
were defined as CD34 high CD45 low. We also observed a population of cells that was negative for most of the tested markers. This population may represent an atypical type of AML cell and
was labeled as “putative AML” (see Supplementary Fig. 8a). Because this population likely includes both malignant and nonmalignant myeloid progenitors, we also considered those cells as AML,
however, we only included samples with > 5% blasts by pathology in the downstream analyses. COHORT-LEVEL ANALYSES For comparisons of marker intensities across the full cohort, the levels
of each protein were averaged across all cells of a certain cell type per sample. All comparisons shown in this work were performed using the average marker intensities across all AML cells
(CD34 positive and putative AML). PROTEOTYPING EXPERIMENTAL Samples for proteotyping were generated using the PreOmics iST kit (PreOmics). In short, cells were lysed, digested, and cleaned
up according to the manufacturer’s recommendations. Lysis was supported but an additional sonication step using three 30 s sonication pulses in a VialTweeter (Dr. Hielscher). The tryptic
digest was performed for 3 h. Samples were resuspended at a concentration of 1 μg/μl for MS measurements. As control and reference between the different sample batches leukemia cell lines
NB-4,CMK-11-5, and MV-4-11 were mixed in a ratio of 1:1:1 and then digested and prepared as described above. 34 patient samples (_n_ = 1) together with 13 controls were measured on an
Orbitrap Lumos mass spectrometer (Thermo Fisher Scientific) or alternatively on a Q Exactive HF-X mass spectrometer (Thermo Fisher Scientific) equipped with an Easy-nLC 1200 (Thermo Fisher
Scientific). Peptides were separated on a C18 50 cm EASY-Spray™ HPLC column (2 µm, 100 Å, 75 µm i.d.(ES903, Thermo Fisher Scientific)). Mobile phase A consisted of HPLC-grade water with 0.1%
formic acid, and mobile phase B consisted of HPLC-grade ACN (80%) with HPLC-grade water and 0.1% (v/v) formic acid. Peptides were eluted at a flow rate of 200 nl/min using a non-linear
gradient from 4% to 52% mobile phase B in 117 min. For data-independent acquisition (DIA) on the HF-X, DIA isolation windows were set to 15 m/z, and a mass range of m/z 400-1210 was covered.
A total of 54 DIA scan windows were recorded at a resolution of 30,000 with an AGC target value set to 1e688,89. For DIA on the Lumos, DIA isolation windows were variable and a mass range
of m/z 350–1650 was covered. Resolution was set to 30,000 with a normalized AGC target of 2000%. HCD fragmentation was set to 24%, 27%, 30% stepped (Lumos), or 28% normalized (HF-X)
collision. Full MS spectra were recorded at a resolution of 120,000 with a normalized AGC target of 250% and a maximum injection time of 60 ms (Lumos) or an AGC target of 3e6 and maximum
injection time of 50 ms (HF-X). ANALYSIS DIA data were analyzed using Spectronaut v13 (Biognosys). MS1 values were used for peptide quantification, peptide quantity was set to sum. Data were
filtered using Qvalue with a precursor Qvalue cut-off of 0.001 and a protein Qvalue cut-off of 0.01 FDR. PTM localization was set to True and the probability cutoff to 0.75. Interference
correction was performed. Quantitation was set to Qvalue identified, missing values were imputed with the missing values derived from the experiment-wide distribution of quantities. Data
were searched against a Uniprot human library (release September 2019) together with standards and common contaminants in standard DIA with an in-house generated spectral library containing
cell lines, patients, and healthy samples. Protease cleavage was defined as Trypsin (full) with a maximum of two miscelavages. C-Carbamidomethylation was set as static, M-Oxidation, and
N-terminal acetylation as dynamic modifications. The minimal peptide length threshold was six amino acids. Mass tolerance for precursors was 10 ppm and fragment ion mass tolerance was set to
0.02 Da. The minimum number of unique peptides for protein identification was one. Batch correction on the Spectronaut peptide output was performed using proBatch90. CALCULATION OF PATHWAY
SCORES Pathway activation scores were calculated from blast-content corrected protein abundance profiles using the same method as described above for scRNA-seq (singscore42). 4I DRP
EXPERIMENTAL Prior to cell seeding, 384-well plates were coated for 2 h at room temperature (RT) with a coating mix (1:1 Poly-L-Lysine (Sigma Aldrich, P4832-50ML), 1:100 Fibronectin (Sigma
Aldric, F0895-2MG) in PBS). The coating mix was removed using an EL406 Washer-Dispense (WD) and the 384-well plate was left 1 h at RT to dry. Depending on the abundance of live cells in the
patient samples, 3500–7500 cells were seeded per well of a 384-well plate using the WD’s peripump cassette in culture medium (RPMI without L-Glutamine (Sigma Aldrich, R0883), 10% FCS (Sigma
Aldrich), 1 mM Sodium Pyruvate (Thermo Fisher Scientific, 11360070), 2 mM L-Glutamine (Sigma Aldrich, G7513), Anti/Anti 100x (Gibco CatNr: 15240-096)). The cells were incubated overnight at
37 °C and 5% CO2. The next day, drugs were added using a BRAVO liquid handling robot to the seeded cells at a final concentration of 5 µM and 0.5% DMSO. Vehicle-treated control cells were
only incubated with 0.5% DMSO. The drug-treated cells were incubated at 37 °C and 5% CO2 for a further 8 h. After elapsing of the incubation time, the cells were fixed at 4% Paraformaldehyde
(Electron Microscopy Sciences) in PBS for 15 min. After which, they were washed 4 times with PBS and permeabilized at 0.5% Triton X-100 (Sigma Aldrich) in PBS for 15 min. Next, the cells
were washed 4 times with double distilled water (ddH2O). Next, iterative indirect immunofluorescence imaging (4i) was performed on the samples to acquire the following molecular markers:
CD33, CD34, CD117, CD45, Histone H3 Lysine 4 methylation (H3K4Met), proliferating cell nuclear antigen (PCNA), phospho-ERK, phospho-STAT3, phospho-AKT, phospho- ribosomal protein S6 kinase 1
(pS6K1), c-Myc, tubulin, cleaved caspase 3 (Cl.CASP3), and SC-35 (Supplementary Data 8). For a detailed 4i protocol, see refs. 26,91. Sample blocking, primary and secondary incubation were
performed for 1 h. The nucleus of cells was stained using DAPI (every cycle). The cell out staining was performed as described by Battich et al.92. Imaging was performed using a Cytiva IN
Cell 6000 at 20X magnification with a Nikon Plan Apo (0.95 NA), correction collar 0.11-0.23 CFI/Lambda objective. 16 fields of view were imaged per well, with 3 z-sections per field. The
Z-sections were collapsed to one image by Maximum Intensity Projection. Laser lines used for the study: 406 nm, 488 nm, 568 nm, 625 nm. ANALYSIS Image processing and image analysis tasks on
the 4i images were performed using TissueMaps (https://github.com/pelkmanslab/TissueMAPS). The tasks include image alignment of 4i cycles based on the DAPI signal, correction of the
illumination bias, nuclear and cell segmentation, measurements of nuclear and cell morphology as well as measurements of intensity moments of the different fluorescence signals in nucleus
and cell objects. To link the 4i DRP features to PCY-based ex vivo responses, single-cell resolved measurements in AML blasts (CD34 or CD117 positive) were averaged across drug-containing
wells and normalized to DMSO control. Association with PCY ex vivo responses was performed using a linear regression model with the PCY response to VEN as a predictor and each
DMSO-normalized 4i DRP feature in the VEN condition as the response variable. INTEGRATIVE ANALYSIS For all integrative analyses, we excluded samples with <5% blast content by pathology
(see Supplementary Data 1, column “Flagged for low blast content”). Sex-stratified analysis was not performed due to the limited size of the cohort. ASSOCIATION OF INNATE AND
TREATMENT-RELATED VEN RESISTANCE WITH MOLECULAR MEASUREMENTS To quantify the association of treatment-related VEN resistance with patient-level gene and protein expression, we first z-scored
the expression data derived from CyTOF, scRNA, bulk RNA, and prototyping. Then, we performed one two-tailed Welch’s t-test (R _t.test_, var.equal set to false) per gene/protein, comparing
samples with exposure to VEN at the time of sampling to those without. The effect size was calculated as the difference in mean RNA / protein level between VEN naive and VEN exposed samples.
To assess the relationship between innate resistance and protein/RNA expression levels, we subset the cohort to only contain VEN naive samples. Then, we performed a linear regression model
per protein/gene, with the z-scored protein/RNA levels as the response variable and ex vivo response scores to VEN as a predictor. The slope of the regression line was then used to measure
effect size. In order to have effect sizes on a similar scale as for the association with acquired resistance, we scaled the ex vivo response scores to between 0 and 1. In all of those
comparisons, samples from patients who had received venetoclax in earlier treatment lines (not directly at the time of sampling) were excluded. GENE SET ENRICHMENT ANALYSIS (GSEA) FOR VEN
RESISTANCE-ASSOCIATED GENES GSEA was performed on GO Terms using the gseGO function from the clusterProfiler R package93,94. We restricted the analysis to the GO:Biological process (BP) gene
set category and the eps parameter was set to 0. All other parameters were left at their default values. Genes were ranked by their average association with innate and acquired VEN
resistance. Top terms were selected based on the adjusted _P_ value of the enrichment and sorted by normalized enrichment score (NES) for visualization. VISUALIZING THE STRING NETWORK OF TOP
ASSOCIATED GENES A complete network of human protein interactions was obtained from STRING, using the STRINGdb R package (v. 2.4.2, database version 11.5)95 A score threshold of 500 was
used. This network was then filtered to only retain the top 100 genes associated with VEN resistance. As for GSEA, genes were ranked by their mean association with innate and acquired VEN
resistance. For visualization, only genes connected to at least one other gene were retained. In addition, clusters with less than 3 genes were omitted. ANALYSIS OF PUBLICLY AVAILABLE
DATASETS TCGA: ASSOCIATION OF _CD36_ EXPRESSION AND OVERALL SURVIVAL Gene expression data (“rna_seq.augmented_star_gene_counts.tsv”) from the TCGA-LAML cohort was downloaded from the GDC
data portal (https://portal.gdc.cancer.gov/projects/TCGA-LAML, accessed 15th September 2023). Raw counts were normalized and transformed using the normTransform function in DESEq2
(v.1.32.0)96. The cohort was stratified into low and high _CD36_ expression using an automatically determined threshold as implemented in the _surv_cutpoint_ function from the survminer R
package (v.0.4.9). Overall survival was obtained from the TCGA clinical data (“days_to_death”). Patients with vital status “Alive” were marked as censored at the time of last follow-up
(“days_to_last_follow_up”). Survival analysis was performed using the R package survival (v3.2-11), using a log-rank test as implemented in the _survfit_ function, and the result was
visualized using survminer’s _ggsurvplot_. BEAT-AML: CORRELATION OF CD36 EXPRESSION WITH VEN EX VIVO RESPONSE _CD36_ gene expression, clinical data, and venetoclax ex vivo responses were
downloaded from the BEAT-AML web interface (http://www.vizome.org/aml2/, accessed 12. September 2023). Association between _CD36_ expression and venetoclax ex vivo response (AUC) was
assessed using a linear regression model. BEAT-AML: ASSOCIATION OF _CD36_ EXPRESSION AND OVERALL SURVIVAL Survival data and harmonized gene expression data across all 4 waves of BEAT-AML
were downloaded from https://biodev.github.io/BeatAML2/ (accessed 24. May 2024). The cohort was stratified into low and high _CD36_ expression using an automatically determined threshold as
implemented in the _surv_cutpoint_ function from the survminer R package (v.0.4.9). Survival analysis was performed using the R package survival (v3.2-11), using a log-rank test as
implemented in the _survfit_ function, and the result was visualized using survminer’s _ggsurvplot_. REPORTING SUMMARY Further information on research design is available in the Nature
Portfolio Reporting Summary linked to this article. DATA AVAILABILITY The publicly available data used in this study are available from BEAT-AML under http://www.vizome.org/aml2 and
https://biodev.github.io/BeatAML2/11; TCGA under https://portal.gdc.cancer.gov/projects/TCGA-LAML29; and the STRING database under https://string-db.org/ or via the stringdb R package (v.
2.4.2)95. The raw sequencing data (bulk- and single cell RNA-seq, single-cell DNA-seq) generated in this study have been deposited in the European Genome-Phenome Archive (EGA) under the
accession codes EGAD50000000822, EGAD50000000823 and EGAD50000000824. The data is available under restricted access due to patient privacy concerns. Access can be requested by contacting the
Tumor Profiler Center (TPC) leadership (https://tumorprofilercenter.ch/contacts). Data access will be granted to registered users listed on the data access agreement with the TPC within
four weeks of receipt of the Data Access Agreement, provided that the applicant provides all necessary ethics committee approval and supporting documents needed to meet the requirements of
the agreement. The user institution agrees to destroy or discard the data once it is no longer used for the project, and in cases where data must be archived, it must be deleted within 10
years of the project’s completion. If data has not been archived, it must be deleted no later than 2 years following the completion of the project. An extension to this period can be
provided upon request to the TPC leadership. The raw proteomics data generated in this study have been deposited in MassIVE under the accession MSV000092970. The processed data for scRNA-seq
and CyTOF are available from Zenodo under https://doi.org/10.5281/zenodo.13837019. The remaining data are available within the Article, Supplementary Information, or Source Data file.
Source data are provided with this paper. REFERENCES * Roboz, G. J. et al. International randomized phase III study of elacytarabine versus investigator choice in patients with
relapsed/refractory acute myeloid leukemia. _J. Clin. Oncol._ 32, 1919–1926 (2014). Article CAS PubMed Google Scholar * Bewersdorf, J. P. et al. Venetoclax-based salvage therapy in
patients with relapsed/refractory acute myeloid leukemia previously treated with FLT3 or IDH1/2 inhibitors. _Leuk. Lymphoma_ 64, 188–196 (2023). Article CAS PubMed Google Scholar *
Morita, K. et al. Clonal evolution of acute myeloid leukemia revealed by high-throughput single-cell genomics. _Nat. Commun._ 11, 5327 (2020). Article ADS CAS PubMed PubMed Central
Google Scholar * van Galen, P. et al. Single-Cell RNA-Seq Reveals AML Hierarchies Relevant to Disease Progression and Immunity. _Cell_ 176, 1265–1281.e24 (2019). Article PubMed PubMed
Central Google Scholar * Miles, L. A. et al. Single-cell mutation analysis of clonal evolution in myeloid malignancies. _Nature_ 587, 477–482 (2020). Article ADS CAS PubMed PubMed
Central Google Scholar * Wu, J. et al. A single-cell survey of cellular hierarchy in acute myeloid leukemia. _J. Hematol. Oncol._ 13, 128 (2020). Article PubMed PubMed Central Google
Scholar * Beneyto-Calabuig, S. et al. Clonally resolved single-cell multi-omics identifies routes of cellular differentiation in acute myeloid leukemia. _Cell Stem Cell_ 30, 706–721.e8
(2023). Article CAS PubMed Google Scholar * Tyner, J. W. et al. Kinase pathway dependence in primary human leukemias determined by rapid inhibitor screening. _Cancer Res_. 73, 285–296
(2013). Article CAS PubMed Google Scholar * Kurtz, S. E. et al. Molecularly targeted drug combinations demonstrate selective effectiveness for myeloid- and lymphoid-derived hematologic
malignancies. _Proc. Natl Acad. Sci. USA_ 114, E7554–E7563 (2017). Article CAS PubMed PubMed Central Google Scholar * Pemovska, T. et al. Individualized systems medicine strategy to
tailor treatments for patients with chemorefractory acute myeloid leukemia. _Cancer Discov._ 3, 1416–1429 (2013). Article CAS PubMed Google Scholar * Bottomly, D. et al. Integrative
analysis of drug response and clinical outcome in acute myeloid leukemia. _Cancer Cell_ 40, 850–864.e9 (2022). Article CAS PubMed PubMed Central Google Scholar * Bhatt, S. et al.
Reduced mitochondrial apoptotic priming drives resistance to BH3 mimetics in acute myeloid leukemia. _Cancer Cell_ 38, 872–890.e6 (2020). Article CAS PubMed Google Scholar * Snijder, B.
et al. Image-based ex-vivo drug screening for patients with aggressive haematological malignancies: interim results from a single-arm, open-label, pilot study. _Lancet Haematol._ 4,
e595–e606 (2017). Article PubMed PubMed Central Google Scholar * Kuusanmäki, H. et al. Ex vivo venetoclax sensitivity testing predicts treatment response in acute myeloid leukemia.
_Haematologica._ https://doi.org/10.3324/HAEMATOL.2022.281692 (2022). * Kuusanmäki, H. et al. Phenotype-based drug screening reveals association between venetoclax response and
differentiation stage in acute myeloid leukemia. _Haematologica_ 105, 708–720 (2020). Article PubMed PubMed Central Google Scholar * Spinner, M. A. et al. Ex vivo drug screening defines
novel drug sensitivity patterns for informing personalized therapy in myeloid neoplasms. https://doi.org/10.1182/bloodadvances.2020001934 (2020). * Lin, L. et al. Ex-vivo drug testing
predicts chemosensitivity in acute myeloid leukemia. _J. Leukoc. Biol._ 107, 859–870 (2020). Article CAS PubMed Google Scholar * Liebers, N. et al. Ex vivo drug response profiling for
response and outcome prediction in hematologic malignancies: the prospective non-interventional SMARTrial. _Nat. Cancer._ https://doi.org/10.1038/s43018-023-00645-5 (2023). * Malani, D. et
al. Implementing a functional precision medicine tumor board for acute myeloid leukemia. _Cancer Discov._ 12, 388–401 (2022). Article CAS PubMed Google Scholar * Kornauth, C. et al.
Functional precision medicine provides clinical benefit in advanced aggressive hematologic cancers and identifies exceptional responders. _Cancer Discov._ 12, 372–387 (2022). Article PubMed
Google Scholar * Schmid, J. A. et al. Efficacy and feasibility of pharmacoscopy-guided treatment for acute myeloid leukemia patients who have exhausted all registered therapeutic options.
_Haematologica._ https://doi.org/10.3324/haematol.2023.283224 (2023). * Heinemann, T. et al. Deep morphology learning enhances ex vivo drug profiling-based precision medicine. _Blood Cancer
Discov._ 3, 502–515 (2022). Article PubMed PubMed Central Google Scholar * Zeng, A. G. X. et al. A cellular hierarchy framework for understanding heterogeneity and predicting drug
response in acute myeloid leukemia. _Nat. Med._ 28, 1212–1223 (2022). Article CAS PubMed Google Scholar * Jayavelu, A. K. et al. The proteogenomic subtypes of acute myeloid leukemia.
_Cancer Cell._ 1–17 https://doi.org/10.1016/j.ccell.2022.02.006 (2022). * Irmisch, A. et al. The Tumor Profiler Study: integrated, multi-omic, functional tumor profiling for clinical
decision support. _Cancer Cell_ 39, 288–293 (2021). Article CAS PubMed Google Scholar * Gut, G., Herrmann, M. D. & Pelkmans, L. Multiplexed protein maps link subcellular organization
to cellular states. _Science_ 361, eaar7042 (2018). * Kropivsek, K. et al. Ex vivo drug response heterogeneity reveals personalized therapeutic strategies for patients with multiple
myeloma. _Nat. Cancer_ 4, 734–753 (2023). Article CAS PubMed PubMed Central Google Scholar * Wildschut, M. H. E. et al. Proteogenetic drug response profiling elucidates targetable
vulnerabilities of myelofibrosis. _Nat. Commun._ 14, 6414 (2023). Article ADS CAS PubMed PubMed Central Google Scholar * Cancer Genome Atlas Research Network. et al. Genomic and
epigenomic landscapes of adult de novo acute myeloid leukemia. _N. Engl. J. Med_. 368, 2059–2074 (2013). Article Google Scholar * Tyner, J. W. et al. Functional genomic landscape of acute
myeloid leukaemia. _Nature_ 19, 28 (2018). Google Scholar * Roberts, A. W. & Huang, D. Targeting BCL2 with BH3 mimetics: basic science and clinical application of venetoclax in chronic
lymphocytic leukemia and related b cell malignancies. _Clin. Pharmacol. Ther._ 101, 89–98 (2017). Article CAS PubMed Google Scholar * Konopleva, M. et al. Efficacy and biological
correlates of response in a phase II study of venetoclax monotherapy in patients with acute myelogenous leukemia. _Cancer Discov._ 6, 1106–1117 (2016). Article CAS PubMed PubMed Central
Google Scholar * Sullivan, G. P., Flanagan, L., Rodrigues, D. A. & Ní Chonghaile, T. The path to venetoclax resistance is paved with mutations, metabolism, and more. _Sci. Transl. Med_.
14, eabo6891 (2022). * Ong, F., Kim, K. & Konopleva, M. Y. Venetoclax resistance: mechanistic insights and future strategies. _Cancer Drug Resist._ 5, 380–400 (2022). Article CAS
PubMed PubMed Central Google Scholar * Stelmach, P. & Trumpp, A. Leukemic stem cells and therapy resistance in acute myeloid leukemia. _Haematologica_ 108, 353–366 (2023). Article
CAS PubMed PubMed Central Google Scholar * Dhakal, P. et al. Acute myeloid leukemia resistant to venetoclax-based therapy: What does the future hold? _Blood Rev._ 59, 101036 (2023).
Article CAS PubMed Google Scholar * Salah, H. T., Dinardo, C. D., Konopleva, M. & Khoury, J. D. Potential biomarkers for treatment response to the bcl-2 inhibitor venetoclax: State
of the art and future directions. _Cancers_ 13, 1–12 (2021). Article Google Scholar * DiNardo, C. D. et al. Molecular patterns of response and treatment failure after frontline venetoclax
combinations in older patients with AML. _Blood_ 135, 791–803 (2020). Article CAS PubMed PubMed Central Google Scholar * Zhang, H. et al. Integrated analysis of patient samples
identifies biomarkers for venetoclax efficacy and combination strategies in acute myeloid leukemia. _Nat. Cancer_ 1, 826 (2020). Article CAS PubMed PubMed Central Google Scholar * Chen,
X. et al. Targeting mitochondrial structure sensitizes acute myeloid leukemia to venetoclax treatment. _Cancer Discov._ 9, 890–909 (2019). Article CAS PubMed PubMed Central Google
Scholar * Stevens, B. M. et al. Fatty acid metabolism underlies venetoclax resistance in acute myeloid leukemia stem cells. _Nat. Cancer_ 1, 1176–1187 (2020). Article CAS PubMed PubMed
Central Google Scholar * Foroutan, M. et al. Single sample scoring of molecular phenotypes. _BMC Bioinforma._ 19, 404 (2018). Article CAS Google Scholar * Silverstein, R. L. &
Febbraio, M. CD36, a scavenger receptor involved in immunity, metabolism, angiogenesis, and behavior. _Sci. Signal._ 2, re3 (2009). Article PubMed PubMed Central Google Scholar * Jones,
C. L. et al. Inhibition of amino acid metabolism selectively targets human leukemia stem cells. _Cancer Cell_ 34, 724 (2018). Article CAS PubMed PubMed Central Google Scholar *
Roca-Portoles, A. et al. Venetoclax causes metabolic reprogramming independent of BCL-2 inhibition. _Cell Death Dis._ 11, 1–13 (2020). Article Google Scholar * Zhang, T. et al.
Apolipoprotein C2 - CD36 promotes leukemia growth and presents a targetable axis in acute myeloid leukemia. _Blood Cancer Discov._ 1, 198–213 (2020). Article CAS PubMed PubMed Central
Google Scholar * Zhang, Y. et al. IL-6 promotes chemoresistance via upregulating CD36 mediated fatty acids uptake in acute myeloid leukemia. _Exp. Cell Res._ 415, 113112 (2022). Article
CAS PubMed Google Scholar * Mwaikambo, B. R., Sennlaub, F., Ong, H., Chemtob, S. & Hardy, P. Activation of CD36 inhibits and induces regression of inflammatory corneal
neovascularization. _Investig. Ophthalmol. Vis. Sci._ 47, 4356–4364 (2006). Article Google Scholar * Pascual, G. et al. Targeting metastasis-initiating cells through the fatty acid
receptor CD36. _Nature_ 541, 41–45 (2017). Article ADS CAS PubMed Google Scholar * Cheng, P.-L. et al. Chemoresistance in acute myeloid leukemia: an alternative single-cell RNA
sequencing approach. _Hematol. Oncol_. https://doi.org/10.1002/hon.3129 (2023). * Li, K. et al. Single-cell analysis reveals the chemotherapy-induced cellular reprogramming and novel
therapeutic targets in relapsed/refractory acute myeloid leukemia. _Leukemia_ 37, 308–325 (2023). Article CAS PubMed Google Scholar * Zhai, Y. et al. Longitudinal single-cell
transcriptomics reveals distinct patterns of recurrence in acute myeloid leukemia. _Mol. Cancer_ 21, 166 (2022). Article CAS PubMed PubMed Central Google Scholar * Naldini, M. M. et al.
Longitudinal single-cell profiling of chemotherapy response in acute myeloid leukemia. _Nat. Commun._ 14, 1285 (2023). Article ADS CAS PubMed PubMed Central Google Scholar *
Behbehani, G. K. et al. Mass cytometric functional profiling of acute myeloid leukemia defines cell-cycle and immunophenotypic properties that correlate with known responses to therapy.
_Cancer Discov._ 5, 988–1003 (2015). Article CAS PubMed PubMed Central Google Scholar * Levine, J. H. et al. Data-driven phenotypic dissection of AML reveals progenitor-like cells that
correlate with prognosis. _Cell_ 162, 184–197 (2015). Article CAS PubMed Google Scholar * Tislevoll, B. S. et al. Early response evaluation by single cell signaling profiling in acute
myeloid leukemia. _Nat. Commun._ 14, 1–17 (2023). Google Scholar * DiNardo, C. D. et al. Venetoclax combined with FLAG-IDA induction and consolidation in newly diagnosed and relapsed or
refractory acute myeloid leukemia. _J. Clin. Oncol._ 39, 2768–2778 (2021). Article CAS PubMed PubMed Central Google Scholar * Brancati, S. et al. Venetoclax in relapsed/refractory acute
myeloid leukemia: are supporting evidences enough? _Cancers_ 14, 22 2021). * Jamy, O. et al. Hypomethylating agent/venetoclax versus intensive chemotherapy in adults with relapsed or
refractory acute myeloid leukaemia. _Br. J. Haematol._ 198, e35–e37 (2022). Article CAS PubMed Google Scholar * Graveno, M. E. et al. Venetoclax in combination with hypomethylating
agents or low dose cytarabine for relapsed and refractory acute myeloid leukemia. _Leuk. Lymphoma_ 63, 1645–1650 (2022). Article CAS PubMed Google Scholar * Lagadinou, E. D. et al. BCL-2
inhibition targets oxidative phosphorylation and selectively eradicates quiescent human leukemia stem cells. _Cell Stem Cell_ 12, 329–341 (2013). Article CAS PubMed PubMed Central
Google Scholar * Pollyea, D. A. et al. Venetoclax with azacitidine disrupts energy metabolism and targets leukemia stem cells in patients with acute myeloid leukemia. _Nat. Med._ 24,
1859–1866 (2018). Article CAS PubMed PubMed Central Google Scholar * Guièze, R. et al. Mitochondrial reprogramming underlies resistance to BCL-2 inhibition in lymphoid malignancies.
_Cancer Cell_ 36, 369–384.e13 (2019). Article PubMed PubMed Central Google Scholar * Guerrero-Rodríguez, S. L., Mata-Cruz, C., Pérez-Tapia, S. M. & Velasco-Velázquez, M. A. Role of
CD36 in cancer progression, stemness, and targeting. _Front. Cell Dev. Biol._ 10, 2362 (2022). Article Google Scholar * Dolgin, E. A drug to block fat intake and combat cancer spread.
_Nature Publishing Group UK_ https://doi.org/10.1038/d41586-021-01667-8 (2021). * Farge, T. _et al_. CD36 drives metastasis and relapse in acute myeloid leukemia. _Cancer Res_.
https://doi.org/10.1158/0008-5472.CAN-22-3682 (2023). * Chen, Y., Zhang, J., Cui, W. & Silverstein, R. L. CD36, a signaling receptor and fatty acid transporter that regulates immune cell
metabolism and fate. _J. Exp. Med_. 219, eabo6891 (2022). * Elias, E. E. et al. Venetoclax-resistant CLL cells show a highly activated and proliferative phenotype. _Cancer Immunol.
Immunother._ 71, 979–987 (2022). Article CAS PubMed Google Scholar * Döhner, H. et al. Randomized, phase 2 trial of low-dose cytarabine with or without volasertib in AML patients not
suitable for induction therapy. _Blood_ 124, 1426–1433 (2014). Article PubMed PubMed Central Google Scholar * Platzbecker, U. et al. Volasertib as a monotherapy or in combination with
azacitidine in patients with myelodysplastic syndrome, chronic myelomonocytic leukemia, or acute myeloid leukemia: summary of three phase I studies. _BMC Cancer_ 22, 569 (2022). Article
PubMed PubMed Central Google Scholar * Döhner, H. et al. Adjunctive volasertib in patients with acute myeloid leukemia not eligible for standard induction therapy: a randomized, phase 3
trial. _Hemasphere_ 5, e617 (2021). Article PubMed PubMed Central Google Scholar * Severin, Y. et al. Multiplexed high-throughput immune cell imaging reveals molecular health-associated
phenotypes. _Sci. Adv._ 8, eabn5631 (2022). Article CAS PubMed PubMed Central Google Scholar * Carpenter, A. E. et al. CellProfiler: Image analysis software for identifying and
quantifying cell phenotypes. _Genome Biol_. 7, R100 (2006). * Vladimer, G. I. et al. Global survey of the immunomodulatory potential of common drugs. _Nat. Chem. Biol._ 13, 681–690 (2017).
Article CAS PubMed PubMed Central Google Scholar * Bertolini, A. et al. scAmpi-A versatile pipeline for single-cell RNA-seq analysis from basics to clinics. _PLoS Comput. Biol._ 18,
e1010097 (2022). Article CAS PubMed PubMed Central Google Scholar * Prummer, M. et al. scROSHI: robust supervised hierarchical identification of single cells. _NAR Genom. Bioinform._ 5,
lqad058 (2023). Article PubMed PubMed Central Google Scholar * Stuart, T. et al. Comprehensive integration of single-cell data. _Cell_ 177, 1888–1902.e21 (2019). Article CAS PubMed
PubMed Central Google Scholar * Hao, Y. et al. Integrated analysis of multimodal single-cell data. _Cell_ 184, 3573–3587.e29 (2021). Article CAS PubMed Google Scholar * Newman, A. M.
et al. Robust enumeration of cell subsets from tissue expression profiles. _Nat. Methods_ 12, 453–457 (2015). Article CAS PubMed PubMed Central Google Scholar * Lun, A. T. L., Bach, K.
& Marioni, J. C. Pooling across cells to normalize single-cell RNA sequencing data with many zero counts. _Genome Biol._ 17, 75 (2016). Article PubMed Google Scholar * Haghverdi, L.,
Lun, A. T. L., Morgan, M. D. & Marioni, J. C. Batch effects in single-cell RNA-sequencing data are corrected by matching mutual nearest neighbors. _Nat. Biotechnol_.
https://doi.org/10.1038/nbt.4091 (2018). * Poličar, P. G., Stražar, M. & Zupan, B. openTSNE: a modular Python library for t-SNE dimensionality reduction and embedding. _J. Stat. Softw._
109, 1–30 (2019). * Linderman, G. C., Rachh, M., Hoskins, J. G., Steinerberger, S. & Kluger, Y. Fast interpolation-based t-SNE for improved visualization of single-cell RNA-seq data.
_Nat. Methods_ 16, 243–245 (2019). Article CAS PubMed PubMed Central Google Scholar * Kuipers, J., Tuncel, M. A., Ferreira, P., Jahn, K. & Beerenwinkel, N. Single-cell copy number
calling and event history reconstruction. _bioRxiv_ 2020.04.28.065755 https://doi.org/10.1101/2020.04.28.065755 (2020). * Dobin, A. et al. STAR: ultrafast universal RNA-seq aligner.
_Bioinformatics_ 29, 15–21 (2013). Article CAS PubMed Google Scholar * Casanova, R. et al. Standardization of suspension and imaging mass cytometry readouts for clinical decision making.
_bioRxiv_ 2023.03.19.531228 https://doi.org/10.1101/2023.03.19.531228 (2023). * Crowell, H. L. et al. An R-based reproducible and user-friendly preprocessing pipeline for CyTOF data.
_F1000Res_ 9, 1263 (2020). Article PubMed Google Scholar * Xuan, Y. et al. Standardization and harmonization of distributed multi-center proteotype analysis supporting precision medicine
studies. _Nat. Commun._ 11, 5248 (2020). Article ADS CAS PubMed PubMed Central Google Scholar * Forny, P. et al. Integrated multi-omics reveals anaplerotic rewiring in
methylmalonyl-CoA mutase deficiency. _Nat. Metab._ 5, 80–95 (2023). Article CAS PubMed PubMed Central Google Scholar * Čuklina, J. et al. Diagnostics and correction of batch effects in
large-scale proteomic studies: a tutorial. _Mol. Syst. Biol._ 17, e10240 (2021). Article PubMed PubMed Central Google Scholar * Kramer, B. A., Del Castillo, J. S., Pelkmans, L. &
Gut, G. Iterative Indirect Immunofluorescence Imaging (4i) on Adherent Cells and Tissue Sections. _Bio Protoc._ 13, e4712 (2023). Article CAS PubMed PubMed Central Google Scholar *
Battich, N., Stoeger, T. & Pelkmans, L. Image-based transcriptomics in thousands of single human cells at single-molecule resolution. _Nat. Methods_ 10, 1127–1133 (2013). Article CAS
PubMed Google Scholar * Wu, T. et al. clusterProfiler 4.0: A universal enrichment tool for interpreting omics data. _Innovation_ 2, 100141 (2021). * Guangchuang Yu, Li-Gen Wang, Yanyan
Han, and Qing-Yu He. clusterProfiler: an R package for comparing biological themes among gene clusters. _OMICS: A Journal of Integrative Biology_ (2012). * Szklarczyk, D. et al. The STRING
database in 2021: customizable protein-protein networks, and functional characterization of user-uploaded gene/measurement sets. _Nucleic Acids Res._ 49, D605–D612 (2021). Article CAS
PubMed Google Scholar * Love, M. I., Anders, S. & Huber, W. _Differential Analysis of Count Data - the DESeq2 Package_. vol. 15 550 (2014). Download references ACKNOWLEDGEMENTS The
Tumor Profiler Study is jointly funded by a public-private partnership involving F. Hoffmann-La Roche Ltd., ETH Zurich (Strategic focus area Personalized Health and Related Technologies,
PHRT), University of Zurich, University Hospital Zurich, and University Hospital Basel. Moreover, we acknowledge the support of the Clinical Trials Center (CTC) Zurich and the Clinical
Trials Unit (CTU) Basel. NGS was carried out at the Genomics Facility Basel of the University of Basel and the Department of Biosystems Science and Engineering, ETH Zurich. We gratefully
acknowledge the excellent project management support by the following individuals: Andreas Strauss, Thomas Solbach, Lina Reypens, Vanessa Mareike Johnen, and Roland Steinacher. The results
presented in this study are in part based upon data generated by the TCGA Research Network (https://www.cancer.gov/tcga) and the BEAT-AML trial (http://www.vizome.org/aml2/). Some Figure
parts were created with BioRender (Fig. 1a: BioRender.com/f53q390, Fig. 2a: BioRender.com/o06x626, Fig. 5d: BioRender.com/e30e859, Supplementary Figs. 1–6: BioRender.com/c06t989). AUTHOR
INFORMATION Author notes * Nora C. Toussaint Present address: Swiss Data Science Center, ETH Zürich, Zurich, Switzerland * These authors contributed equally: Rebekka Wegmann, Ximena Bonilla,
Ruben Casanova, Stéphane Chevrier, Ricardo Coelho, Cinzia Esposito, Joanna Ficek-Pascual, Sandra Goetze, Gabriele Gut, Francis Jacob, Andrea Jacobs, Jack Kuipers, Ulrike Lischetti, Julien
Mena, Emanuela S. Milani, Michael Prummer, Jacobo Sarabia Del Castillo, Franziska Singer, Sujana Sivapatham, Nora C. Toussaint, Oliver Vilinovszki, Mattheus H. E. Wildschut. * These authors
jointly supervised this work: Rudolf Aebersold, Marina Bacac, Niko Beerenwinkel, Christian Beisel, Bernd Bodenmiller, Viola Heinzelmann-Schwarz, Viktor H. Koelzer, Mitchell P. Levesque,
Holger Moch, Lucas Pelkmans, Gunnar Rätsch, Markus Tolnay, Andreas Wicki, Bernd Wollscheid, Markus G. Manz, Berend Snijder, Alexandre P. A. Theocharides. AUTHORS AND AFFILIATIONS * Institute
of Molecular Systems Biology, Department of Biology, ETH Zurich, Zurich, Switzerland Rebekka Wegmann, Julien Mena, Mattheus H. E. Wildschut, Rudolf Aebersold & Berend Snijder *
Department of Computer Science, ETH Zurich, Zurich, Switzerland Ximena Bonilla, Joanna Ficek-Pascual & Gunnar Rätsch * Department of Quantitative Biomedicine, University of Zurich,
Zurich, Switzerland Ruben Casanova, Stéphane Chevrier, Andrea Jacobs, Sujana Sivapatham, Bernd Bodenmiller, Stefanie Engler & Bernd Bodenmiller * Department of Biomedicine, University
Hospital Basel and University of Basel, Basel, Switzerland Ricardo Coelho, Francis Jacob, Ulrike Lischetti, André Fedier, Viola Heinzelmann-Schwarz, Flavio C. Lombardo, Monica Nunez Lopez,
Salvatore Piscuoglio, Natalie Rimmer, Mathilde Ritter & Viola Heinzelmann-Schwarz * Institute of Molecular Life Sciences, University of Zurich, Zurich, Switzerland Cinzia Esposito,
Gabriele Gut, Jacobo Sarabia Del Castillo & Lucas Pelkmans * Department of Health Sciences and Technology, ETH Zurich, Zurich, Switzerland Sandra Goetze, Emanuela S. Milani, Mattheus H.
E. Wildschut, Silvana I. Albert, Jonas Albinus, Sandra Goetze, Martin Mehnert, Wenguang Shao, Audrey Van Drogen, Fabian Wendt, Bernd Bodenmiller & Bernd Wollscheid * ETH PHRT Swiss
Multi-Omics Center (SMOC), Lausanne, Switzerland Sandra Goetze & Katharina Jahn * SIB Swiss Institute of Bioinformatics, Lausanne, Switzerland Sandra Goetze, Michael Prummer, Franziska
Singer, Nora C. Toussaint, Faisal S. Al-Quaddoomi, Sonali Andani, Niko Beerenwinkel, Anne Bertolini, Lars Bosshard, Natalia Chicherova, Joanna Ficek-Pascual, Linda Grob, Alva R. James, André
Kahles, Abdullah Kahraman, Jack Kuipers, Michael Prummer, Laurie Prélot, María L. Rosano-González, Gunnar Rätsch, Franziska Singer, Berend Snijder, Vipin T. Sreedharan, Stefan Stark, Daniel
J. Stekhoven, Tinu M. Thomas, Mustafa A. Tuncel, Shuqing Yu, Niko Beerenwinkel, Gunnar Rätsch & Berend Snijder * Department of Biosystems Science and Engineering, ETH Zurich, Zurich,
Switzerland Jack Kuipers, Niko Beerenwinkel & Christian Beisel * NEXUS Personalized Health Technologies, ETH Zurich, Zurich, Switzerland Michael Prummer, Franziska Singer & Nora C.
Toussaint * Department of Medical Oncology and Hematology, University Hospital Zurich, Zurich, Switzerland Oliver Vilinovszki, Mattheus H. E. Wildschut, Tharshika Thavayogarajah, Nicola
Miglino, Mattheus H. E. Wildschut, Andreas Wicki, Markus G. Manz & Alexandre P. A. Theocharides * Harvard Medical School and Dana-Farber Cancer Institute, Boston, USA Disha Malani *
Roche Pharmaceutical Research and Early Development, Roche Innovation Center Zurich, Zurich, Switzerland Marina Bacac * Department of Pathology and Molecular Pathology, University Hospital
Zurich, Zurich, Switzerland Sonali Andani, Anja L. Frei, Abdullah Kahraman, Viktor H. Koelzer, Holger Moch, Marta Nowak, Bettina Sobottka, Norbert Wey, Martin Zoche, Viktor H. Koelzer &
Holger Moch * University of Zurich, Faculty of Medicine, Zurich, Switzerland Viktor H. Koelzer, Nicola Miglino, Viktor H. Koelzer, Holger Moch & Andreas Wicki * Department of
Dermatology, University Hospital Zurich, Zurich, Switzerland Melike Ak, Reinhard Dummer, Anja Irmisch, Mitchell Levesque, Marina Tusup, Johanna Ziegler & Mitchell P. Levesque * AI Center
at ETH Zurich, Zurich, Switzerland Joanna Ficek-Pascual, Gunnar Rätsch & Gunnar Rätsch * Institute of Medical Genetics and Pathology, University Hospital Basel, Basel, Switzerland
Markus Tolnay * Department of Biology, ETH Zurich, Institute of Molecular Systems Biology, Zurich, Switzerland Rudolf Aebersold, Julien Mena, Berend Snijder, Rebekka Wegmann & Mattheus
H. E. Wildschut * NEXUS Personalized Health Technologies, ETH Zurich, Zurich, Switzerland Faisal S. Al-Quaddoomi, Anne Bertolini, Lars Bosshard, Natalia Chicherova, Linda Grob, Michael
Prummer, María L. Rosano-González, Franziska Singer, Vipin T. Sreedharan, Daniel J. Stekhoven & Shuqing Yu * University Hospital Basel, Institute of Medical Genetics and Pathology,
Basel, Switzerland Ilaria Alborelli, Daniel Baumhoer, Byron Calgua, Philip M. Jermann, Viktor H. Koelzer, Simone Muenst, Charlotte K. Y. Ng, Stefan Nicolet, Salvatore Piscuoglio, Markus
Tolnay & Tatjana Vlajnic * Department of Computer Science, ETH Zurich, Institute of Machine Learning, Zurich, Switzerland Sonali Andani, Ximena Bonilla, Natalie R. Davidson, Joanna
Ficek-Pascual, Alexander Immer, Alva R. James, André Kahles, Kjong-Van Lehmann, Philipp Markolin, Laurie Prélot, Gunnar Rätsch, Stefan Stark, Tanmay Tanna, Tinu M. Thomas & Marc
Zimmermann * University Hospital Zurich, Biomedical Informatics, Zurich, Switzerland Sonali Andani, Joanna Ficek-Pascual, Alva R. James, André Kahles, Laurie Prélot, Gunnar Rätsch, Stefan
Stark & Tinu M. Thomas * F. Hoffmann-La Roche Ltd, Basel, Switzerland Per-Olof Attinger, Maya D’Costa, Tim M. Jaeger, Sebastian Lugert & Severin Schwan * Roche Pharmaceutical
Research and Early Development, Roche Innovation Center Zurich, Schlieren, Switzerland Marina Bacac, Sylvia Herter, Tamara Huesser & Vinko Tosevski * University of Zurich, VP Medicine,
Zurich, Switzerland Beatrice Beck-Schimmer * Department of Biosystems Science and Engineering, ETH Zurich, Basel, Switzerland Niko Beerenwinkel, Christian Beisel, Monica-Andreea Drăgan,
Katja Eschbach, Pedro F. Ferreira, Jack Kuipers, Natascha Santacroce, Tobias Schär, Tanmay Tanna & Mustafa A. Tuncel * University Hospital Zurich, Clinical Trials Center, Zurich,
Switzerland Lara Bernasconi, Gabriela Senti & Sandra Weber * ETH Zurich, Institute of Molecular Health Sciences, Zurich, Switzerland Bernd Bodenmiller * University of Zurich, Institute
of Molecular Life Sciences, Zurich, Switzerland Esther Danenberg, Cinzia Esposito, Gabriele Gut, Rene Holtackers, Lucas Pelkmans & Jacobo Sarabia del Castillo * Roche Pharmaceutical
Research and Early Development, Roche Innovation Center Basel, Basel, Switzerland Martin Erkens, Christian Rommel & Petra C. Schwalie * Life Science Zurich Graduate School, Biomedicine
PhD Program, Zurich, Switzerland Joanna Ficek-Pascual * Roche Diagnostics GmbH, Penzberg, Germany Bruno Frey & Gerd Maass * Department of Chemistry and Applied Biosciences, ETH Zurich,
Zurich, Switzerland Detlef Günther * Cantonal Hospital Baselland, Medical University Clinic, Liestal, Switzerland Pirmin Haeuptle * University Hospital Basel, Gynecological Cancer Center,
Basel, Switzerland Viola Heinzelmann-Schwarz * Max Planck ETH Center for Learning Systems, Tübingen, Germany Alexander Immer * FHNW, School of Life Sciences, Institute of Chemistry and
Bioanalytics, Muttenz, Switzerland Abdullah Kahraman * University Hospital Basel, Basel, Switzerland Werner Kuebler * Department of Information- and Communication Technology, University
Hospital Basel, Basel, Switzerland Christian P. Kunze * University Hospital Basel, Brustzentrum, Basel, Switzerland Christian Kurzeder * Cancer Research Center Cologne-Essen, University
Hospital Cologne, Cologne, Germany Kjong-Van Lehmann * Center for Integrated Oncology Aachen (CIO-A), Aachen, Germany Kjong-Van Lehmann * Joint Research Center Computational Biomedicine,
University Hospital RWTH Aachen, Aachen, Germany Kjong-Van Lehmann * Department of Gynecology, University Hospital Zurich, Zurich, Switzerland Julian M. Metzler * University of Zurich,
Services and Support for Science IT, Zurich, Switzerland Riccardo Murri * Department of BioMedical Research, University of Bern, Bern, Switzerland Charlotte K. Y. Ng * Department of Biology,
ETH Zurich, Zurich, Switzerland Patrick G. A. Pedrioli & Gunnar Rätsch * Roche Pharmaceutical Research and Early Development, Roche Innovation Center Munich, Roche Diagnostics GmbH,
Penzberg, Germany Ramona Schlenker * ETH Zurich, Swiss Data Science Center, Zurich, Switzerland Nora C. Toussaint * University Hospital Basel, Brustzentrum & Tumorzentrum, Basel,
Switzerland Marcus Vetter * University Hospital Basel and University of Basel, Department of Surgery, Brustzentrum, Basel, Switzerland Walter P. Weber * Department of Neurology, University
Hospital and University of Zurich, Zurich, Switzerland Michael Weller * University Hospital Zurich, Zurich, Switzerland Gregor Zuend Authors * Rebekka Wegmann View author publications You
can also search for this author inPubMed Google Scholar * Ximena Bonilla View author publications You can also search for this author inPubMed Google Scholar * Ruben Casanova View author
publications You can also search for this author inPubMed Google Scholar * Stéphane Chevrier View author publications You can also search for this author inPubMed Google Scholar * Ricardo
Coelho View author publications You can also search for this author inPubMed Google Scholar * Cinzia Esposito View author publications You can also search for this author inPubMed Google
Scholar * Joanna Ficek-Pascual View author publications You can also search for this author inPubMed Google Scholar * Sandra Goetze View author publications You can also search for this
author inPubMed Google Scholar * Gabriele Gut View author publications You can also search for this author inPubMed Google Scholar * Francis Jacob View author publications You can also
search for this author inPubMed Google Scholar * Andrea Jacobs View author publications You can also search for this author inPubMed Google Scholar * Jack Kuipers View author publications
You can also search for this author inPubMed Google Scholar * Ulrike Lischetti View author publications You can also search for this author inPubMed Google Scholar * Julien Mena View author
publications You can also search for this author inPubMed Google Scholar * Emanuela S. Milani View author publications You can also search for this author inPubMed Google Scholar * Michael
Prummer View author publications You can also search for this author inPubMed Google Scholar * Jacobo Sarabia Del Castillo View author publications You can also search for this author
inPubMed Google Scholar * Franziska Singer View author publications You can also search for this author inPubMed Google Scholar * Sujana Sivapatham View author publications You can also
search for this author inPubMed Google Scholar * Nora C. Toussaint View author publications You can also search for this author inPubMed Google Scholar * Oliver Vilinovszki View author
publications You can also search for this author inPubMed Google Scholar * Mattheus H. E. Wildschut View author publications You can also search for this author inPubMed Google Scholar *
Tharshika Thavayogarajah View author publications You can also search for this author inPubMed Google Scholar * Disha Malani View author publications You can also search for this author
inPubMed Google Scholar * Rudolf Aebersold View author publications You can also search for this author inPubMed Google Scholar * Marina Bacac View author publications You can also search
for this author inPubMed Google Scholar * Niko Beerenwinkel View author publications You can also search for this author inPubMed Google Scholar * Christian Beisel View author publications
You can also search for this author inPubMed Google Scholar * Bernd Bodenmiller View author publications You can also search for this author inPubMed Google Scholar * Viola
Heinzelmann-Schwarz View author publications You can also search for this author inPubMed Google Scholar * Viktor H. Koelzer View author publications You can also search for this author
inPubMed Google Scholar * Mitchell P. Levesque View author publications You can also search for this author inPubMed Google Scholar * Holger Moch View author publications You can also search
for this author inPubMed Google Scholar * Lucas Pelkmans View author publications You can also search for this author inPubMed Google Scholar * Gunnar Rätsch View author publications You
can also search for this author inPubMed Google Scholar * Markus Tolnay View author publications You can also search for this author inPubMed Google Scholar * Andreas Wicki View author
publications You can also search for this author inPubMed Google Scholar * Bernd Wollscheid View author publications You can also search for this author inPubMed Google Scholar * Markus G.
Manz View author publications You can also search for this author inPubMed Google Scholar * Berend Snijder View author publications You can also search for this author inPubMed Google
Scholar * Alexandre P. A. Theocharides View author publications You can also search for this author inPubMed Google Scholar CONSORTIA THE TUMORPROFILER CONSORTIUM * Rudolf Aebersold * ,
Melike Ak * , Faisal S. Al-Quaddoomi * , Silvana I. Albert * , Jonas Albinus * , Ilaria Alborelli * , Sonali Andani * , Per-Olof Attinger * , Marina Bacac * , Daniel Baumhoer * , Beatrice
Beck-Schimmer * , Niko Beerenwinkel * , Christian Beisel * , Lara Bernasconi * , Anne Bertolini * , Bernd Bodenmiller * , Ximena Bonilla * , Lars Bosshard * , Byron Calgua * , Ruben Casanova
* , Stéphane Chevrier * , Natalia Chicherova * , Ricardo Coelho * , Maya D’Costa * , Esther Danenberg * , Natalie R. Davidson * , Monica-Andreea Drăgan * , Reinhard Dummer * , Stefanie
Engler * , Martin Erkens * , Katja Eschbach * , Cinzia Esposito * , André Fedier * , Pedro F. Ferreira * , Joanna Ficek-Pascual * , Anja L. Frei * , Bruno Frey * , Sandra Goetze * , Linda
Grob * , Gabriele Gut * , Detlef Günther * , Pirmin Haeuptle * , Viola Heinzelmann-Schwarz * , Sylvia Herter * , Rene Holtackers * , Tamara Huesser * , Alexander Immer * , Anja Irmisch * ,
Francis Jacob * , Andrea Jacobs * , Tim M. Jaeger * , Katharina Jahn * , Alva R. James * , Philip M. Jermann * , André Kahles * , Abdullah Kahraman * , Viktor H. Koelzer * , Werner Kuebler *
, Jack Kuipers * , Christian P. Kunze * , Christian Kurzeder * , Kjong-Van Lehmann * , Mitchell Levesque * , Ulrike Lischetti * , Flavio C. Lombardo * , Sebastian Lugert * , Gerd Maass * ,
Markus G. Manz * , Philipp Markolin * , Martin Mehnert * , Julien Mena * , Julian M. Metzler * , Nicola Miglino * , Emanuela S. Milani * , Holger Moch * , Simone Muenst * , Riccardo Murri *
, Charlotte K. Y. Ng * , Stefan Nicolet * , Marta Nowak * , Monica Nunez Lopez * , Patrick G. A. Pedrioli * , Lucas Pelkmans * , Salvatore Piscuoglio * , Michael Prummer * , Laurie Prélot *
, Natalie Rimmer * , Mathilde Ritter * , Christian Rommel * , María L. Rosano-González * , Gunnar Rätsch * , Natascha Santacroce * , Jacobo Sarabia del Castillo * , Ramona Schlenker * ,
Petra C. Schwalie * , Severin Schwan * , Tobias Schär * , Gabriela Senti * , Wenguang Shao * , Franziska Singer * , Sujana Sivapatham * , Berend Snijder * , Bettina Sobottka * , Vipin T.
Sreedharan * , Stefan Stark * , Daniel J. Stekhoven * , Tanmay Tanna * , Alexandre P. A. Theocharides * , Tinu M. Thomas * , Markus Tolnay * , Vinko Tosevski * , Nora C. Toussaint * ,
Mustafa A. Tuncel * , Marina Tusup * , Audrey Van Drogen * , Marcus Vetter * , Tatjana Vlajnic * , Sandra Weber * , Walter P. Weber * , Rebekka Wegmann * , Michael Weller * , Fabian Wendt *
, Norbert Wey * , Andreas Wicki * , Mattheus H. E. Wildschut * , Bernd Wollscheid * , Shuqing Yu * , Johanna Ziegler * , Marc Zimmermann * , Martin Zoche * & Gregor Zuend CONTRIBUTIONS
Conceptualization: T.P.C.; Formal analysis: R.W., X.B., S.C., J.F.P., F.S., N.C.T., J.M., E.S.M., R.Ca., S.G., J.K., C.E., J.S., M.P., U.L., G.G.; Investigation: R.W., X.B., S.C., J.M.,
E.S.M., R.Ca., F.J., R.Co., S.G., C.E., J.S., A.J., S.S., O.V., M.W., T.T., D.M.; Resources: T.P.C.; Writing—Original Draft: R.W., B.S., A.P.T.; Writing—Review and Editing: R.W., X.B., S.C.,
J.F.P., F.S., N.C.T., J.M., E.S.M., R.Ca., S.G., J.K., C.E., J.S., M.P., U.L., G.G., O.V., M.W., T.T., R.A., M.B., N.B., C.B., B.B., V.H.S., V.H.K., H.M., M.P.L., L.P., G.R., M.T., A.W.,
B.W., M.G.M., B.S., A.P.T.; Visualization: R.W.; Supervision: R.A., M.B., N.B., C.B., B.B., V.H.S., V.H.K., H.M., M.P.L., L.P., G.R., M.T., A.W., B.W., M.G.M., B.S., A.P.T.; Funding
Acquisition: T.P.C. CORRESPONDING AUTHORS Correspondence to Markus G. Manz, Berend Snijder or Alexandre P. A. Theocharides. ETHICS DECLARATIONS COMPETING INTERESTS B.B. has founded and is a
shareholder and member of the board of Navignostics, a precision oncology spin-off from the University of Zurich. B.B. reports personal consultancy fees as Advisory board member from
Standard BioTools. B.S. was a scientific co-founder of Allcyte, which has been acquired by Exscientia. B.S. is a shareholder of Exscientia and a co-inventor on US patent application
15/514,045 relevant to the study. L.P. and G.G. are listed as inventors on patents related to the 4i technology (WO 2019/207004; WO 2020/008071). G.R. is listed on a patent application
related to single-cell analyses (European Patent Application No. 20170724.7), and G.R. is cofounder and on the Scientific Advisory Board of Computomics GmbH. H.M. is on advisory boards for
Bayer, Astra Zeneca, Janssen, Roche, and Merck. M.P.L. is scientific advisor and board member of Oncobit and has received unrelated research funding from Roche, Novartis, Scailyte, Molecular
Partners, and Bacoba. V.H.K. is an invited speaker for Sharing Progress in Cancer Care (SPCC) and Indica Labs; advisory board of Takeda; sponsored research agreements with Roche and IAG all
unrelated to the current study; listed as innovator on patent applications in computational pathology. The Tumor Profiler study is jointly funded by a public-private partnership involving
F. Hoffmann-La Roche Ltd., ETH Zurich, University of Zurich, University Hospital Zurich, and University Hospital Basel. The remaining authors declare no competing interests. PEER REVIEW PEER
REVIEW INFORMATION _Nature Communications_ thanks Yoonkyu Lee, Zohar Sachs, and the other, anonymous, reviewer(s) for their contribution to the peer review of this work. A peer review file
is available. ADDITIONAL INFORMATION PUBLISHER’S NOTE Springer Nature remains neutral with regard to jurisdictional claims in published maps and institutional affiliations. SUPPLEMENTARY
INFORMATION SUPPLEMENTARY INFORMATION PEER REVIEW FILE DESCRIPTION OF ADDITIONAL SUPPLEMENTARY INFORMATION SUPPLEMENTARY DATA 1 SUPPLEMENTARY DATA 2 SUPPLEMENTARY DATA 3 SUPPLEMENTARY DATA 4
SUPPLEMENTARY DATA 5 SUPPLEMENTARY DATA 6 SUPPLEMENTARY DATA 7 SUPPLEMENTARY DATA 8 SUPPLEMENTARY DATA 9 SUPPLEMENTARY DATA 10 SUPPLEMENTARY DATA 11 SUPPLEMENTARY DATA 12 SUPPLEMENTARY DATA
13 SUPPLEMENTARY DATA 14 REPORTING SUMMARY SOURCE DATA SOURCE DATA RIGHTS AND PERMISSIONS OPEN ACCESS This article is licensed under a Creative Commons
Attribution-NonCommercial-NoDerivatives 4.0 International License, which permits any non-commercial use, sharing, distribution and reproduction in any medium or format, as long as you give
appropriate credit to the original author(s) and the source, provide a link to the Creative Commons licence, and indicate if you modified the licensed material. You do not have permission
under this licence to share adapted material derived from this article or parts of it. The images or other third party material in this article are included in the article’s Creative Commons
licence, unless indicated otherwise in a credit line to the material. If material is not included in the article’s Creative Commons licence and your intended use is not permitted by
statutory regulation or exceeds the permitted use, you will need to obtain permission directly from the copyright holder. To view a copy of this licence, visit
http://creativecommons.org/licenses/by-nc-nd/4.0/. Reprints and permissions ABOUT THIS ARTICLE CITE THIS ARTICLE Wegmann, R., Bonilla, X., Casanova, R. _et al._ Single-cell landscape of
innate and acquired drug resistance in acute myeloid leukemia. _Nat Commun_ 15, 9402 (2024). https://doi.org/10.1038/s41467-024-53535-4 Download citation * Received: 08 March 2024 *
Accepted: 10 October 2024 * Published: 30 October 2024 * DOI: https://doi.org/10.1038/s41467-024-53535-4 SHARE THIS ARTICLE Anyone you share the following link with will be able to read this
content: Get shareable link Sorry, a shareable link is not currently available for this article. Copy to clipboard Provided by the Springer Nature SharedIt content-sharing initiative