Play all audios:
ABSTRACT Sterile inflammation after myocardial infarction is classically credited to myeloid cells interacting with dead cell debris in the infarct zone1,2. Here we show that cardiomyocytes
are the dominant initiators of a previously undescribed type I interferon response in the infarct borderzone. Using spatial transcriptomics analysis in mice and humans, we find that
myocardial infarction induces colonies of interferon-induced cells (IFNICs) expressing interferon-stimulated genes decorating the borderzone, where cardiomyocytes experience mechanical
stress, nuclear rupture and escape of chromosomal DNA. Cardiomyocyte-selective deletion of _Irf3_ abrogated IFNIC colonies, whereas mice lacking _Irf3_ in fibroblasts, macrophages,
neutrophils or endothelial cells, _Ccr2_-deficient mice or plasmacytoid-dendritic-cell-depleted mice did not. Interferons blunted the protective matricellular programs and contractile
function of borderzone fibroblasts, and increased vulnerability to pathological remodelling. In mice that died after myocardial infarction, IFNIC colonies were immediately adjacent to sites
of ventricular rupture, while mice lacking IFNICs were protected from rupture and exhibited improved survival3. Together, these results reveal a pathological borderzone niche characterized
by a cardiomyocyte-initiated innate immune response. We suggest that selective inhibition of IRF3 activation in non-immune cells could limit ischaemic cardiomyopathy while avoiding broad
immunosuppression. SIMILAR CONTENT BEING VIEWED BY OTHERS SPATIOTEMPORAL DYNAMICS OF MACROPHAGE HETEROGENEITY AND A POTENTIAL FUNCTION OF TREM2HI MACROPHAGES IN INFARCTED HEARTS Article Open
access 06 August 2022 TARGETING IMMUNE–FIBROBLAST CELL COMMUNICATION IN HEART FAILURE Article 23 October 2024 CHROMATIN REMODELLING DRIVES IMMUNE CELL–FIBROBLAST COMMUNICATION IN HEART
FAILURE Article 23 October 2024 MAIN Inflammation is necessary for wound healing, but excessive inflammation can exacerbate tissue injury and dysfunction2. For example, during myocardial
infarction (MI), ischaemic injury in the heart provokes exuberant inflammation followed by infarct expansion, pathologic remodelling and heart failure, making it the most common cause of
death in the world4,5. Professional immune cells (such as myeloid cells) are often credited with initiating proinflammatory innate immune responses in the infarcted heart by sensing damage
associated molecular patterns released by dying cells1,2. By contrast, the roles of non-immune cells are not well defined. Recently, the inflammatory response to MI was shown to involve the
type I interferon (IFN) response and the double-stranded DNA (dsDNA) sensor cyclic GMP-AMP synthase (CGAS)3,6. After sensing dsDNA, CGAS catalyses the production of cyclic di-GMP-AMP
(cGAMP), a gap-junction-permeable second messenger that signals through the adaptor stimulator of interferon genes (STING) and activates interferon regulatory factor 3 (IRF3), which
upregulates expression of secreted type I IFN (IFNα and IFNβ)7,8,9,10,11,12. The diffusible IFN cytokine then signals through the IFNα receptor (IFNAR) on the surface of cells in the local
microenvironment and upregulates expression of hundreds of effector molecules known as IFN-stimulated genes (ISGs)13. As IFNAR-dependent ISG expression can occur in any cell type, we refer
to cells expressing ISGs collectively as IFNICs14. We previously found that globally inhibiting the MI-induced IFN response was protective against pathological remodelling, ventricular
dilation and fatal rupture in mice; however, the reason for such protection and its relevance to humans was unclear3. Our previous studies focused on myeloid cells and revealed that the type
I IFN response pathway can be preactivated within the bone marrow before myeloid cells traffic to the infarcted heart; however, this extracardiac source was insufficient in magnitude to
explain the observed intracardiac IFN response. We therefore hypothesized the existence of an additional and distinct intracardiac IFN response about which little is known15. Here we
describe a post-MI IFN response of greater magnitude and of intracardiac origin. Single-cell transcriptomics has rapidly advanced our understanding of cellular heterogeneity within infarcted
hearts. When the technique was used to study infarcted hearts, we and others detected small subpopulations of IFNICs from many different immune and non-immune cell types15,16,17. It was
unclear how small fractions of many different cell types could become activated by secreted IFNs while the vast majority of each cell type avoided activation3,17. It was also unclear how the
response originated, because most studies focused on ISGs, an easy-to-measure secondary response of IFNICs, but left type I IFNs—the much-harder-to-measure initiator cytokines—unmeasured.
We hypothesized that IFNIC subpopulations were observed in many different cell types because of focal initiation of type I IFN production in space followed by diffusive spread in the local
microenvironment leading to ISG expression in surrounding cells forming a multicellular IFNIC colony. To test this hypothesis, we analysed the infarcted hearts of humans and wild-type (WT),
conditional knockout and reporter mice using genome-wide spatial transcriptomics and single-cell, spatially resolved RNA and DNA multiplexed error robust fluorescence in situ hybridization
(MERFISH). SPATIALLY CLUSTERED IFNICS IN MOUSE MI To investigate the spatial distribution of IFN responses to cardiac injury, we analysed 87,407 spatial transcriptomes (Visium) and 132,171
single-cell MERFISH profiles from 46 mice subjected to coronary ligation with or without reperfusion or needle trauma injury16 (Supplementary Figs. 1 and 2). We also reanalysed 48,550
recently published spatial transcriptomes from 15 human hearts after MI18. Prototypical ISGs were analysed individually or summed to form an ISG score that was thresholded to generate a
binary state (ISG− versus ISG+) based on whether spots exceeded expression levels observed in negative control _Irf3_-deficient mice (_Irf3__−/−_), which are unable to mount a type I IFN
response (Extended Data Fig. 1). We analysed the colocalization of ISGs with cell types and with tissue microenvironments (such as borderzone (BZ) and infarct zone (IZ)) using gene count
scores derived from integrated single-cell (scRNA-seq) and single-nucleus (snRNA-seq) RNA-sequencing data as previously described15,16,17 (Extended Data Fig. 2 and Supplementary Fig. 3a,b).
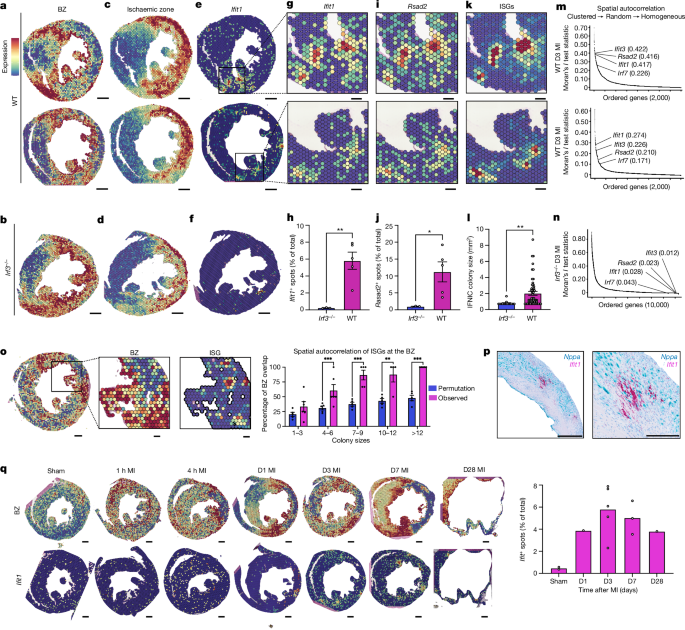
We first examined the BZ of WT and _Irf3__−/−_ mice on day 3 after MI (Fig. 1a,b). As expected, myeloid cell marker genes and proinflammatory cytokines were expressed throughout the IZ (Fig.
1c,d). Notably, ISGs exhibited a different pattern—they were expressed in distinct spatially clustered IFNIC colonies, hundreds of micrometres in diameter, decorating the BZ (Fig. 1e). In
contrast to WT mice, IFNIC colonies were not identified at the BZs of _Irf3__−/−_, _Cgas__−/−_, _Sting__−/−_ or _Ifnar__−/−_ mice, suggesting that they resulted from CGAS-dependent DNA
sensing (Extended Data Fig. 3). We devised methods for colony segmentation so that colony size and expression levels could be quantitatively characterized (Supplementary Fig. 3c,d). Whereas
WT mice typically had 3–8 colonies per mid-ventricle short-axis section with an average size of 350–900 μm2, _Irf3__−/−_ mice had almost no measurable IFNIC colonies (Fig. 1f–l). To quantify
the degree of ISG clustering, we calculated the Moran’s _I_ test statistic—an established measure of spatial autocorrelation based on gene expression location and expression magnitude19. On
the basis of this metric, ISGs were among the highest spatially clustered genes in WT mice but were largely absent and lacked spatial organization in _Irf3__−/−_ mice (Fig. 1m,n). To test
whether IFNIC colonies were spatially localized to the BZ more than would be expected by chance, we performed a Monte Carlo permutation test that simulated recurrent, random placement of ISG
colonies of variable sizes on each sample. Only the smallest IFNIC colonies (1–3 spots) lacked association with the BZ, and colonies were further identified by in situ hybridization using
probes targeting _Nppa_ and _Ifit1_ (Fig. 1o,p). This suggested that the large IFNIC colonies are connected to the BZ and are distinct from the scattered ISG-expressing bone-marrow-derived
myeloid cells that infiltrate the IZ15. To define IFNIC colony dynamics, we quantified them at timepoints from 1 h to 28 days after MI and found that they were present as early as 1 day
after MI and persisted as late as day 28 (Fig. 1q). A summary of MI-induced IFNIC colonies, expressed as the spatial distributions of ISG scores, is shown for diverse post-MI samples and IFN
pathway perturbations in Extended Data Fig. 3. SPATIALLY CLUSTERED IFNICS IN HUMAN MI We wondered whether IFNIC colonies are also induced by MI in humans. We therefore reanalysed spatial
transcriptomic data of published human heart samples after acute MI or controls by summing ISG counts as a score18,20 (Fig. 2a–f). Similar to mice, we observed IFNIC colonies hundreds of
micrometres in size as demonstrated by expression of _MX1_ (Fig. 2g,h), _IFIT1_ (Fig. 2i,j) or the ISG score (Fig. 2k,l). When we ranked highly variable genes, ISGs were among the most
spatially autocorrelated transcripts in several human infarcted hearts (Fig. 2m) but were spatially dispersed in control tissue based on Moran’s _I_ (refs. 16,21) (Fig. 2n). Together, this
demonstrated that MI induces a previously unrecognized, spatially clustered BZ IFN response in mice and humans. CARDIOMYOCYTES INITIATE IFNIC CLUSTERS The discrete, clustered nature of ISG
expression at the BZs of mice and humans suggested that MI may initiate focal IFN responses that are secondarily spread to neighbouring cells to form IFNIC colonies. To determine the
initiating cell type, we used a genetic approach and generated mice with cell-type-selective deletion of the master transcriptional regulator _Irf3_ in cardiomyocytes
(_Irf3__flox/flox__Myh6__cre/+_, hereafter _Irf3__CM_), fibroblasts (_Irf3__flox/flox__Col1a1__creERT2/+_, hereafter _Irf3__FB_), macrophages (_Irf3__flox/flox__Cx3cr1__creERT2/+_, hereafter
_Irf3__Mac_), neutrophils (_Irf3__flox/flox__S100a8__cre/+_, hereafter _Irf3__Neut_) and endothelial cells (_Irf3_flox/flox_Tie2_cre/+, hereafter _Irf3__EC_). We hypothesized that, if there
was a dominant initiator cell type, the corresponding cell-type-selective knockout mice would phenocopy the global _Irf3__−/−__-_knockout mice and lack clustered IFNIC colonies. Infarcted
hearts from each cell-type-selective transgenic line were collected at day 3 after MI for spatial transcriptomics analysis. Samples and biological replicates were then integrated and
normalized to enable direct comparison and quantification of ISG expression between transgenic lines. Notably, only cardiomyocyte-selective deletion of Irf3 (_Irf3__CM_) displayed random or
homogenous distribution of ISGs as indicated by low Moran’s _I_ test statistics (Fig. 3a,b). By contrast, ISGs remained among the most spatially variable genes in the infarcted hearts of
_Irf3__FB_, _Irf3__Mac_, _Irf3__Neut_ and _Irf3__EC_ mice with clear visual evidence of IFNIC colony formation at the BZ, similar to WT mice (Extended Data Fig. 4). Similar results were
obtained using sepal, a separate unsupervised diffusion-based modelling method for analysis of spatial gene expression patterns22 (Fig. 3c). Finally, when WT mice were compared to each
transgenic line, only _Irf3__CM_ mice exhibited lower expression of gene counts of the ISG score per spot (Fig. 3d). As myeloid cells are often credited with initiating innate immune
responses, we also examined IFNIC colonies in mice lacking CCR2, a chemokine receptor that is critical for bone marrow myeloid cell responses to MI23,24. As expected, infarcted
CCR2-deficient mice exhibited marked reductions in myeloid cell infiltration compared with WT mice (Extended Data Fig. 5a,b). However, CCR2-deficient mice still had prominent IFNIC colonies
at the BZ with no significant differences in ISG expression, demonstrating that monocyte infiltration is dispensable for IFNIC colony formation. As plasmacytoid dendritic cells (pDCs) are
professional type I IFN-producing cells, we also evaluated their contribution to IFNIC colonies by performing pDC depletion before MI and found that they were also dispensable25 (Extended
Data Fig. 5c–f and Supplementary Fig. 4). Finally, we performed bone marrow transfers and found that irradiated WT mice reconstituted with either _Irf3__−/−_ or WT bone marrow showed
negligible differences in ISG expression in day 4 infarcts, supporting the conclusion that bone-marrow-derived myeloid cells are not essential for MI-induced IFN expression (Extended Data
Fig. 5g,h). Although cardiomyocytes were the dominant initiators of the type I IFN response, _Irf3__CM_ did not completely eliminate the clustered expression of ISGs compared with in global
_Irf3__−/−_ mice. Thus, we attempted to observe initiator type I IFN transcripts more directly. As sequencing-based transcriptomic methods lack the requisite sensitivity and spatial
resolution to reliably detect type I IFNs, we turned to imaging-based RNA MERFISH. This enabled subcellular detection of type I IFN transcripts and colocalization with cell-type-specific
transcripts (Fig. 3e,f and Extended Data Fig. 6). Among cells expressing _Ifna2_ transcripts on day 3 after MI, we found that 80% were BZ cardiomyocytes and the remaining 20% were BZ
fibroblasts (Fig. 3g–j). NUCLEAR RUPTURE IN BZ CARDIOMYOCYTES As type I IFNs were found in BZ cardiomyocytes and fibroblasts, which are both load-bearing cells, we considered the possibility
that initiation of IFNIC colonies was the result of mechanical force and deformation at the BZ rather than a unique property of one specific, differentiated cell type. Several in vitro
studies have demonstrated that mechanical force can cause transient nuclear rupture and CGAS localization near chromosomal DNA when the cell nucleus is deformed during tissue migration or
when cells are subjected to exogenous mechanical forces26,27,28,29. As we observed CGAS-dependent IFNIC colonies at the BZ after MI (Extended Data Fig. 1), we hypothesized that load-bearing
cells at the BZ may undergo nuclear-envelope deformation and rupture, and the loss of chromosomal DNA compartmentalization. To test whether mechanical force is sufficient to induce IFNIC
colonies in vivo, we induced traumatic injury by inserting and removing a fine needle into the mid ventricle, collected the hearts 3 days later and sectioned them to find the site of injury.
Spatial transcriptomic analysis revealed IFNIC colonies immediately adjacent to the site of injury (Extended Data Fig. 7a–g). We next quantified the nuclear morphology of DAPI-stained
cardiomyocytes after MI using the MERFISH data above and observed significant morphological distortion in BZ cardiomyocytes compared with in myocytes in the remote zone (RZ)30 (Extended Data
Fig. 7h). To determine whether frank nuclear rupture occurs in BZ cardiomyocytes, we generated reporter mice that selectively express nuclear-localizing tdTomato fluorescent protein in
cardiomyocytes (CM-tdTom-NLS). On day 3 after MI, we quantified the cellular localization of CM-tdTom-NLS and found that reporter fluorescence was confined to the nucleus in RZ
cardiomyocytes. However, in many BZ cardiomyocytes, we observed fluorescence extending outside of the nucleus to the cell membrane boundary, consistent with nuclear rupture and diffusion of
the CM-tdTom-NLS reporter throughout the cytoplasm (Fig. 4a–c). To test whether chromosomal DNA escaped from the nucleus, we performed DNA MERFISH using a library of sequence-specific
DNA-encoding probes covering 260 genomic loci across all 21 pairs of murine chromosomes followed by RNA MERFISH using the library of cell-type-specific probes (Fig. 4d,e and Extended Data
Fig. 7i). We measured significant increases in extranuclear DNA probes in cardiomyocytes of the BZ compared with the RZ on days 1 and 3 after MI (Fig. 4f,g). Taken together, these data
suggest that BZ cardiomyocytes experience nuclear rupture and loss of DNA compartmentalization, making it available for CGAS-dependent sensing and IRF3-dependent production of type I IFNs,
which can diffuse locally to neighbouring IFNAR-expressing cells and induce expression of ISGs, resulting in the observed IFNIC colonies. IFNIC CLUSTERS AT SITES OF LV RUPTURE In humans, MI
causes pathological left ventricular (LV) remodelling and development of heart failure. Without reperfusion, the risk of ventricular rupture exceeds 2% (refs. 31,32). In mice, it is well
established that WT male mice have a mortality of around 40% between days 3–7 after MI due to ventricular rupture33,34,35,36,37,38. However, genetic inhibition of the type I interferon
response can markedly decrease rupture rates and improve survival3. Conversely, antagonizing TGFβ signalling or key elements of the matricellular response (_Postn_ or _Sparc_) increase
susceptibility to MI-induced pathogenic remodelling and rupture35,36,37,39,40,41,42,43,44,45. To investigate the relationship between IFNIC colonies and ventricular rupture, we subjected 40
male mice to MI and continuously monitored for sudden death so that hearts could be immediately collected and processed for spatial transcriptomics38. Consistent with expectations, 16 out of
40 mice died suddenly, from which we successfully collected and processed 7 rupture samples for analysis. In each case, we observed IFNIC colonies immediately adjacent to the site of
ventricular rupture (Fig. 5a,b and Extended Data Fig. 8a–d). As genetically abrogating _Irf3_ protects mice from death after MI, this suggests that IFNIC colonies are causally linked to
pathological remodelling and rupture (Extended Data Fig. 8e,f). We next defined the cellular composition of IFNIC colonies using RNA MERFISH. Using a density-based spatial clustering
algorithm (DBSCAN), we separated _Ifit1_ clusters from scattered ISG expression, identified IFNIC cell types within each _Ifit1_ cluster and identified that fibroblasts and macrophages were
the primary ISG-expressing cells within BZ IFNIC colonies (Fig. 5c,d). To investigate how IFN and ISGs increase vulnerability to rupture, we performed differential expression testing in the
local microenvironment within IFNIC colonies at ventricular rupture sites and observed an inverse relationship between matricellular fibroblast responses (_Postn_, _Acta2_) and ISG
expression39,40,41,42,43,44,45 (Fig. 5d–f). Consistent with this, _Ifnar__−/−_ mice, which do not express ISGs in response to IFN stimulation, had greater numbers of activated fibroblasts
and expressed matrix markers (such as _Acta2_ and _Col1a1_) at higher levels than WT mice (Extended Data Fig. 9). Similarly, _Irf3__−/−_ mice also expressed matricellular genes at
significantly higher levels than WT mice (Extended Data Fig. 10). Together, these data suggest that the IFN response inhibits the protective fibroblast matricellular protein response in
vivo. To more directly test the effects of IFN on fibroblast activation, we differentiated human induced pluripotent stem (iPS) cells into ventricular fibroblasts, seeded them in a
three-dimensional collagen hydrogel, induced activation with TGFβ, and compared the degree of gel contraction and matricellular responses with or without IFNβ co-treatment46. IFNβ almost
completely abrogated TGFβ-induced gel contraction, an effect that was partially rescuable by the addition of anti-IFNAR neutralizing antibody47 (Fig. 5h). IFNβ treatment also attenuated
TGFβ-induced expression of matricellular proteins while increasing ISG expression (Fig. 5i,j). Collectively, these data provide support for a mechanism by which the type I IFN response may
increase vulnerability to rupture through its inhibitory effect on fibroblast activation and function. PROPOSED MODEL In conclusion, our data support a model in which MI causes ischaemic
cell death in the IZ that destabilizes the balance of forces and leads to mechanical stress at the BZ, resulting in nuclear rupture and decompartmentalization of genomic DNA primarily in BZ
cardiomyocytes and secondarily in BZ fibroblasts. This enables activation of the CGAS–STING–IRF3 DNA-sensing pathway, and production of secreted IFNs, which diffusively spread to
neighbouring IFNAR-expressing cells that respond by expressing ISGs and forming the observed IFNIC colonies. Within the IFNIC niche, IFN-exposed fibroblasts exhibit impaired activation,
contractile function and expression of protective matricellular proteins, which, when localized at sites of high mechanical stress (such as the junction of the ventricular free wall and
septum), may lead to the observed increase in vulnerability to pathologic remodelling and catastrophic rupture (Fig. 5j). The BZ IFNIC colonies represent an IFN response of intracardiac
origin initiated by non-immune cells that is distinct from previously described extracardiac sources (Supplementary Fig. 5). Relative cell type contributions to pathological remodelling and
catastrophic rupture remain to be fully elucidated. CONCLUSION Spatially resolved, multi-omics technologies are poised to reveal new microenvironment niches in healthy and injured tissues
that shape biological form and function. Here we identify a pathological niche within the BZ of the infarcted heart that has global effects on pathological remodelling and survival. Our
study suggests that selectively inhibiting the CGAS–STING–IRF3 pathway in non-immune BZ cardiomyocytes and fibroblasts could provide therapeutic benefit while avoiding broader
immunosuppression associated with inhibiting the type I IFN response across all innate immune cells48. METHODS ANIMALS Adult C57BL/6J mice were purchased from the Jackson Laboratory at 10
weeks of age and were housed in a pathogen-free environment at University of California San Diego (UCSD) facilities. Mice were maintained under a 12 h–12 h light–dark cycle with ad libitum
access to normal chow and sterile drinking water at 21 °C with 60% humidity. All animal experiments were approved by the subcommittee on Animal Research Care at UCSD (Institutional Animal
Care and Use Committee, S17144). _Irf3__−/−_ mice were bred in house from existing colonies. _Ccr2__−/−_ (strain 004999), _Ifnar1_− (028288), _Cgas__−/−_ (026554) and _Sting__gt/gt_ (017537)
mice were purchased from Jackson Laboratory. Nuclear reporter mice (tdTom-NLS) were purchased from Jackson Laboratory (025106). Cardiomyocyte-specific nuclear rupture reporter mice were
generated by crossing floxed tdTom-NLS with _Myh6__cre/+_ mice. _Irf3__fl/fl_ were a gift donated from T. Taniguchi. Cell-type-specific transgenics were generated by crossing _Irf3__fl/fl_
mice with transgenic mice expressing Cre recombinase under the control of the following promoters purchased from Jackson Laboratory: _Myh6__cre/+_ (011038), _Col1a1__creERT2/+_ (016241),
_Cx3cr1__creERT2/+_ (025524), _S100a8__cre/+_ (0216141), _Tie2__cre/+_ (008863). Inducible deletion was accomplished by intraperitoneal injection of tamoxifen 20 mg ml−1 in corn oil or
vehicle injection for 5 consecutive days in _Col1a1__creERT2/+_ and _Cx3cr1__creERT2/+_ mice. The mice were given 7 days to recover after the last tamoxifen or vehicle injection before any
surgical procedures were conducted. All of the experiments were performed with 12–14-week-old mice and were carried out using age-matched groups, and both male and female mice were used in
WT control groups without randomization and without statistical predetermination of sample sizes. All of the animal experiments were approved by the Subcommittee on Animal Research Care at
UC San Diego. No field collected samples were used in this study. PERMANENT LIGATION (MI) SURGERY AND CARDIOPROTECTIVE THERAPY For permanent ligation, mice were intubated and ventilated with
2% isoflurane. Thoracotomy was performed at the fourth left intercostal space was performed to expose the heart and visualize the left anterior descending artery (LAD). The LAD was
permanently ligated with an 8-0 nylon suture in mice with MI, and the hearts were collected at various timepoints (1 h, 4 h, day 1, day 3, day 7 or day 28 after surgery). Intercostal space
and skin were sutured closed using 6-0 prolene sutures. Cardioprotective therapy of anti-IFNAR antibodies was performed as previously described. Mice were treated with two intraperitoneal
doses of 500 μg of MAR1-5A3 IFNAR neutralizing antibody at 8 h and 48 h after MI surgery (BioXCell, BE04241). Hearts were collected at day 3 after MI. CARDIAC NEEDLE TRAUMA For in vivo
trauma of the myocardium, we used needle pass injury as previously described16. In brief, mice were anaesthetized under 2% isoflurane and partial thoracotomy was performed above the fourth
left intercostal space; a chest retractor was inserted and placed between the third and fourth intercostal spaces. After visualization of the heart and LAD, a 28 G bevelled needle was
inserted into the lateral LV free wall directly to the right of the LAD at the position in which we normally perform permanent ligation in MI; the needle did not penetrate through to the
endocardium. The 28 G bevelled needle was held in position in the midventricular wall for 3 s before being withdrawn. The chest retractor was then removed, and the intercostal space was
closed using 6-0 prolene sutures. To reduce complications due to pneumothorax, a sterile 20 G flexible angiocatheter was placed within the pleural space before removal of chest retractor.
The intercostal space and dermis were closed using 6-0 prolene sutures. After the skin was sutured and closed, a syringe was attached to the angiocatheter and negative pressure was manually
applied simultaneously as the catheter was withdrawn. Surgical glue was then applied to the remainder of the skin incision. CULTURING AND DIFFERENTIATION OF HUMAN IPS-CELL-DERIVED
FIBROBLASTS Human H9 embryonic stem cells were commercially acquired, tested for mycoplasma contamination and cultured on Matrigel-coated six-well plates (WiCell). Cell lines were tested for
mycoplasma contamination determined by PCR but were not subjected to additional verifications. H9 embryonic stem cells were maintained in mTeSR1 medium (StemCell Technologies, 85851) until
90% confluency. Once confluent, cells were split with mTeSR1 medium and 5 μM ROCK inhibitor Y27632, counted and plated at a confluency of 0.5 million cells per ml on Matrigel-coated 12-well
plates (Tocris, 1524). Cells were fed daily for 3 days and, the next day, cells were fed with RPMI basal medium and 4 μl of 36 mM of GSK3 inhibitor CHIR99021 (Sigma-Aldrich, R7388; Tocris,
4423) to begin differentiation. Then, 1 day after differentiation with GSK3 inhibitor, the medium was removed and cells were fed with only RPMI basal medium. Then, 2 days later, combined
medium was prepared as follows: 1 ml RPMI medium, 1 μl of 5 mM IWP2 (2.5 μM final concentration). Cells were fed with RPMI medium after 2 days and, after another 2 days, cells were detached
with ACCUTASE and inactivated by 20% fetal bovine serum (FBS) in RPMI medium (RPMI20) (StemCell Technologies, 07922). Cells were resuspended in LaSR basal medium containing 5 μM Y27632 ROCK
inhibitor and seeded onto gelatin-coated 12-well plates at a density of 5,000 cells per well. For the next 5 days, cells were fed with 12 ml of LaSR medium (advanced DMEM/F12 medium; 6.5 ml
GlutaMax, 500 μl of antioxidant 100 mg ml−1 ascorbic acid solution) + 3 μM CHIR99021 GSK3 inhibitor. Epicardial cells were removed from the plates with Accutase and quenched with RPMI20.
Cells were resuspended in LaSR medium supplemented with 5 μM Y27632 ROCK inhibitor. After overnight cell attachment, epicardial cells were differentiated into fibroblasts and maintained in
LaSR medium supplemented with 10 ng ml−1 bFGF (RnD Systems, 233-FB). After differentiation, human iPS-cell-derived fibroblasts were then replated and expanded on gelatin-coated six-well
plates and maintained on human cardiac fibroblast medium (MSDS 315-500, Cell Application). IN VITRO FIBROBLAST TREATMENT WITH TGFΒ AND IFNΒ Mouse L929 fibroblasts originally derived from
connective tissue and purchased from the American Type Culture Collection were used for in vitro cell culture experiments and tested for mycoplasma contamination but no additional cell
authentication methods were performed (ATCC CCL-1). Human iPS-cell-derived fibroblasts or L929 cells were seeded onto 10 mm gelatin-coated, treated culture plates and maintained with 10%
FBS/1% penicillin-supplemented DMEM until reaching confluency. Fibroblasts were subsequently subcultured and/or seeded onto six-well gelatin-coated plates for experimental treatments and
designated as passage 3 cells. For in vitro treatment of cells, we used recombinant human TGFβ (10 ng ml−1, Peprotech 100-21) and/or human IFNβ (10 ng ml−1, Peprotech 300-02) suspended in
culture medium for 24 h before collecting for downstream analysis. FIBROBLAST FUNCTIONAL ASSESSMENT WITH COLLAGEN GEL CONTRACTION ASSAY Human iPS-cell-derived cardiac fibroblasts or L929
fibroblasts were enzymatically dissociated from confluent culture plates, pelleted by centrifugation and quantified using a haemocytometer. Approximately 250,000 cells were suspended into 2
mg ml−1 collagen hydrogel solution and adjusted to 1 ml with 10% FBS-supplemented clear DMEM without phenol red (Advanced Biomatrix, 5074; Gibco, 31053028). The 1 ml solution is added to
12-well culture plate and placed in 37 °C incubator for 30 min to allow solidification of hydrogel. After solidification, gels were released from the sides of the wells by careful separation
using a pipette tip traced along the perimeter of gel. Gels were supplemented with 1 ml of clear culture medium and photographed to determine the gel area pre-contraction. After 24 h, gels
were treated with TGFβ (10 ng ml−1) as the positive control for gel contraction and/or IFNβ (10 ng ml−1). For relevant experiments, anti-IFNAR antibody was administered immediately after
TGFβ/IFNβ cotreatment with 1 μg ml−1 suspended in full medium and imaged at 24 h and 3 days after treatment. The gel area was determined using scaled images in ImageJ. RNA ISOLATION AND
QUANTITATIVE PCR RNA was isolated from myocytes using the RNeasy Mini Kit (Qiagen, 74536) and reverse transcribed using high-efficiency enzymes (Applied Biosystems, 438813). Quantitative PCR
was then performed using TaqMan primers for the following mouse transcripts _Col1a1_ (Mm00801666_g1), _Bgn_ (Mm001191753_m1), _Postn_ (Mm01284919_m1), _Sparc_ (Mm05915229_s1), _Irf7_
(Mm00516793_g1), _Oasl1_ (Mm00455081_m1), _Ifnb1_ (Mm00439552_s1), _Irf3_ (Mm00516784_m1), _Cxcl10_ (Mm00445235_m1), _Ifit1_ (Mm07295796_m1), _Isg15_ (Mm01705338_s1) and _Gapdh_
(Mm99999915_g1). In the studies done on human iPS-cell-derived cells, the following human transcripts were used: _POSTN_ (Hs01566750_m1), _SPARC_ (Hs00234160_m1), _COL1A1_ (Hs00164004_m1),
_IRF7_ (Hs00164004_m1), _IFI27_ (Hs01086373_g1), _IFIT3_ (Hs01922752_s1), and _GAPDH_ (Hs02786624_g1). For genotyping of transgenic animals, earsnip samples were digested in NaOH and
neutralized by Tris HCL. DNA was extracted and amplicons were amplified for gel electrophoresis. The primer sequences used for each transgenic line are included in Supplementary Table 4.
COLLECTION OF RUPTURED VENTRICLES As permanent LAD ligation in mice produces the mechanical defect of ventricular rupture comparable to clinical observations of myocardial rupture, we
performed MI surgery in a cohort of 40 WT mice aged 12–15 weeks purchased from Jackson Laboratory (000664). To preserve the integrity of RNA of ruptured ventricles, mice were closely
monitored for 12 consecutive hours each day starting from day 3 to day 14 after MI, which is the window of susceptibility for a rupture event to occur in mice. When an acute mortality was
observed, the chest cavity was immediately opened, and hearts were immediately perfused with cold PBS and collected. Tissue was quickly observed under a surgical microscope and then
flash-frozen by embedding in optimal cutting temperature (OCT) compound. Each acute mortality event was observed for (1) the presence of blood in the chest cavity and (2) visualization of
the rupture site under the microscope. These two criteria qualified a collected sample as a ruptured ventricle. PDC DEPLETION Mice were pretreated with intraperitoneal doses of 500 μg of
anti-mouse CD317 (BST2) antibody or isotype control antibody once a day for 3 days before MI surgery (BioXCell, BE0311). Hearts were collected at day 3 after infarct, flow sorted and
processed for scRNA-seq. CHIMERIC BONE MARROW TRANSFER For transfer of bone-marrow-derived cells from WT mice into _Irf3__−/−_ (WT to KO) experiments, recipient mice were irradiated for 12
min using a 10 Gy dose of ionizing radiation. Bone marrow cells were isolated from the femurs of WT or _Irf3__−/−_ donor mice, counted and resuspended in 1 ml of 5% bovine serum albumin/PBS
solution. Approximately half a million cells were suspended per 100 μl and donated through retroorbital injection into irradiated recipients. IMMUNOHISTOCHEMISTRY AND NUCLEAR RUPTURE IMAGING
All hearts collected for downstream analysis were perfused with first 10 ml of cold PBS contained within a syringe attached to a 28 G needle to remove contaminating blood. Tissue was
collected and embedded in OCT compound and flash-frozen in an isopentane bath cooled by dry ice. OCT-embedded hearts were sectioned into 10-μm-thick, short-axis sections for use with H&E
staining, immunofluorescence and spatial transcriptomics assays (Visium and MERFISH). H&E staining was performed according to the manufacturer’s suggested protocol. The 3D distribution
of cytosolic NLS signal was visualized and imaged using the Nikon AXR point-scanning confocal microscope. For each field of view taken at ×60 magnification, 15–20 optical slices were
obtained and used for maximal-intensity projections. Ruptured cardiomyocyte nuclei were normalized to the total number of nuclei analysed in each field of view acquired from the RZ or BZ
adjacent to infarct. CHROMAGENIC IN SITU HYBRIDIZATION Fixed frozen tissue from infarcted mouse hearts was prepared for chromogenic in situ hybridization by perfusion fixation with 4%
paraformaldehyde, collected and embedded in OCT compound. Cardiac short-axis cross-sections were cut into sections of 10 μm in thickness, dehydrated with ethanol, and underwent tissue
pretreatment including hydrogen peroxide incubation, transcript target retrieval and protease treatment according to manufacturer’s suggestions for the RNAscope 2.5 HD Duplex Assay (ACDBio).
The following probes were conjugated to HRP-based Green and AP-based Fast Red chromogens to detect _Nppa_ and _Ifit1_ transcripts in mouse cardiac tissue: Mm-Nppa-C1 (418691) and
Mm-Ifit1-C2 (50071-C2). SEQUENCING-BASED SPATIAL TRANSCRIPTOMICS OCT-embedded cardiac tissue blocks were cryosectioned in short-axis orientation at approximately 10 μm in thickness with the
cryostat temperature set to −22 °C. The sections were stained with H&E, and images were obtained using ×20 magnification on the Nikon Eclipse Ti2-E widefield microscope. The sections
were then processed for spatially resolved gene expression using the Visium Spatial Transcriptomics Kit according to the manufacturer’s protocol (10x Genomics). The permeabilization time of
infarcted mouse hearts was previously optimized and determined to be 30 min. Quality control for cDNA and libraries were performed on the Agilent TapeStation before sequencing on the
Illumina NovaSeq 6000 instrument. The resulting sequencing data were processed, and images were aligned using the SpaceRanger v.1.3.1 pipeline (10x Genomics). QUALITY CONTROL, NORMALIZATION
AND INTEGRATION FOR SEQUENCING-BASED SPATIAL TRANSCRIPTOMICS Sequencing-based spatial transcriptomic assays were initially preprocessed to assess variance in feature counts/spot and the
biological differences in cell density across heterogenous tissue morphology of the infarcted heart. Visual assessment of the underlying H&E confirmed lower molecular counts in tissue
regions of dead and necrotic tissue of the IZ, whereas high molecular counts were consistently seen in BZ areas. Normalization was performed using Seurat’s SCTransform v.2 method based on
negative binomial models that account for technical artifacts such as sequencing depth variations but detect and preserve highly variant biological features. This is performed by placing a
lower bound on the s.d. of low-expressed genes when using Pearson residuals to estimate highly variable features. Replicate data of experimental conditions were split into two Seurat objects
labelled as the control condition and the stimulated condition; our control condition consisted of all samples that served as our negative control, that is, infarcted hearts that lacked a
type I interferon response (_Irf3__−/−_, _Ifnar__−/−_, _Cgas__−/−_, _Sting__gt/gt_). All WT day-3 post-MI hearts, all tissue-specific _Irf3__−/−_ mice and _Ccr2__−/−_ mice were assigned to
the stimulated Seurat object. The control dataset was normalized using SCTransform and dimensional reduction was performed using principal component analysis. The stimulated group was
similarly normalized using SCTransform() and principal component analysis. To perform integration of the two categorized Seurat objects using Pearson residuals, FindIntegrationAnchors() was
performed followed by PrepSCTIntegration() on a merged list of the two objects to anchor and integrate the datasets together. Graph-based clustering using _k_-nearest neighbours function
FindNeighbors() was performed and shared nearest neighbours were identified using FindClusters() at a resolution of 0.40 on the entire integrated dataset. MORAN’S _I_ TEST STATISTIC, SEPAL
SCORE AND IFNIC COLONY-SIZE QUANTIFICATION The spatial distribution of genes was examined using the Moran’s _I_ test statistic, which is a spatial autocorrelation coefficient used to
quantify and measure spatial enrichment and distribution of individual genes. Moran’s _I_ was chosen as it is independent from differential gene expression and unrelated to clustering
information. This metric scale ranges from 1 (significant spatial enrichment) to 0 (homogenously distributed throughout biological sample). Moran’s _I_ revealed that ISGs are spatially
enriched and formed colonies with a high autocorrelation test statistic, indicating numerous focal IFN responses. As orthogonal validation of identifying spatially variable genes, we used
the Sepal method, which quantifies spatially clustered features using a diffusion-based simulation. Highly expressed, clustered gene expression are assigned a high Sepal score as it would
take a longer diffusion time (_d__t_) to reach homogenous distribution across space. To define and quantify ISG-expressing colonies, we considered first-order, contiguous neighbours as a
requisite to be designated as an IFNIC colony (Supplementary Fig. 3). We first compared log-normalized expression of _Ifit1_, _Rsad2_ and scored ISG transcripts in WT versus _Irf3__−/−_ day
3 infarcted tissue to determine that _Irf3__−/−_ mice are appropriate to use as a negative control for ISG expression. We then compared the relative frequency of _Ifit1_ and _Rsad2_ in all
of our biological replicate samples between WT and _Irf3__−/−_ day 3 MI spatial transcriptomic samples to determine a threshold or cut-off limit for the expression levels of each ISG. Once
the threshold was determined, we created a binomial ‘neighbourhood matrix’ consisting of ISG+ pixels and neighbouring pixels also with ISG+ expression above the designated threshold
expression value of 0.70 for _Ifit1_, 0.45 for _Rsad2_, 3.0 for ISG score spatial data and 10.0 for ISG score counts. When quantifying counts of the ISG score per spot, the threshold value
was determined as 10 (Extended Data Fig. 1). This was performed by assigning each pixel with a value of 0–6 corresponding to the number of ISG+ pixels (_N_) and quantified by taking the
intersect of a binary neighbourhood matrix (positive ISG neighbours) with a binary ISG classification matrix and summing by each column in the generated matrix. _k_-means nearest-neighbour
clustering of the chosen ISG transcript (for example, _Ifit1_) was then performed, and this approach yielded 4–8 colonies that were significantly absent in _Irf3__−/−_ mice. The IFNIC colony
area was calculated based on the 55 μm diameter of an individual Visium spot, and the distance between the centres of each adjacent spot measures 100 μm. ACTIVATED FIBROBLASTS, IZ AND BZ
MAPPING STRATEGY We mapped BZ or IZ labels to spatial transcriptomic clusters using a list of differentially expressed genes compiled from sn/scRNA-seq data of cardiomyocytes, innate immune
cells and fibroblasts based on our previously described method and publication (Supplementary Table 2). To classify CM-rich spatial clusters, we evaluated the gene-set scores found uniquely
elevated in post-MI samples specific to the BZ. Mapping of gene-set scores from CM snRNA-seq data to space was performed using area under the receiver operating characteristic (AUROC)
analysis. Clusters with an AUROC > 0.7 were positively classified. For IZ clusters, we performed subclustering to determine immune cell niches to map to space. To map activated
fibroblasts to space, we performed subclustering of our integrated snRNA-seq dataset to determine subclusters of fibroblasts designated as activated (_Postn_+) or non-activated (_Postn__−_).
Activated _Postn_+ fibroblasts were used in downstream analysis and the average expression of genes within this subset was determined comparing day 3 post-MI snRNA-seq data from WT samples
versus _Irf3__−/−_ or _Ifnar__−/−_ samples. Zones were quantified and normalized to total UMI and scaled by SCTransform. This analysis was performed with all spots from a representative day
3 post-MI sample and with IZ pixels (defined by clustering) to further explore heterogeneity at a timepoint predetermined to yield the highest expression of ISGs by snRNA-seq and spatial
transcriptomic data. Correlation tests were also performed with gene set scores to confirm colocalization patterns inferred from clustering analyses. We next curated subset-specific gene
lists using Seurat’s FindMarkers() function (logfc.threshold = 0.50, min. pct = 0.25, assay = “SCT”) in comparing respective clusters to relevant transcriptional neighbours. Gene lists were
filtered to remove genes with adjusted _P_ > 0.0001 and sorted by log-transformed fold change, and gene scores were generated from the top ten genes of each cluster, which were then
summed in each spatial assay. DETERMINATION OF IFNIC COLONY LOCALIZATION To assess whether observed IFNIC colonies localized to the infarct BZ at a rate greater than chance occurrence, the
Monte Carlo simulation method was used to approximate random sampling of our dataset. The coordinates of Visium spots with overlying tissue were extracted in which a random coordinate or
location was chosen for each simulation. During a simulation, the randomly chosen coordinate was assigned a neighbouring spot (_N_ + 1) and assessed for any overlap or adjacency with BZhigh
pixels. Each simulation was performed 500 times until _N_ + 1 = 12 for each sample. The probabilities generated from the simulations were transformed using _χ_2 contingency analysis and _P_
values were assessed using Fisher’s Exact tests to compare probability versus outcome, that is, the percentage of clusters that overlapped with any BZhigh pixels. INVERSE SPATIAL PATTERNING
OF ACTIVATED FIBROBLAST AND IFNIC SIGNATURES Centroids were selected from each IFNIC colony in analysed samples and primary, secondary and tertiary neighbours were then assigned.
Differential gene expression analysis was performed using Wilcoxon rank-sum tests and each neighbour and centroids of ISG colonies were compared. Line scans were performed by measuring gene
scores along a vector drawn from the IZ to the BZ. We previously determined gene scores by spatial clustering of transcripts that characterized the BZ and IZ described in detail above. Here
we used an ISG gene score determined from our previously generated datasets and spatially clustered genes. Gene scores were reported as a function of distance from a reference vector line
(orthogonal to image analysis line scans). For IZ and BZ neighbour analysis, we quantified the fraction of BZ and ISG pixels in second-order neighbours (defined by clustering analyses).
Results were binned on the basis of the reference pixel classification; IZ contained primarily transcripts designated as innate immune process or cells whereas BZ contained primarily
transcripts designated from BZ myocytes and activated fibroblasts. From this, we quantified both scores as a function of distance (0–400 μm) relative to the reference pixels. ANALYSIS OF
IFNIC COLONIES USING INFARCTED HUMAN TISSUE Spatial transcriptomic analysis of infarcted human samples was determined using deposited datasets from a recently published study using the same
genome-wide Visium platform and from our previously published samples. Patient samples were integrated using SCTransform described above, and metrics of spatial autocorrelation and size of
IFNIC colonies were performed using the methods described above and in the same manner as for mouse spatial transcriptomic analysis. BZ and ischaemic zone genes were transcriptionally
determined using snRNA-seq data of ‘CM2’ from the referenced multiomic study, and the tables are included in Supplementary Table 3. RNA MERFISH IMAGING-BASED SPATIAL TRANSCRIPTOMICS To
perform RNA MERFISH and sequential imaging in the infarcted murine heart, a 33-gene probe library targeting _Tnnt2_, _Ttn_, _Ankrd1_, _Nppa_, _Shroom3_, _Nppb_, _Xirp2_, _Flnc_, _Col1a1_,
_Col6a3_, _Postn_, _Cxcl5_, _Adgre1_, _Cd68_, _Ccr2_, _Chil3_, _S100a4_, _Ly6c2_, _Timd4_, _Lyve1_, _Cxcr2_, _Csf3r_, _Ly6g_, _Retnlg_, _S100a8_, _Pecam1_, _Flt1_, _Ifna2_, _Ifnb1_, _Ifit1_,
_Ifit2_, _Ifit3_ and _Cxcl10_ was designed and constructed to include cell-type-specific marker genes and genes covering the type I IFN signalling pathway. Approximately 20–60 barcoded
encoding probes were designed to target specifically 40 nucleotide subregions of selected transcripts49,50. Ventricular short-axis tissue sections were cut on a cryostat at 16 μm in
thickness onto silanized coverslips and were fixed in 4% PFA at room temperature for 10 min. The samples were then permeabilized with 5% SDS in PBS for 10 minutes followed by 80% ethanol in
water for a few hours. Tissue hybridization of encoding probes was performed for approximately 16 h in a humidified oven at 47 °C. After overnight hybridization and washing for 30 min with
40% formamide in 2× SSC with 0.1% Tween-20, the samples were cast in Bis/Acrylamide to cross-link and stabilize acrydite-modified encoding probes. Tissue clearing with proteinase K digestion
or photobleaching of samples was performed to quench background autofluorescence in the tissue samples51. Sequential hybridization and stripping of fluorescently labelled readout probes was
performed using an automated custom-built fluidics system. Imaging was performed on a custom-built system with a ×60 objective lens as previously described52. After data collection, raw
images underwent fitting analysis and image registration to correct for drift that occurred during image acquisition. Single mRNA molecules were computationally decoded, and the total
transcript signal and DAPI nuclear stain were used to perform cell segmentation with machine learning algorithm Cellpose52. QUALITY CONTROL, NORMALIZATION AND INTEGRATION FOR RNA MERFISH
Data analysis of RNA MERFISH data was performed with single-cell sequencing analysis tools such as Scanpy and Squidpy53,54. Quality-control metrics were determined by visualizing
distribution plots of the raw data for total transcript counts and number of genes with more than one counts per cell. These metrics were used to determine covariates that may affect the
quality of the dataset and filtered the data accordingly. Quality-control metrics are displayed in Supplementary Fig. 2. The data were then normalized using Scanpy and log-normalization of
the total number of transcripts. We performed RNA MERFISH experiments with multiple cardiac tissue sections and experimental conditions to control for batch effects. Data integration across
sections from different animals was performed using Scanpy’s principal component-based method ingest. We used the WT day 3 MI mouse cardiac section as our reference dataset and performed
Leiden clustering with subsets of marker genes from our encoding probe gene panel as follows: BZ cardiomyocytes (_Nppa_, _Flnc_, _Ankrd1_), fibroblasts (_Col1a1_, _Col6a3_), macrophages
(_Cd68_, _Adgre1_), neutrophils (_Cxcr2_, _Csf3r_) and endothelial cells (_Pecam1_, _Flt1_). Cells from infarcted _Irf3__−/−_ mice were ingested or embedded into the UMAP space of the
annotated cells in WT mice we used as reference. DNA MERFISH: GENOME-SCALE IN SITU CHROMATIN IMAGING DNA MERFISH was performed as previously described55,56,57. In brief, the mouse genome was
partitioned into 260 distinct DNA loci that spanned all 21 mouse chromosomes. Each genomic loci spanned around 30 kb and was targeted by 200–300 specific DNA-encoding probes. These primary
probes were synthesized from an oligonucleotide pool from Twist Biosciences and each contained a 40-nucleotide target sequence specific to a region of DNA loci. Sample preparation was
performed as previously described and hybridization of probes contained pools of both acrydite-modified RNA and DNA encoding libraries to facilitate downstream analysis of cell identity and
DNA localization. Fluorescently labelled readout probes were combinatorially labelled. Hybridization and stripping were performed using a custom-built fluidics and microscopy system (see the
‘RNA MERFISH imaging-based spatial transcriptomics’ section above). After data collection, raw images underwent fitting analysis and image registration to correct for drift. DNA loci were
computationally decoded using signal intensity between fields of view in multiple fluorescence channels to filter noise from signal. Nuclear-localized DNA probes were determined using
neighbourhood-based clustering with minimally ten decoded spots per 5 μm radius. Sparse, decoded DNA probes that met the criteria for positive signal but were outliers to the neighbourhood
distance were designated as extranuclear DNA. Nuclear shearing artifacts from cryosectioning were controlled and excluded from analysis by removing data in the first and last 5 μm regions of
the tissue sections. Cell segmentation was performed with Cellpose on DAPI staining and RNA molecules. Cells with extranuclear DNA underwent quality-control analysis as described above,
normalized and ingested with cells from our WT day 3 MI cells from the RNA MERFISH experiment. DENSITY-BASED CLUSTERING OF APPLICATIONS WITH NOISE ANALYSIS Analysis of RNA MERFISH IFNIC
colonies was performed using the density-based clustering algorithm (DBSCAN). This method considers whether a set of features are densely grouped or homogenously distributed with a certain
radius _ε_ (distance-based eps = 70). _ε_ was unbiasedly selected using _k_-nearest neighbour analysis. This algorithm identified eight groups of densely clustered ISG transcripts (_Ifit1_,
_Ifit2_, _Ifit3_, _Cxcl10_) as ISG expression in low-density regions that were designated as outliers or ‘scattered’ ISG expression. NUCLEAR MORPHOLOGY In cardiac sections that had undergone
RNA MERFISH analysis, cardiomyocyte nuclei were identified by the colocalization of hybridized _Tnnt2_ probes and DAPI fluorescence present in both the BZ and RZ. Approximately 200 nuclei
were quantified in each region by performing nuclear segmentation and creating a binary segmentation mask. These masks were analysed using ImageJ Particle Analysis to measure
cardiomyocyte-specific nuclear solidity. The solidity of a nucleus is calculated as the area of the DAPI-stained nuclei divided by the area of the convex hull; large deviations below
solidity ratio of 1.0 indicate irregularity of the nuclear contour. SINGLE-CELL ISOLATION, FLOW CYTOMETRY AND CELL SORTING Whole-cell suspensions were isolated from freshly collected hearts
as previously described. In brief, hearts were enzymatically digested for 45 min in continuous agitation at 37 °C in 450 U ml−1 collagenase, 125 U ml−1 collagenase XI, 60 U ml−1 DNase and 60
U ml−1 hyaluronidase. Cell suspensions were then filtered through 40 μm nylon mesh cell strainer containing flow cytometry staining buffer (FACS) and stained at 4 °C with DAPI to exclude
permeabilized cells and anti-mouse cocktail directed against major haematopoietic lineage markers Terr119 (1:100, TER119), B220 PE (1:100, RA3-6B), CD49b (1:200, DX5) and CD90.2 (1:500,
53-2.1). Secondary staining of myeloid and stromal cell subsets was performed using an anti-mouse antibody cocktail against CD11b (1:100, M1/70), and CD45.2 (1:100, 104), Ly6G (1:100, A1A8)
and F4/80 (1:100, BM8). Primary and secondary master mixes were suspended in FACS. Flow cytometry was performed on the SONY MA900 multi-application cell sorter. SINGLE-NUCLEUS ISOLATION
Single-nucleus suspensions were isolated from frozen ventricular tissue as previously described. In brief, mouse ventricles were collected, weighed and minced before flash-freezing by
immersion in liquid nitrogen. For isolation of nuclei, minced ventricles were suspended in 0.6 ml nucleus lysis buffer supplemented with 0.2 U μl−1 RNase inhibitor (Sigma-Aldrich, NUC101;
Enzymatics, Y9240L). Minced tissue was further homogenized with 2 ml dounce grinder for approximately 10 strokes with an A-sized pestle and 20 strokes with a B-sized pestle (Sigma-Aldrich,
D8938). The lysates were treated with an additional 1 ml of lysis buffer and incubated for an additional 2 min; the lysates were filtered through consecutive 100, 50 and 20 μm strainers
(CellTrics, 04-004-2318, 04-004-2317 and 04-0042-2315). Nuclei were pelleted by centrifugation at 1,000_g_ for 5 min at 4 °C. Subsequent washes were performed until the final suspension of
nuclei was made using 2% BSA in PBS supplemented with RNase inhibitor. The nucleus suspension was treated with 10 μg ml−1 4′,6-diamidino-2-phenylindole (DAPI), counted on a haemocytometer
and the volume was adjusted to produce a final suspension of 1,000 nuclei per μl. SN/SCRNA-SEQ ANALYSIS Microfluidic droplet-based separation of single cells or individual nuclei was
performed in which each was encapsulated with reagents for reverse transcription of mRNA, barcodes and unique molecular identifiers (UMIs) (10x Genomics Chromium). Paired-end sequencing was
performed using Illumina dye sequencing on the NovaSeqX Plus instrument. Demultiplexing of pooled samples and low-level analysis were performed using the Cell Ranger v.6.1.1 pipeline from
10x Genomics in which the sequenced samples were mapped to a mouse reference transcriptome (refdata-gex-mm10-2020-A, which includes introns), and redundant UMIs were eliminated. QUALITY
CONTROL, NORMALIZATION AND INTEGRATION FOR SN/SCRNA-SEQ Normalization was performed to account for variability in depth of sequencing reads per cell or nuclei as previously described. The
total transcript count for each nucleus was scaled to 10,000 molecules, and raw counts for each gene were normalized to the total count of captured transcripts associated with the barcoded
cells or nucleus and natural log transformed. Nuclei that contained at least 200 uniquely expressed genes represented in at least three nuclei were retained for further analysis. Ribosomal
and haemoglobin transcripts were excluded to avoid incorporation of transcriptional artifacts or technical variables accrued during nuclei isolation. Moreover, quality control was performed
to assess the quantity of low-quality/dying cells by assessing the percentage of mitochondrial transcripts present using the PercentageFeatureSet function and excluded nuclei containing more
than 5% mitochondrial content. Highly variable genes across individual datasets were identified with the FindVariableFeatures function using Seurat R package v.4.3, which performs
variance-stabilizing transformation with subsequent selection of 4,000 genes with the highest feature variance. Doublets and aggregated nuclei were determined by assessing non-endogenous
gene markers (for example, the presence of CM genes such as _Myh6_ in the fibroblast subset) and ambient RNA were removed using SoupX, which displayed subsets after filtering and removing
doublets/multiples. Integration of multiple scRNA-seq and snRNA-seq datasets was performed in Seurat using canonical correlation analysis (CCA) to identify anchors between datasets and
anchored with the mutual nearest-neighbour method using the Seurat FindIntegrationAnchors function. STATISTICS Statistical analyses were performed using Prism 9 (GraphPad Software). Group
size was based on previous experience and no statistical methods were used in selecting a predetermined sample size. Comparisons between two groups were analysed using two-tailed unpaired
Student’s _t_-tests for parametric analyses or two-tailed Mann-Whitney nonparametric tests. For comparison of multiple groups, one-way or two-way ANOVA was used to test main effects with
Dunnett’s, Tukey’s or Bonferroni’s post hoc analysis performed for multiple-comparison testing. Kruskal–Wallis testing was performed for multiple comparisons in one-way ANOVA analysis with
Dunn’s correction. Two-way ANOVA was used to test main effect with Tukey’s post hoc analysis to test interaction between groups. Differential expression analyses were performed using
nonparametric Wilcoxon rank-sum tests with Benjamini–Hochberg FDR adjustment. Unless otherwise stated, every experiment was repeated two or more times. Data represent mean ± s.e.m. as
indicated in the figure legends. REPORTING SUMMARY Further information on research design is available in the Nature Portfolio Reporting Summary linked to this article. DATA AVAILABILITY All
data supporting the findings in this study are provided in the Article and its Supplementary Information. scRNA-seq and snRNA-seq analysis of _Ifnar__−/−_ and _Irf3__−/−_ versus WT
infarcted mouse hearts are available at the Gene Expression Omnibus (GEO) under accession number GSE268876; all other snRNA-seq analyses were performed with published datasets deposited at
the GEO (GSE176092). Genetic spatial transcriptomic sequencing data have been deposited at the GEO (GSE269054). Evaluation of human MI by spatial transcriptomic data was performed using a
publicly available dataset available online (https://cellxgene.cziscience.com/collections/8191c283-0816-424b-9b61-c3e1d6258a77). Source data are provided with this paper. CODE AVAILABILITY
All R scripts used to analyse RNA-seq and sequencing-based spatial transcriptomic data are publicly available at Zenodo58 (https://zenodo.org/record/11608640). REFERENCES * Chen, C. J. et
al. Identification of a key pathway required for the sterile inflammatory response triggered by dying cells. _Nat. Med._ 13, 851–856 (2007). Article CAS PubMed Google Scholar * Adamo,
L., Rocha-Resende, C., Prabhu, S. D. & Mann, D. L. Reappraising the role of inflammation in heart failure. _Nat. Rev. Cardiol._ 17, 269–285 (2020). Article PubMed Google Scholar *
King, K. R. et al. IRF3 and type I interferons fuel a fatal response to myocardial infarction. _Nat. Med._ 23, 1481–1487 (2017). Article CAS PubMed PubMed Central Google Scholar * Cohn,
J. N., Ferrari, R. & Sharpe, N. Cardiac remodeling-concepts and clinical implications: a consensus paper from an international forum on cardiac remodeling. _J. Am. Coll. Cardiol._ 35,
569–582 (2000). Article CAS PubMed Google Scholar * Martin, S. S. et al. 2024 heart disease and stroke statistics: a report of US and global data from the American Heart Association.
_Circulation_ 149, e347–e913 (2024). Article PubMed Google Scholar * Cao, D. J. et al. Cytosolic DNA sensing promotes macrophage transformation and governs myocardial ischemic injury.
_Circulation_ 137, 2613–2634 (2018). Article CAS PubMed PubMed Central Google Scholar * Sun, L., Wu, J., Du, F., Chen, X. & Chen, Z. J. Cyclic GMP-AMP synthase is a cytosolic DNA
sensor that activates the type I interferon pathway. _Science_ 339, 786–791 (2013). Article ADS CAS PubMed Google Scholar * Wu, J. et al. Cyclic GMP-AMP is an endogenous second
messenger in innate immune signaling by cytosolic DNA. _Science_ 339, 826–830 (2013). Article ADS CAS PubMed Google Scholar * Patel, S. J., King, K. R., Casali, M. & Yarmush, M. L.
DNA-triggered innate immune responses are propagated by gap junction communication. _Proc. Natl Acad. Sci. USA_ 106, 12867–12872 (2009). Article ADS CAS PubMed PubMed Central Google
Scholar * Ablasser, A. et al. Cell intrinsic immunity spreads to bystander cells via the intercellular transfer of cGAMP. _Nature_ 503, 530–534 (2013). Article ADS CAS PubMed PubMed
Central Google Scholar * Ishikawa, H., Ma, Z. & Barber, G. N. STING regulates intracellular DNA-mediated, type I interferon-dependent innate immunity. _Nature_ 461, 788–792 (2009).
Article ADS CAS PubMed PubMed Central Google Scholar * Ishikawa, H. & Barber, G. N. STING is an endoplasmic reticulum adaptor that facilitates innate immune signalling. _Nature_
455, 674–678 (2008). Article ADS CAS PubMed PubMed Central Google Scholar * Sheehan, K. C. et al. Blocking monoclonal antibodies specific for mouse IFN-α/β receptor subunit 1 (IFNAR-1)
from mice immunized by in vivo hydrodynamic transfection. _J. Interferon Cytokine Res._ 26, 804–819 (2006). Article CAS PubMed Google Scholar * Schneider, W. M., Chevillotte, M. D.
& Rice, C. M. Interferon-stimulated genes: a complex web of host defenses. _Ann. Rev. Immunol._ 32, 513–545 (2014). Article CAS Google Scholar * Calcagno, D. M. et al. The myeloid
type I interferon response to myocardial infarction begins in bone marrow and is regulated by Nrf2-activated macrophages. _Sci. Immunol._ 5, eaaz1974 (2020). Article CAS PubMed PubMed
Central Google Scholar * Calcagno, D. M. et al. Single-cell and spatial transcriptomics of the infarcted heart define the dynamic onset of the border zone in response to mechanical
destabilization. _Nat. Cardiovasc. Res._ 1, 1039–1055 (2022). Article CAS PubMed PubMed Central Google Scholar * Calcagno, D. M. et al. SiglecF(HI) marks late-stage neutrophils of the
infarcted heart: a single-cell transcriptomic analysis of neutrophil diversification. _J. Am. Heart Assoc._ 10, e019019 (2021). Article CAS PubMed PubMed Central Google Scholar * Kuppe,
C. et al. Spatial multi-omic map of human myocardial infarction. _Nature_ 608, 766–777 (2022). Article ADS CAS PubMed PubMed Central Google Scholar * Moran, P. A. Notes on continuous
stochastic phenomena. _Biometrika_ 37, 17–23 (1950). Article MathSciNet CAS PubMed Google Scholar * Calcagno, D. M. et al. NOD-like receptor protein 3 activation causes spontaneous
inflammation and fibrosis that mimics human NASH. _Hepatology_ 76, 727–741 (2022). Article CAS PubMed Google Scholar * van Duijvenboden, K. et al. Conserved _NPPB_+ border zone switches
from MEF2- to AP-1-driven gene program. _Circulation_ 140, 864–879 (2019). Article PubMed Google Scholar * Andersson, A. & Lundeberg, J. sepal: identifying transcript profiles with
spatial patterns by diffusion-based modeling. _Bioinformatics_ 37, 2644–2650 (2021). Article CAS PubMed PubMed Central Google Scholar * Bajpai, G. et al. Tissue resident CCR2− and CCR2+
cardiac macrophages differentially orchestrate monocyte recruitment and fate specification following myocardial injury. _Circ. Res._ 124, 263–278 (2019). Article CAS PubMed PubMed
Central Google Scholar * Dutta, P. et al. Myocardial infarction activates CCR2+ hematopoietic stem and progenitor cells. _Cell Stem Cell_ 16, 477–487 (2015). Article CAS PubMed PubMed
Central Google Scholar * Swiecki, M. & Colonna, M. The multifaceted biology of plasmacytoid dendritic cells. _Nat. Rev. Immunol._ 15, 471–485 (2015). Article CAS PubMed PubMed
Central Google Scholar * Nava, M. M. et al. Heterochromatin-driven nuclear softening protects the genome against mechanical stress-induced damage. _Cell_ 181, 800–817 (2020). Article CAS
PubMed PubMed Central Google Scholar * Sladitschek-Martens, H. L. et al. YAP/TAZ activity in stromal cells prevents ageing by controlling cGAS-STING. _Nature_ 607, 790–798 (2022).
Article ADS CAS PubMed PubMed Central Google Scholar * Denais, C. M. et al. Nuclear envelope rupture and repair during cancer cell migration. _Science_ 352, 353–358 (2016). Article
ADS CAS PubMed PubMed Central Google Scholar * Raab, M. et al. ESCRT III repairs nuclear envelope ruptures during cell migration to limit DNA damage and cell death. _Science_ 352,
359–362 (2016). Article ADS CAS PubMed Google Scholar * Tamashunas, A. C. et al. High-throughput gene screen reveals modulators of nuclear shape. _Mol. Biol. Cell_ 31, 1392–1402 (2020).
Article CAS PubMed PubMed Central Google Scholar * Damluji, A. A. et al. Mechanical complications of acute myocardial infarction: a scientific statement from the american heart
association. _Circulation_ 144, e16–e35 (2021). Article PubMed PubMed Central Google Scholar * Honda, S. et al. Trends in the clinical and pathological characteristics of cardiac rupture
in patients with acute myocardial infarction over 35 years. _J. Am. Heart Assoc._ 3, e000984 (2014). Article PubMed PubMed Central Google Scholar * Gao, X. M., White, D. A., Dart, A. M.
& Du, X. J. Post-infarct cardiac rupture: recent insights on pathogenesis and therapeutic interventions. _Pharmacol. Ther._ 134, 156–179 (2012). Article CAS PubMed Google Scholar *
Forte, E. et al. Dynamic interstitial cell response during myocardial infarction predicts resilience to rupture in genetically diverse mice. _Cell Rep._ 30, 3149–3163 (2020). Article CAS
PubMed PubMed Central Google Scholar * Gao, X. M., Xu, Q., Kiriazis, H., Dart, A. M. & Du, X. J. Mouse model of post-infarct ventricular rupture: time course, strain- and
gender-dependency, tensile strength, and histopathology. _Cardiovasc. Res._ 65, 469–477 (2005). Article CAS PubMed Google Scholar * Gao, X. M. et al. Infarct size and post-infarct
inflammation determine the risk of cardiac rupture in mice. _Int. J. Cardiol._ 143, 20–28 (2010). Article PubMed Google Scholar * Salimova, E. et al. Variable outcomes of human heart
attack recapitulated in genetically diverse mice. _NPJ Regen. Med._ 4, 5 (2019). Article PubMed PubMed Central Google Scholar * Hanna, A., Shinde, A. V. & Frangogiannis, N. G.
Validation of diagnostic criteria and histopathological characterization of cardiac rupture in the mouse model of nonreperfused myocardial infarction. _Am. J. Physiol. Heart. Circ. Physiol._
319, H948–H964 (2020). Article CAS PubMed PubMed Central Google Scholar * Rainer, P. P. et al. Cardiomyocyte-specific transforming growth factor beta suppression blocks neutrophil
infiltration, augments multiple cytoprotective cascades, and reduces early mortality after myocardial infarction. _Circ. Res._ 114, 1246–1257 (2014). Article CAS PubMed PubMed Central
Google Scholar * Schellings, M. W. et al. Absence of SPARC results in increased cardiac rupture and dysfunction after acute myocardial infarction. _J. Exp. Med._ 206, 113–123 (2009).
Article CAS PubMed PubMed Central Google Scholar * Frantz, S. et al. Transforming growth factor beta inhibition increases mortality and left ventricular dilatation after myocardial
infarction. _Basic Res. Cardiol._ 103, 485–492 (2008). Article CAS PubMed Google Scholar * Ikeuchi, M. et al. Inhibition of TGF-β signaling exacerbates early cardiac dysfunction but
prevents late remodeling after infarction. _Cardiovasc. Res._ 64, 526–535 (2004). Article CAS PubMed Google Scholar * Shimazaki, M. et al. Periostin is essential for cardiac healing
after acute myocardial infarction. _J. Exp. Med._ 205, 295–303 (2008). Article CAS PubMed PubMed Central Google Scholar * Bujak, M. et al. Essential role of Smad3 in infarct healing and
in the pathogenesis of cardiac remodeling. _Circulation_ 116, 2127–2138 (2007). Article CAS PubMed Google Scholar * Dobaczewski, M. et al. Smad3 signaling critically regulates
fibroblast phenotype and function in healing myocardial infarction. _Circ. Res._ 107, 418–428 (2010). Article CAS PubMed PubMed Central Google Scholar * Bell, E., Ivarsson, B. &
Merrill, C. Production of a tissue-like structure by contraction of collagen lattices by human fibroblasts of different proliferative potential in vitro. _Proc. Natl Acad. Sci. USA_ 76,
1274–1278 (1979). Article ADS CAS PubMed PubMed Central Google Scholar * Bolivar, S. et al. In cardiac fibroblasts, interferon-beta attenuates differentiation, collagen synthesis, and
TGF-β1-induced collagen gel contraction. _Cytokine_ 138, 155359 (2021). Article CAS PubMed Google Scholar * Morand, E. F. et al. Trial of anifrolumab in active systemic lupus
erythematosus. _N. Engl. J. Med._ 382, 211–221 (2020). Article CAS PubMed Google Scholar * Moffitt, J. R. et al. High-throughput single-cell gene-expression profiling with multiplexed
error-robust fluorescence in situ hybridization. _Proc. Natl Acad. Sci USA_ 113, 11046–11051 (2016). Article ADS CAS PubMed PubMed Central Google Scholar * Xia, C., Fan, J., Emanuel,
G., Hao, J. & Zhuang, X. Spatial transcriptome profiling by MERFISH reveals subcellular RNA compartmentalization and cell cycle-dependent gene expression. _Proc. Natl Acad. Sci. USA_
116, 19490–19499 (2019). Article ADS CAS PubMed PubMed Central Google Scholar * Moffitt, J. R. et al. High-performance multiplexed fluorescence in situ hybridization in culture and
tissue with matrix imprinting and clearing. _Proc. Natl Acad. Sci. USA_ 113, 14456–14461 (2016). Article ADS CAS PubMed PubMed Central Google Scholar * Stringer, C., Wang, T.,
Michaelos, M. & Pachitariu, M. Cellpose: a generalist algorithm for cellular segmentation. _Nat. Methods_ 18, 100–106 (2021). Article CAS PubMed Google Scholar * Wolf, F. A.,
Angerer, P. & Theis, F. J. Scanpy: large-scale single-cell gene expression data analysis. _Genome Biol._ 19, 15 (2018). Article PubMed PubMed Central Google Scholar * Palla, G. et
al. Squidpy: a scalable framework for spatial omics analysis. _Nat. Methods_ 19, 171–178 (2022). Article CAS PubMed PubMed Central Google Scholar * Wang, S. et al. Spatial organization
of chromatin domains and compartments in single chromosomes. _Science_ 353, 598–602 (2016). Article ADS CAS PubMed PubMed Central Google Scholar * Bintu, B. et al. Super-resolution
chromatin tracing reveals domains and cooperative interactions in single cells. _Science_ 362, eaau1783 (2018). Article ADS PubMed PubMed Central Google Scholar * Su, J. H., Zheng, P.,
Kinrot, S. S., Bintu, B. & Zhuang, X. Genome-scale imaging of the 3D organization and transcriptional activity of chromatin. _Cell_ 182, 1641–1659 (2020). Article CAS PubMed PubMed
Central Google Scholar * Ninh, V. K. et al. Code for ‘Spatially clustered type I interferon responses at injury borderzones’. _Zenodo_ https://doi.org/10.5281/zenodo.11608640 (2024).
Download references ACKNOWLEDGEMENTS We thank the staff at the UC San Diego core facilities at the Institute for Genomic Medicine (IGM) and the Nikon Imaging Center for technical assistance;
P. Guo and R. Sanchez at the Nikon Imaging Center at UCSD for the support with microscopy and imaging experiments; and T. Taniguchi for the gift of the _Irf3__fl/fl_ mice. This publication
includes data generated at the UC San Diego IGM Genomics Center using the Illumina NovaSeq X Plus system that was purchased with funding from the National Institutes of Health (NIH) SIG
grant (S10 OD026929). Microscopy and image analysis was performed at the Nikon Imaging Center at UC San Diego. The work was funded by the American Heart Association AHA17IRG33410543 (K.R.K.)
and NIH grants NIH UL1TR001442 (UCSD), NIH R00HL129168 (K.R.K.), NIH DP2AR075321 (K.R.K.), NIH NHLBI T32HL007444 (V.K.N.), NIH T32HL105373 (D.M.C.) and NIH DP5OD031878 (B.B.). J.M.M. was
supported by an AHA pre-doctoral fellowship and an NHLBI Training Grant T32HL105373. AUTHOR INFORMATION Author notes * These authors contributed equally: V. K. Ninh, D. M. Calcagno AUTHORS
AND AFFILIATIONS * Division of Cardiology and Cardiovascular Institute, Department of Medicine, University of California San Diego, La Jolla, CA, USA V. K. Ninh, J. M. Duran, E. Adler, Z. Fu
& K. R. King * Department of Bioengineering, Jacobs School of Engineering, University of California San Diego, La Jolla, CA, USA D. M. Calcagno, J. D. Yu, B. Zhang, N. Taghdiri, R.
Sehgal, J. M. Mesfin, C. J. Chen, K. Kalhor, A. Toomu, K. Zhang, K. L. Christman, B. Bintu & K. R. King * Sanford Consortium for Regenerative Medicine, La Jolla, CA, USA J. M. Mesfin
& K. L. Christman * Department of Pathology, University of California San Diego, La Jolla, CA, USA J. Hu * Cellular and Molecular Medicine, Department of Medicine, University of
California San Diego, La Jolla, CA, USA B. Bintu Authors * V. K. Ninh View author publications You can also search for this author inPubMed Google Scholar * D. M. Calcagno View author
publications You can also search for this author inPubMed Google Scholar * J. D. Yu View author publications You can also search for this author inPubMed Google Scholar * B. Zhang View
author publications You can also search for this author inPubMed Google Scholar * N. Taghdiri View author publications You can also search for this author inPubMed Google Scholar * R. Sehgal
View author publications You can also search for this author inPubMed Google Scholar * J. M. Mesfin View author publications You can also search for this author inPubMed Google Scholar * C.
J. Chen View author publications You can also search for this author inPubMed Google Scholar * K. Kalhor View author publications You can also search for this author inPubMed Google Scholar
* A. Toomu View author publications You can also search for this author inPubMed Google Scholar * J. M. Duran View author publications You can also search for this author inPubMed Google
Scholar * E. Adler View author publications You can also search for this author inPubMed Google Scholar * J. Hu View author publications You can also search for this author inPubMed Google
Scholar * K. Zhang View author publications You can also search for this author inPubMed Google Scholar * K. L. Christman View author publications You can also search for this author
inPubMed Google Scholar * Z. Fu View author publications You can also search for this author inPubMed Google Scholar * B. Bintu View author publications You can also search for this author
inPubMed Google Scholar * K. R. King View author publications You can also search for this author inPubMed Google Scholar CONTRIBUTIONS V.K.N. and K.R.K. designed and performed experiments,
analysed the data and wrote the manuscript. V.K.N. generated transgenic mice used in this study, processed and analysed the sequencing-based spatial transcriptomic assays performed on
transgenic mice, and reanalysed the publicly available human MI spatial transcriptomes. V.K.N. processed and analysed the imaging-based MERFISH experiments with B.B.; D.M.C., B.Z., N.T.,
C.J.C. and K.K. performed nucleus and whole-cell isolations, analysed the scRNA-seq and snRNA-seq data, and performed spatial transcriptomics analysis of infarcted mouse hearts. J.D.Y.
developed methods for data analysis including applying Monte Carlo simulation to the transcriptomic BZ and analysed bioinformatics data. J.M.M., R.S. and A.T. performed cell culture
experiments with L929 mouse and human iPS-cell-derived fibroblasts. J.M.D., E.A. and J.H. provided human tissue samples. K.L.C. and K.Z. provided guidance on experimental design. Z.F.
performed all mouse surgeries and tissue processing for spatial transcriptomics. B.B. provided guidance on experimental design and analysed imaging-based MERFISH data. K.R.K. conceived the
project and provided funding. All of the authors reviewed the results and commented on the manuscript. CORRESPONDING AUTHOR Correspondence to K. R. King. ETHICS DECLARATIONS COMPETING
INTERESTS K.L.C. is a cofounder, board member and consultant for, and holds equity interest in Ventrix and Karios Technologies. K.R.K. and V.K.N. hold a patent declaration PCT 114198-5210 on
compositions and methods to treat muscle injury and disease. PEER REVIEW PEER REVIEW INFORMATION _Nature_ thanks Samuel Bakhoum, Rafel Kramann, Kory Lavine and Edward Thorp for their
contribution to the peer review of this work. ADDITIONAL INFORMATION PUBLISHER’S NOTE Springer Nature remains neutral with regard to jurisdictional claims in published maps and institutional
affiliations. EXTENDED DATA FIGURES AND TABLES EXTENDED DATA FIG. 1 THE TYPE I IFN RESPONSE PRODUCES SPATIALLY CLUSTERED ISG EXPRESSION. (A) Representative depiction of the type I IFN
pathway. The primary response involves cGAS sensing of decompartmentalized dsDNA in the cytosol and resulting 2nd messenger production of cGAMP. This activates the STING adaptor resulting in
phosphorylation and activation of the master transcriptional regulator IRF3. Translocation of IRF3 into the nucleus induces expression and secretion of type I IFN cytokines which signal to
bystander cells via binding to the IFNAR receptor in an autocrine or paracrine manner. IFNAR-binding results in the expression of hundreds of interferon stimulated genes (ISGs) as a robust
readout of the secondary response and delineation of IFNICs. (B) Spatially variable features were calculated by Seurat’s FindVariableFeatures() using vst as the selection method. Standard
variance plotted against log normalized average expression of highly variable features. ISGs were among the 2000 topmost variable features labelled. (C) Interferon stimulated genes projected
onto space in a D3 post-MI cardiac section. (D-H) Genetic knockout mice of signalling components in the cGAS-STING-IRF3 axis were infarcted and harvested D3 post-MI for spatial
transcriptomic analysis. Representative _Ifit1_ expression in infarcted (D) _Irf3_−/− (_n_ = 2 mice), (E) _Ifnar_−/− (_n_ = 2 mice), (F) anti-IFNAR-ab treatment (_n_ = 1 mouse), (G)
_Cgas_−/− (_n_ = 1 mouse) and (H) _STING_−/− (_Tmem173_) hearts (_n_ = 1 mouse). (I) Number of positive spots (above zero) for _Ifit1_ expression for infarcted WT and genetic knockout mice
of the cGAS-STING-IRF3 signalling axis. (J) Ranked plots for _Ifit1_ expression (.70), _Rsad2_ expression (.45), and gene counts of the ISG score (10) by measuring the difference between WT
and _Irf3_−/− (_n_ = 2 mice per genotype). Source Data EXTENDED DATA FIG. 2 COMPARISON OF TRANSCRIPTIONALLY DEFINED BZ AND UNDERLYING H&E TISSUE HISTOLOGY. (A) H&E tissue histology
underlying the transcriptionally defined anterior and posterior BZs for representative spatial transcriptomics samples. EXTENDED DATA FIG. 3 BIOLOGICAL REPLICATES OF THE CLUSTERED TYPE I IFN
RESPONSE AFTER MI IN MICE AND HUMANS AND CORRESPONDING NEGATIVE CONTROLS. ISG scores represented in all the sequencing-based spatial transcriptomic datasets used in this study with a
minimum cutoff of expression level 2. Reps refer to biological replicates and correspond with numbers of mice. (A) Table representing all biological replicates and samples used for spatial
transcriptomic analysis in this study. Column A contains representative images of sample conditions that were negative for IFNIC colonies including the validation of using knockouts of
Cgas-Sting-IRF3 pathway as negative controls for the study. (B) Positive IFNIC colonies represented in biological replicates for conditions used to determine the presence of ISG+ conditions.
(C) Representative IFNIC colonies in cell-specific knockouts (_n_ = 2 each transgenic line). (D) Percent of pixels positive for ISG scores out of total pixels overlying tissue were
calculated for each sample in negative vs. positive mouse datasets. Data analysed using two-tailed Mann-Whitney test and data are means ± s.e.m. and ****_P_ < 0.0001. Source Data EXTENDED
DATA FIG. 4 IFNIC COLONIES ARE INITIATED BY BZ CARDIOMYOCYTES. (A) Representative images of 4 individual ISGs in cardiomyocyte- (B) fibroblast- (C) macrophage- (D) neutrophil-, and (E)
endothelial-specific deletions of _Irf3_. (F) Ranked percentile of Moran’s I test statistic for ISGs _Ifit1_, _Ifit3_, _Rsad2_, _Irf7_, and _Isg15_ computed for each biological replicate of
WT D3 infarcted mice and cell-type deletions of _Irf3__−/−_ mice (_n_ = 3 WT mice and _n_ = 2 mice per transgenic line). (F) Data analysed with one-way ANOVA and Dunnett’s post-hoc analysis
for multiple comparisons. Data presented as mean values ± s.e.m. and **_P_ < 0.005. Results in (A-F) are representative of 2 independent repeated experiments. Source Data EXTENDED DATA
FIG. 5 INFILTRATING MYELOID CELLS ARE DISPENSABLE FOR IFNIC COLONY FORMATION IN THE INFARCTED MURINE HEART. (A) Representative _Ifit1_ + IFNIC colony and BZ gene score in Ccr2-defiicient
hearts at D3 post-infarct. (B) Gene scores for recruited macrophages and ISG’s were summed in each spot in WT and Ccr2-defiicient hearts at post-MI D3 (_n_ = 2 mice per condition). (C)
Timeline of antibody-mediated plasmacytoid dendritic cell (pDC) depletion. Anti-Bst2 antibody or isotype control antibody was administered for 3 days prior to MI surgery and hearts were
harvested D3 post-MI and processed for scRNA-seq. (D) Gating strategy to determine pDCs depletion in isotype control-treated or anti-BST2-ab treated, infarcted mouse hearts. Cd45 + B220+
positive myeloid cells were gated by MHCII expression and BST2 to identify pDCs. (E) Feature plots of _Ifit1_ expression in neutrophils and macrophages isolated from mice treated with either
isotype control-antibody or anti-Bst2-Ab treated mice. (F) Percentage of ISG+ macrophages and neutrophils in scRNA-seq data from D3 post-MI mouse hearts treated with anti-Bst2 (_n_ = 23,104
cells; 1 mouse) or Isotype control (_n_ = 12,196 cells; 1 mouse). (G) Chimeric bone marrow transplant experiment in which the bone marrow from WT or _Irf3__−/−_ mice are transplanted into
irradiated WT or _Irf3__−/−_ mice. Mice were allowed 8–10 weeks to recover from bone marrow transplant before performing MI and harvesting infarcted hearts D4 post-MI to perform. _Nlrp1a_
and _Irf3_ gene expression analysis measured by qPCR in the WT- > WT condition compared to KO- > WT condition (_n_ = 5 mice per condition). (H) Gene expression analysis by qPCR in D4
infarcted hearts between WT- > WT transfer and KO- > WT transfer conditions. Data was analysed using two-tailed unpaired student’s t-test (B, G, H) and presented as mean values ±
s.e.m., **_P_ < 0.01, ****_P_ < 0.0001. Source Data EXTENDED DATA FIG. 6 VALIDATION OF RNA MERFISH ENCODING PROBE LIBRARY BY COMPARISON OF LOG-NORMALIZED OF TRANSCRIPTS DETECTED IN WT
AND IRF3-DEFICIENT MICE. (A) Number of total probes designed for each transcript in the encoding library used in this study. (B) Quality control metrics of total counts of each transcript
detected in WT D3 MI heart and (C) in Irf3-deficient D3 MI heart. (D) Representation of _Ifna2_ (red), _Ifit1_ (magenta), and _Nppa_ (blue) in WT and _Irf3_−/− D3 MI mice (_n_ = 44,606 cells
from 1 WT mouse and 41,953 cells from 1 _Irf3_−/− mouse). (E) Comparison of the total mean counts in the raw data and (F) log-normalized counts of detected transcripts for BZ genes such as
_Nppa_, _Flnc_, _Ankrd1_ between WT and Irf3-deficient mice. EXTENDED DATA FIG. 7 DNA MERFISH ENABLES SEQUENCE-SPECIFIC DETECTION OF EXTRANUCLEAR DNA. (A) Time course of needle pass injury.
The appearance of _Ifit1_ expression occurred at D3 post-injury at the side of needle insertion, similar to the time course of ISG expression in infarcted hearts. (B) Close-up view of scored
ISGs, (C) mechanically induced _Piezo1_, (D) scored BZ genes, and (E) H&E at the site of day 3 post-injury. (F) Schematic of experimental traumatic injury induced by in vivo
needle-insertion in healthy hearts. BZ gene score and ISG score spatial transcriptomics and (G) quantitative comparison of ISG scores at BZ vs. RZ at the site of mechanical injury (_n_ = 4
mice). (H) Nuclear solidity of RZ vs. BZ cardiomyocytes was identified by _Tnnt2_ transcript expression (_n_ = 200 nuclei per region of interest across 2 mice) in RNA MERFISH images. (I)
Regions of interest used to image and quantify extranuclear DNA probes in WT D1 and WT D3 infarcted hearts were chosen based on underlying histology demarcating the RZ and BZ (_n_ = 2 mice).
The regions designated as RZ are shown in blue dashed boxes, and the regions designated as the BZ are shown in red dashed boxes for each sample. RNA MERFISH was then performed on these same
samples by hybridizing the encoding library listed in Extended Data Fig. 6a to identify the cell types containing extranuclear DNA probes. (G, H) Data was analysed using one-way ANOVA with
Sidak’s multiple comparisons test between between RZ and BZ regions across 4 biological samples (G) and two-tailed Mann-Whitney test (H). Data are means ± s.e.m. and ****_P_ < 0.0001.
Source Data EXTENDED DATA FIG. 8 IFNIC COLONIES AND ISG EXPRESSION APPEAR DIRECTLY ADJACENT TO THE SITE OF VENTRICULAR RUPTURE. (A) Infarcted mice were monitored during D3-D7 post-MI for
sudden death and rapidly collected by flash-freezing to preserve RNA integrity. Representative images of 7 collected rupture samples from WT mice show IFNIC colonies directly adjacent to the
site of ventricular rupture (_n_ = 7). (B) In situ hybridization of ruptured cardiac cross section with representative _Flnc_ (blue), _Postn_ (green), and _Ifit3_ (magenta). Clustering of
_Ifit3_ to the site of rupture is seen and demarcated by white dotted line. (C) Moran’s I test statistic for each ISG was computed in ruptured heart samples compared to _Irf3__−/−_ hearts
(_n_ = 3 mice per condition). (D) Line scans were performed in WT D3 MI samples to quantify the inverse correlation between _Postn_ (Supplementary Table 2) and ISG scores along a diagonal
vector (_n_ = 3 mice). (E) Post-MI survival performed with WT (_n_ = 40 mice), _Irf3_−/− (_n_ = 15 mice), _Irf3_fl/fl:Myh6cre/+ (_n_ = 10), and _Irf3_fl/fl littermate controls (_n_ = 6).
Littermate controls from this cohort matched WT survival as expected. (F) Littermate controls from the second cohort exhibited 100% survival (_n_ = 5). Given the potential batch effect, the
littermate controls are thus underpowered. Spatial correlation coefficients were transformed with Fisher’s Z and compared using two-tailed unpaired t-tests (C). ANCOVA with LOESS moving
average and regression analysis was used in (D). Data presented as mean values ± s.e.m. and *_P_ < 0.05. Results in (A-C) are representative of 4 independent repeats. Source Data EXTENDED
DATA FIG. 9 SIGNALLING THROUGH TYPE I IFN RECEPTOR ANTAGONIZES FIBROBLAST ACTIVATION AND FUNCTION. (A) Whole cell isolation from WT and IFNAR-deficient hearts processed for scRNA-seq.
Single cell datasets were integrated and log normalized (_n_ = 4 WT, 2 _Ifnar_−/− mice). (B) UMAP of clustered fibroblasts and macrophages from WT and _Ifnar_−/− D4 infarcted hearts.
Integrated fibroblasts were split by activated vs. nonactivated fibroblasts based on differential expression of _Postn_ gene score. (C) Heatmap of fibroblast subcluster marker genes. (D)
Feature scatterplot from D4 MI hearts showing an inverse scatter profile between _Postn_HI and ISG scores. Approximately 5% of fibroblasts isolated from WT infarcted hearts are IFNICs and
express low counts of _Postn_ (_n_ = 4 WT mice). (E) Percentage of activated fibroblast composition between _Ifnar_−/− and WT mouse hearts and (F) log normalized expression of gene markers
in activated fibroblast populations (_n_ = 784 WT and 802 _Ifnar_−/− fibroblasts). (G) Volcano plot of differentially expressed genes between WT and _Ifnar_−/− macrophages corrected (_n_ =
3628 WT macs, 3885 _Ifnar_−/− macs). (H) Collagen Gel contraction assays performed with L929 fibroblasts treated with 10 ng/mL TGFβ, 10 ng/mL IFNβ, or combination treatment (_n_ = 3
replicates per condition). (I) Treatment with anti-IFNAR-ab abrogated the IFNβ-mediated blockade of the fibroblast contractile phenotype (_n_ = 3 gels per condition). (J) Top: L929
fibroblast gene expression of matricellular proteins after treatment with TGFβ, IFNβ, or combination treatment, and corresponding inverse expression of ISG’s in the bottom panel (_n_ = 2
replicates per condition). Data was analysed using two-tailed unpaired t or Mann-Whitney test (E, F), Wilcoxon rank sum test with Benjamini-Hochberg FDR correction (B, C, G), and two-tailed
one-way ANOVA with Bonferroni’s post-hoc analysis (H, I, J). Data are mean ± s.e.m., *_P_ > 0.05, *** _P_ > 0.0005 ****_P_ > 0.00005. Source Data EXTENDED DATA FIG. 10
IRF3-DEFICIENT HEARTS HAVE GREATER FIBROBLAST ACTIVATION AND PROTECTIVE MATRICELLULAR RESPONSES. (A) Nuclei isolation from WT and Irf3-deficient hearts were processed for snRNA-seq. Nuclei
data sets were integrated to enable direct comparison of cell types. (B) Averaged heatmap identifying fibroblast subpopulations were further stratified into activated and not activated based
on variable expression level of _Postn_. (C) UMAP of clustered fibroblasts from snRNA-seq integrated data of WT and _Irf3_−/− nuclei from D3 infarcted hearts in the left panel and
separation of activated vs. non-activated fibroblast populations in the right panel (Wilcoxon-signed rank test, Bonferroni-adjusted _P_ < 0.01). (D) Percent of activated fibroblasts out
of total captured fibroblasts (_n_ = 3 mice per condition). (E) Log normalized expression of fibroblast activation markers between those captured from Irf3-deficient and WT D3 MI hearts.
Data were analysed using two-tailed unpaired t test (D, E). All data represented as mean ± s.e.m. *_P_ > 0.05, **_P_ > 0.005, _***P_ > 0.0005, ****_P_ > 0.00005. Source Data
SUPPLEMENTARY INFORMATION SUPPLEMENTARY INFORMATION Supplementary Figs. 1–5. REPORTING SUMMARY SUPPLEMENTARY TABLE 1 Detailed test statistics and methods used to analyse data. SUPPLEMENTARY
TABLE 2 Transcript lists used in gene scoring method for visualizing cell subpopulations and summing gene counts in mouse spatial transcriptomes. SUPPLEMENTARY TABLE 3 Transcript lists used
in gene scoring method for visualizing cell subpopulations and summing gene counts in human spatial transcriptomes and analysed from publicly available dataset. SUPPLEMENTARY TABLE 4 Primers
used in genotyping transgenic mice used in the study. SOURCE DATA SOURCE DATA FIG. 1 SOURCE DATA FIG. 2 SOURCE DATA FIG. 3 SOURCE DATA FIG. 4 SOURCE DATA FIG. 5 SOURCE DATA EXTENDED DATA
FIG. 1 SOURCE DATA EXTENDED DATA FIG. 3 SOURCE DATA EXTENDED DATA FIG. 4 SOURCE DATA EXTENDED DATA FIG. 5 SOURCE DATA EXTENDED DATA FIG. 7 SOURCE DATA EXTENDED DATA FIG. 8 SOURCE DATA
EXTENDED DATA FIG. 9 SOURCE DATA EXTENDED DATA FIG. 10 RIGHTS AND PERMISSIONS OPEN ACCESS This article is licensed under a Creative Commons Attribution 4.0 International License, which
permits use, sharing, adaptation, distribution and reproduction in any medium or format, as long as you give appropriate credit to the original author(s) and the source, provide a link to
the Creative Commons licence, and indicate if changes were made. The images or other third party material in this article are included in the article’s Creative Commons licence, unless
indicated otherwise in a credit line to the material. If material is not included in the article’s Creative Commons licence and your intended use is not permitted by statutory regulation or
exceeds the permitted use, you will need to obtain permission directly from the copyright holder. To view a copy of this licence, visit http://creativecommons.org/licenses/by/4.0/. Reprints
and permissions ABOUT THIS ARTICLE CITE THIS ARTICLE Ninh, V.K., Calcagno, D.M., Yu, J.D. _et al._ Spatially clustered type I interferon responses at injury borderzones. _Nature_ 633,
174–181 (2024). https://doi.org/10.1038/s41586-024-07806-1 Download citation * Received: 23 April 2023 * Accepted: 09 July 2024 * Published: 28 August 2024 * Issue Date: 05 September 2024 *
DOI: https://doi.org/10.1038/s41586-024-07806-1 SHARE THIS ARTICLE Anyone you share the following link with will be able to read this content: Get shareable link Sorry, a shareable link is
not currently available for this article. Copy to clipboard Provided by the Springer Nature SharedIt content-sharing initiative