Play all audios:
ABSTRACT Most kidney cancers are metabolically dysfunctional1,2,3,4, but how this dysfunction affects cancer progression in humans is unknown. We infused 13C-labelled nutrients in over 80
patients with kidney cancer during surgical tumour resection. Labelling from [U-13C]glucose varies across subtypes, indicating that the kidney environment alone cannot account for all tumour
metabolic reprogramming. Compared with the adjacent kidney, clear cell renal cell carcinomas (ccRCCs) display suppressed labelling of tricarboxylic acid (TCA) cycle intermediates in vivo
and in ex vivo organotypic cultures, indicating that suppressed labelling is tissue intrinsic. [1,2-13C]acetate and [U-13C]glutamine infusions in patients, coupled with measurements of
respiration in isolated human kidney and tumour mitochondria, reveal lower electron transport chain activity in ccRCCs that contributes to decreased oxidative and enhanced reductive TCA
cycle labelling. However, ccRCC metastases unexpectedly have enhanced TCA cycle labelling compared with that of primary ccRCCs, indicating a divergent metabolic program during metastasis in
patients. In mice, stimulating respiration or NADH recycling in kidney cancer cells is sufficient to promote metastasis, whereas inhibiting electron transport chain complex I decreases
metastasis. These findings in humans and mice indicate that metabolic properties and liabilities evolve during kidney cancer progression, and that mitochondrial function is limiting for
metastasis but not growth at the original site. SIMILAR CONTENT BEING VIEWED BY OTHERS METABOLIC ALTERATIONS IN HEREDITARY AND SPORADIC RENAL CELL CARCINOMA Article 22 January 2024 DYNAMIC
PARTITIONING OF BRANCHED-CHAIN AMINO ACIDS-DERIVED NITROGEN SUPPORTS RENAL CANCER PROGRESSION Article Open access 20 December 2022 THE EXPRESSION PATTERN OF PYRUVATE DEHYDROGENASE KINASES
PREDICTS PROGNOSIS AND CORRELATES WITH IMMUNE EXHAUSTION IN CLEAR CELL RENAL CELL CARCINOMA Article Open access 05 May 2023 MAIN Mitochondrial alterations are a common feature of renal cell
carcinomas (RCCs), but the mechanisms underlying mitochondrial anomalies vary among RCC subtypes. In clear cell RCC (ccRCC), the most common form of RCC, approximately 90% of tumours have
biallelic inactivation of the gene encoding the tumour suppressor von Hippel–Lindau (_VHL_). Loss of VHL leads to pseudohypoxic stabilization of HIFα subunits and chronic activation of HIF
target genes5,6, many of which promote glycolysis and suppress glucose oxidation7,8. A subset of chromophobe RCCs contain mutations in complex I of the electron transport chain (ETC)2, and
oncocytomas accumulate defective mitochondria through somatic mutations in complex I and impaired mitochondrial elimination programs9,10. Pathogenic defects in the metabolic enzymes fumarate
hydratase (FH) and succinate dehydrogenase (SDH) are also initiating events in some renal cancers11,12. These data imply that many RCCs select for reduced mitochondrial metabolism during
their initiation and growth in the kidney. Despite genetic evidence for mitochondrial dysfunction, how these mutations affect nutrient metabolism in human RCCs in vivo is unknown.
Intraoperative infusion of 13C-labelled nutrients and analysis of 13C labelling in metabolites extracted from surgically resected samples can reveal metabolic differences between tumours and
adjacent tissue or among tumours from different patients13. We previously reported suppressed contribution of glucose carbon to TCA cycle intermediates in five human ccRCCs1, implying
reduced glucose oxidation in these tumours. Here we studied why this phenotype occurs, whether it generally characterizes primary kidney tumours and how metabolic properties evolve during
ccRCC progression to metastatic disease. KIDNEY CANCERS USE GLUCOSE VARIABLY Patients undergoing partial or radical nephrectomy for kidney cancer were administered a 13C-labelled nutrient
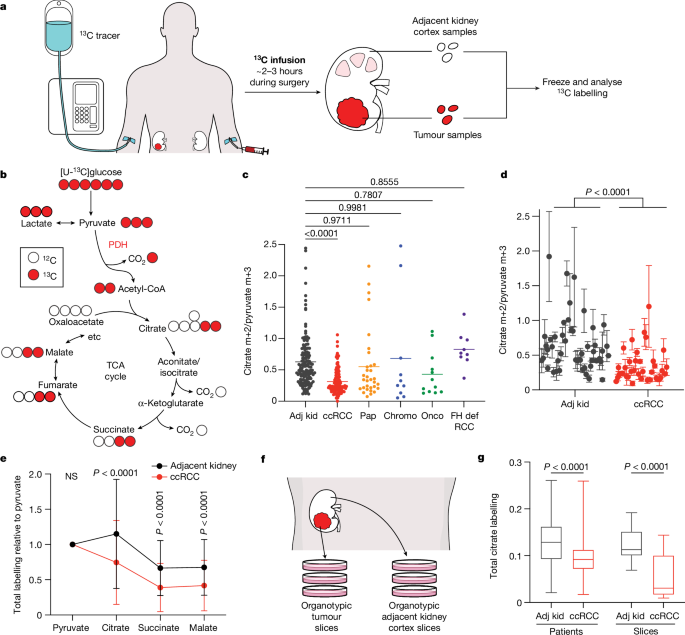
through a peripheral intravenous line during surgery (Fig. 1a). After resection (typically 2–3 h after the beginning of the infusion), tissue samples for metabolic analysis were chosen in
consultation with the attending pathologist or pathology assistant. Using this approach, we studied 59 patients infused with [U-13C]glucose with various RCC subtypes, including 37 patients
with ccRCC (clinical features of patients with primary RCC are in Supplementary Table 1). At the time of resection, plasma glucose labelling varied with the infusion rate (4 g h−1 versus 8 g
h−1) but was unrelated to the cancer subtype (Extended Data Fig. 1a,b). ccRCCs infused with [U-13C]glucose exhibited high transcriptional correlation (_R_ = 0.864) with The Cancer Gene
Atlas (TCGA) Kidney Renal Clear Cell Carcinoma (KIRC) dataset (Extended Data Figs. 1c and 2 and Supplementary Table 2), and similar metabolomics features with tumours studied at another
centre14 (Extended Data Fig. 3 and Supplementary Table 3). Therefore, the tumours we analysed with 13C infusions share molecular and metabolic characteristics with ccRCCs reported elsewhere.
The labelling ratio of citrate m+2 (that is, the fraction of citrate molecules containing two 13C nuclei) to pyruvate m+3 was lower in ccRCC samples than in adjacent kidney, indicating a
reduced contribution of glucose through the pyruvate dehydrogenase (PDH) reaction (Fig. 1b,c; isotopologues are in Supplementary Table 4). Labelling was variable in the tumours and renal
cortex (hereafter, adjacent kidney), reflecting both interpatient variability and regional labelling differences among samples from the same patient (Fig. 1d). When citrate m+2/pyruvate m+3
ratios were compared between ccRCC and adjacent kidney in the same patient, 17 patients had a statistically significant decrease in the tumour, and only 1 patient had a statistically
significant increase (Extended Data Fig. 1d). Nine patients did not have matched adjacent kidney available for analysis. In addition to suppressed citrate m+2/pyruvate m+3 labelling ratios,
total labelling of citrate and other TCA cycle intermediates (1 − [m+0]) was also suppressed in ccRCCs (Fig. 1e); this metric incorporates all routes of label entry into the TCA cycle and
multiple turns of the cycle. Normalizing total labelling to glucose m+6 or pyruvate m+3 in the plasma produced similar results (Extended Data Fig. 1e,f), and m+1 intermediates produced from
multiple TCA cycle turns were reduced in ccRCC tumours compared with the adjacent kidney (Extended Data Fig. 1g). Suppressed labelling of TCA cycle intermediates was not observed in all RCC
subtypes (Fig. 1c and Extended Data Fig. 1h). We also generated viable agarose-embedded slices of kidney or ccRCC tissues from six patients and labelled them with [U-13C]glucose ex vivo in
medium formulated to contain a nutrient content similar to human plasma15 (Fig. 1f). This revealed a similar degree of labelling suppression in citrate and malate as what was observed in the
patients (Fig. 1g and Extended Data Fig. 1i). Together, the data indicate that low TCA cycle labelling from [U-13C]glucose is a specific, intrinsic property of ccRCC tumours that does not
directly result from residence in the kidney and is not an artefact of surgery. ACETATE AND GLUTAMINE FEED THE TCA CYCLE We next infused 12 patients with ccRCC with [1,2-13C]acetate (m+2),
which can be converted to acetyl-CoA m+2 by acetyl-CoA synthetases (Fig. 2a). Unlike pyruvate, which can enter the TCA cycle through both acetyl-CoA and oxaloacetate to produce complex
labelling on even the first TCA cycle turn, acetate only enters through acetyl-CoA to exclusively produce m+2 labelling in the first turn. [1,2-13C]acetate also contributes 13C to the TCA
cycle independently of PDH, so it provides an approach to test TCA cycle labelling perturbations beyond PDH suppression. The conditions that we used to infuse [1,2-13C]acetate did not alter
acetyl-CoA levels in tumours or adjacent kidneys and produced similar levels of acetyl-CoA labelling in both tissues (Fig. 2b,c and see Supplementary Table 5 for full isotopologue
distributions). Fractional enrichments of m+2 TCA cycle intermediates in ccRCC tumours were also similar to adjacent kidney (Fig. 2d), indicating similar contributions to the TCA cycle under
these conditions. However, total labelling (1 − [m+0]) of these metabolites revealed decreased labelling in tumours compared with in the kidney, consistent with reduced labelling beyond
turn 1 of the TCA cycle (Fig. 2e). We then examined TCA cycle turnover in three ways. First, the high enrichment in acetyl-CoA (average of 20–25%) allowed us to observe higher-order
labelling in TCA cycle intermediates from subsequent rounds of incorporation of acetyl-CoA m+2 (Fig. 2f). The ratio of citrate m+4 to citrate m+2, a marker of 13C retention through two
cycles, was reduced by about 50% in tumours relative to kidneys (Fig. 2g). Second, we examined TCA cycle labelling in fresh mitochondria isolated from these resected tissues and cultured
with [U-13C]pyruvate. Both the citrate m+2/pyruvate m+3 ratio and the citrate m+4/citrate m+2 ratio were decreased in ccRCC mitochondria compared with those in kidney mitochondria (Fig. 2h),
supporting the hypothesis that TCA cycle labelling reflects mitochondrial perturbations beyond simple PDH suppression. Third, we examined positional 13C labelling in glutamate, which
exchanges with α-ketoglutarate (α-KG) and is classically used as a reporter of TCA cycle metabolism16 (Fig. 2a). Total glutamate labelling was lower in tumours than in adjacent kidney
(Extended Data Fig. 4a), but glutamate m+2 was similar (Extended Data Fig. 4b), mirroring the pattern in TCA cycle intermediates. Despite the similar m+2 fractional enrichment, the labelled
13C carbons had differential positioning in glutamate extracted from ccRCC tumours compared with the adjacent kidney. Using a mass spectrometry method that reports isotopic position with
high sensitivity17, we determined that [4,5-13C]glutamate, which appears in the first turn of the cycle (Fig. 2a), accounts for a much higher fraction of glutamate labelling in tumours than
in adjacent kidney (Fig. 2i). Therefore, most glutamate m+2 comes from the first turn of the TCA cycle, whereas labelling patterns requiring multiple turns are suppressed in ccRCC tumours.
To assess the TCA cycle using a third tracer, we infused seven patients with ccRCC with [U-13C]glutamine. Glutamine is the most abundant amino acid in the circulation, and its uptake in the
tumour microenvironment is dominated by malignant cells18. Although glutamine can contribute to many pathways, we focus on its utilization as a TCA cycle substrate. The contribution of
glutamine to the TCA cycle involves conversion to α-KG followed by either oxidation through α-KG dehydrogenase or reductive carboxylation by isocitrate dehydrogenase 1 or isocitrate
dehydrogenase 2 (ref. 19). In cell culture, labelling through reductive metabolism is enhanced by processes that suppress pyruvate oxidation, including _VHL_ loss, PDH suppression and
mitochondrial defects20,21. Isotope labelling in citrate and other TCA cycle intermediates can discriminate pathway use (Fig. 3a). Patient infusions produced similar glutamine m+5 enrichment
in tumours and adjacent kidneys (30–35%; Fig. 3b). Labelling of glutamate m+5 and TCA cycle intermediates from the first turn of the oxidative TCA cycle (m+4) were also similar between
tumour and kidney (Fig. 3b), as was total labelling (1 − [m+0]) of these metabolites (Fig. 3c and see Supplementary Table 6 for all isotopologues). Citrate was an exception, with higher
total labelling in tumours than in kidneys (Fig. 3c). The excess labelling in citrate involved enhanced contributions from the reductive pathway, as indicated by high citrate m+5 in most
fragments (Fig. 3d and Extended Data Fig. 5a). This level of labelling exceeded labelling in plasma citrate, indicating that it resulted from metabolism localized to the tumour (Extended
Data Fig. 5b). The tumours also contained relatively high levels of malate m+3, indicating further metabolism along the reductive pathway (Fig. 3e and Extended Data Fig. 5c). Therefore,
glutamine is used as a nutrient in human ccRCC, and its metabolism results in oxidative and reductive labelling of TCA cycle intermediates. MOST KIDNEY CANCERS HAVE LOW RESPIRATION We
emphasize that some of the labelling features used above, including glutamate positional labelling, citrate m+2/pyruvate m+3 and citrate m+4/citrate m+2, reflect the ratio of TCA cycle
turning to anaplerosis rather than the absolute TCA cycle turning rate. Reductions in these features in tumours could reflect higher anaplerosis or lower TCA cycle turning, so we sought to
examine these possibilities. Suppressed labelling of TCA cycle intermediates from [U-13C]glucose and enhanced reductive labelling from [U-13C]glutamine can result from ETC dysfunction, which
reduces TCA cycle turning22. Multiple groups have reported decreased mitochondrial DNA (mtDNA) content23,24 and reduced expression of ETC components in RCC14,25. However, these analyses did
not assess coupled respiration in mitochondria from tumours and kidneys. We measured oxygen consumption rates (OCRs) of mitochondria immediately after harvest from fresh, surgically
resected kidney and tumour tissues. We used a differential centrifugation protocol to isolate mitochondria and assess ADP-stimulated (state III) and ADP-unstimulated (state IV) respiration.
Mitochondria from both the kidney and the ccRCC had normal respiratory control ratios (defined as state III/state IV respiration) when supplied with complex I substrates, indicating that the
preparation produced mitochondria with the expected ability to stimulate respiration after the addition of ADP26 (Extended Data Fig. 6a). However, absolute state III and state IV OCRs were
low in ccRCC compared with kidney mitochondria for complexes I, II and IV (Fig. 3f and Extended Data Fig. 6b,c). To account for day-to-day variability in measuring respiration, we also
normalized OCR values from ccRCC mitochondria to patient-matched kidney mitochondria in 12 patients that provided both tissues. In these patients, the OCRs from complex I, II and IV were
always lower in mitochondria isolated from tumours (Fig. 3g). Mitochondria from other RCC subtypes displayed low state III respiration at complex I, but variable activities of other ETC
components (Fig. 3f). Chromophobe tumours and oncocytomas contain mutations in genes encoding complex I subunits2,27, and, accordingly, both had low complex I activity relative to adjacent
kidney (Fig. 3f). The respiratory control ratios of these mitochondria were also low when provided with complex I substrates (Extended Data Fig. 6d). However, absolute state III OCRs for
complex II and complex IV were variable; in mitochondria from oncocytomas, they exceeded rates from kidney mitochondria. Therefore, oncocytomas and chromophobe tumours display the expected
defects in complex I, with relative preservation of other ETC activity. METASTASES INCREASE TCA CYCLE LABELLING Patients with early-stage ccRCC have a 5-year survival rate close to 95%,
whereas patients with distant metastatic ccRCC fare much worse, with 5-year survival rates under 15% (ref. 28). How emergent metabolic properties support metastasis is a subject of intense
investigation29,30,31,32,33. Most human studies describing metabolic alterations during metastasis are based on transcriptional data rather than direct assessment of metabolism in
tumours34,35. To directly examine metabolism in metastatic ccRCC, [U-13C]glucose was infused in 10 patients undergoing metastasectomy. Metastatic tumours had higher citrate m+2/pyruvate m+3
ratios than the average citrate m+2/pyruvate m+3 ratio from primary ccRCCs in the kidney (Fig. 4a). Two patients with both a primary ccRCC and an adrenal metastasis underwent concurrent
nephrectomy and adrenalectomy, allowing both lesions to be sampled during the same infusion. Compared with the primary lesion, the metastatic adrenal tumours trended towards higher citrate
m+2/pyruvate m+3 ratios (Extended Data Fig. 7a). In patient 2, two different regions of the primary tumour were sampled, with one region having a reduced citrate m+2/pyruvate m+3 ratio
relative to the other; both of these regions had somewhat lower ratios than the metastasis (Extended Data Fig. 7a). One patient with two metastatic tumours was infused with [1,2-13C]acetate,
and these tumours also displayed elevated citrate labelling compared with primary ccRCCs (Extended Data Fig. 7b). These data indicate that circulating fuels such as glucose and acetate
generally make larger contributions to the TCA cycle in metastatic than in primary ccRCC. RNA sequencing revealed that primary and metastatic ccRCCs from our cohort expressed similar levels
of _VHL_ and genes related to hypoxia (Extended Data Fig. 7c,d). Gene expression also indicated that the primary and metastatic ccRCCs that we sampled contained similar abundances of stromal
cells, immune cells and tumour cell purity (Extended Data Fig. 7e–g), making it unlikely that non-malignant cells in the tumour microenvironment are the predominant source of 13C labelling
differences. The small size of these metastatic tumours precluded direct analysis of mitochondrial respiration. EFFICIENT METASTASIS REQUIRES COMPLEX I To examine whether oxidative
mitochondrial metabolism supports metastasis, we used somatic mosaic genetically engineered mouse models of RCC capable of spontaneous metastasis from the kidney36. These models use
kidney-specific inactivation of RCC tumour suppressor-encoding genes such as _Vhl_ and _Setd2_, with biallelic deletion of a 40-kb region of mouse chromosome 4q, which is syntenic to a
region of human chromosome 9p21 (_4q__9p21−_) that is frequently lost in human metastatic kidney cancers. This combination of mutations results in tumours that arise in the kidney and
spontaneously metastasize to the lung. Metastatic tumour burden is easily followed by TdTomato expression. Primary cell lines derived from these models can be genetically manipulated ex vivo
and reimplanted into the kidney. We implanted two cell lines derived from _Vhl__KO__;Setd2__KO_;_4q__9p21−_ renal tumours into the kidneys of NU-_Foxn1__nu_ mice, randomized the mice to
receive vehicle or the ETC complex I inhibitor IACS-010759, and followed tumour burden in the kidney and lung. In the kidney, IACS-010759 had no effect on tumour growth (Fig. 4b), but
metastasis was markedly suppressed in both lines (Fig. 4c and Extended Data Fig. 8a,b). We next used a pair of lines derived from renal _Setd2__KO__;Nf2__KO__;4q__9p21−_ tumours, one that
metastasizes frequently from the kidney (Methigh) and another that does not (Metlow). Both of these mutations are observed in human ccRCC, although less frequently than _VHL_ loss. The
frequency of _SETD2_ mutations increases in metastatic ccRCC37,38, and these models provided the appealing opportunity to study metabolic liabilities in the context of isogenic but
metastatically divergent tumours. In culture, Methigh cells respired more rapidly than Metlow cells (Extended Data Fig. 8c). A genome-wide CRISPR screen identified disparate dependencies in
Methigh and Metlow cells, with several gene sets related to mitochondria, particularly NADH dehydrogenase (ETC complex I) being among the most essential for Methigh cells in culture (Fig.
4d,e and Extended Data Fig. 8d). To assess the requirement for complex I in vivo, Methigh and Metlow cells were implanted into the kidney and treated with DMSO or IACS-010759 as described
for the _Vhl__KO_ models. Renal Methigh and Metlow tumours grew at the same rate, with or without IACS-010759 treatment (Fig. 4f and Extended Data Fig. 8e). However, IACS-010759 reduced
metastasis of Methigh tumours to levels similar to Metlow tumours (Fig. 4g and Extended Data Fig. 8f). Residual metastasis of IACS-010759-treated Methigh cells resulted in small pulmonary
tumours with low Ki67 staining (Extended Data Fig. 8g,h). These data indicate that RCC cells possessing the ability to metastasize need complex I to proliferate and form tumours in the lung,
but tolerate inhibition of complex I in the kidney. The relatively low respiration of Metlow cells allowed us to ask whether activating the ETC confers the ability to metastasize. To
address this question, we expressed the yeast mitochondrial NADH dehydrogenase NDI1 in both Methigh cells and Metlow cells (Extended Data Fig. 8i). NDI1 oxidizes NADH to NAD+ and transfers
electrons to the coenzyme Q pool, essentially replacing the functions of mammalian complex I39. Cancer cells expressing NDI1 maintain TCA cycle labelling from [U-13C]glucose in vivo even
when native complex I activity is impaired22. In cultured Metlow and Methigh cells, NDI1 enhanced respiration and increased labelling of TCA cycle intermediates from [U-13C]glucose (Extended
Data Fig. 8j–l). In vivo, NDI1 had no effect on growth of either Methigh or Metlow tumours in the kidney (Fig. 4h) and did not increase metastatic burden of Methigh tumours (Fig. 4i).
However, NDI1 was sufficient to drive metastasis of Metlow tumours to levels similar to Methigh tumours (Fig. 4i,j). To delineate how complex I supports metastasis, we expressed an NADH
oxidase from _Lactobacillus brevis_ (_Lb_NOX) localized to either the mitochondria (mito-_Lb_NOX) or cytosol (cyto-_Lb_NOX)40 (Extended Data Fig. 8m,n). Like complex I, this water-forming
enzyme regenerates NAD+ from NADH; however, unlike mammalian complex I and NDI1, the reducing equivalents are not used to reduce coenzyme Q. Therefore, _Lb_NOX separates the NAD+
regenerative function of complex I from its role in oxidative phosphorylation. Expression of _Lb_NOX in either compartment in Metlow orthotopic kidney tumours did not affect primary tumour
growth (Fig. 4k), but increased metastatic lung tumour burden (Fig. 4l and Extended Data Fig. 8o) for both mito-_Lb_NOX and cyto-_Lb_NOX. These results imply that complex I supports RCC
metastasis, at least in part, by providing a mechanism for NAD+ regeneration. We performed analogous experiments in two human ccRCC cell lines (_VHL_-deficient 786-O and _VHL_-wild-type
Caki1 cells) expressing dsRed-luciferase to allow imaging of metastatic colonization in the lung after injection of cells into the tail vein. NDI1 enhanced respiration and increased
labelling of TCA cycle intermediates from [U-13C]glucose41 (Extended Data Fig. 9a–f). These effects were more prominent 786-O cells, which had lower respiration and TCA cycle labelling
before NDI1 expression (Extended Data Fig. 9c–e). NDI1 expression did not enhance growth of subcutaneous tumours but increased lung metastases after tail-vein injection (Extended Data Fig.
9g–j). Similarly, _Lb_NOX did not increase subcutaneous growth of 786-O cells but increased metastatic burden (Extended Data Fig. 9k–n). Finally, we examined molecular features in human
ccRCC that might explain the connection between mitochondrial metabolism and metastasis. Most reported ccRCC gene expression data are from primary tumours. We performed RNA sequencing from
treatment-naive-matched kidney, primary ccRCC and metastatic ccRCC nodules from seven patients at UT Southwestern. Three of seven metastatic ccRCC nodules showed an increase in oxidative
phosphorylation (OxPhos) gene expression relative to primary ccRCC, cumulatively shown as the OxPhos score (Extended Data Fig. 10a), but all metastases showed mtDNA depletion similar to the
matched primary tumours (Extended Data Fig. 10b). We reasoned that some molecular alterations observed in metastases may exist in high-grade primary tumours before metastasis. We analysed
the TCGA ccRCC dataset (KIRC) for expression of OxPhos genes, collectively summarized as a singular OxPhos score. High grade 3 and 4 tumours had higher OxPhos scores than low grade 1 and 2
tumours (Fig. 5a). As outcomes in ccRCC are largely defined by metastasis, we reasoned that differences in OxPhos gene expression may portend shortened patient survival. We stratified high
grade 3 and 4 tumours into two groups: stage 1/2 tumours (tumours less than 7 cm confined to the kidney) and stage 3/4 tumours (tumours more than 7 cm or tumours that have metastasized;
Extended Data Fig. 10c). Patients with the top 50% of OxPhos scores were compared with patients with the bottom 50% in each subcohort. In stage 1/2 tumours, there was no substantial
difference in survival for the OxPhos high and low groups (Fig. 5b). However, in the stage 3/4 subset, high tumour OxPhos scores portended poor survival, with the OxPhos-high group having
less than half the median survival (878 days) of the OxPhos-low group (1,964 days) (Fig. 5c). Therefore, even among the highest risk patients (with grade 3/4 tumours and 3/4 staging),
expression of OxPhos genes is predictive of patient mortality. In this same TCGA cohort, it was previously reported that higher mtDNA content also correlates with poor survival23 (Fig. 5d),
even though the vast majority of genes comprising the OxPhos gene signature are in the nucleus. Together, both mtDNA abundance and expression of nuclear-encoded OxPhos genes are elevated in
aggressive primary ccRCCs with the worst outcomes. This suggests that the mitochondrial adaptation that allows ccRCCs to metastasize originates in the primary tumour. DISCUSSION We have
previously reported that ccRCCs infused with [U-13C]glucose generally have low labelling relative to the kidney1. We now demonstrated that this is an intrinsic characteristic of ccRCC
because low glucose contributions to the TCA cycle are preserved in cultured slices of ccRCC tissue, and not all tumours growing in the kidney display suppressed glucose contribution to the
TCA cycle. We also report dysfunction of multiple ETC components manifesting as reduced mitochondrial respiration. This may be related to suppressed ccRCC mtDNA copy number42, which predicts
that PDH activation would be insufficient to normalize oxidative metabolism in ccRCC. We report higher contributions of glucose to the TCA cycle in metastatic ccRCC than in primary ccRCC.
This was observed in both synchronous metastases and asynchronous metastases and in multiple metastatic sites, implying an evolution or selection of mitochondrial function during ccRCC
progression in patients. Evidence from mice indicates that the TCA cycle and OxPhos may promote multiple aspects of cancer progression. Quantitative measurement of TCA cycle flux in
orthotopic breast cancer models has reported a large increase in flux after metastasis to the lung43. In melanoma, brain metastatic formation and growth in mice are suppressed by ETC complex
I inhibition44, and expression of pathogenic mtDNA variants with diminished OxPhos decrease metastasis45. In a pancreatic ductal adenocarcinoma model, relapse is suppressed and survival is
enhanced by ETC inhibition46. In acute myelogenous leukaemia, human-derived mouse models with robust OxPhos display resistance to cytotoxic chemotherapy, and resistance is reversed by
inhibiting mitochondrial function47. In patient-derived B progenitor acute lymphoblastic leukaemia models, clones that relapse have gene expression signatures of mitochondrial metabolism and
higher mitochondrial mass than clones that do not relapse48. These findings suggest that OxPhos and other aspects of mitochondrial function underlie a program of enhanced fitness that
allows some tumour cells to survive various stresses relevant to cancer progression, including stresses related to metastasis. It is unclear whether tumour cells with variable mitochondrial
function at the primary site activate mitochondrial metabolism during metastasis or whether metastasis selects for a pre-existing population of cells with high mitochondrial metabolism.
Molecular analyses of human ccRCCs still in the kidney suggest that tumours with a higher capacity for mitochondrial metabolism (that is, higher mtDNA content and higher expression of OxPhos
genes) are most likely to result in early mortality. Although these mitochondrial alterations may occur in the primary tumour, our experiments in mice indicate that the benefits of OxPhos
are revealed only after escape from the primary tumour. Neither complex I inhibition nor expression of NDI1 or _Lb_NOX affected tumour growth in the kidney, even though all of these factors
altered metastatic burden. Because these experiments used athymic mice, the data also suggest that the effect of respiration capacity on metastasis is not primarily related to
immunogenicity. Efforts to suppress cancer progression by targeting mitochondrial metabolism would benefit from understanding both the mechanisms governing variable mitochondrial function in
human tumours and how mitochondria affect metastasis. Perhaps the most interesting and important challenge arising from this work is to determine which metabolic effects of mitochondrial
function support metastasis. Tumours with low respiration, either from their native metabolic properties or after pharmacological complex I inhibition, still metastasize, so assessing how
complex I modulation affects survival merits further examination. Our experiments with _Lb_NOX suggest that maintenance of a favourable NAD+/NADH redox balance is sufficient to support
metastasis to the lung, but further work is necessary to understand whether additional ETC functions are also required. Potent, systemic blockade of the ETC in patients has resulted in
dose-limiting toxicities49, but it may be possible to widen the therapeutic window by tailoring therapies to selectively target the most relevant aspects of mitochondrial function. METHODS
PATIENT INFUSIONS The Institutional Review Board (IRB) at the University of Texas Southwestern Medical Center monitored and approved all conducted human participant research. Study protocols
are subjected to annual continuing reviews by the IRB. All patients were recruited at the University of Texas Southwestern Medical Center. From December 2018 to August 2019, patients were
enrolled on protocol STU062010-157. From September 2019 to present, patients are enrolled on protocol STU2019-1061. Two patients were enrolled on protocol STU052012-065. Generally, patients
18 years of age or older with radiographic evidence of known or probable kidney cancer requiring surgical biopsy or excision were recruited to an IRB-approved study and informed consent was
obtained from all patients. Full eligibility and exclusion criteria, as well as recruitment procedures, are detailed in the Reporting Summary. Patients receiving [U-13C]glucose were enrolled
on protocol STU062010-157 (NCT01668082), STU2019-1061 (NCT04623502) or STU052012-065 (NCT02095808) and infused at the following rate: 8 g bolus of [U-13C]glucose administered over 10 min,
followed by a continuous infusion of [U-13C]glucose at a rate of either 4 or 8 g per hour. Patients receiving [1,2-13C]acetate were enrolled on protocol STU2019-1061 and were infused at the
following rate: a bolus of 3 mg [1,2-13C]acetate per kg body weight per minute for 5 min, followed by a continuous infusion of [1,2-13C]acetate at 1.5 mg per kg body weight per minute.
Patients receiving [U-13C]glutamine were enrolled on protocol STU2019-1061 and were infused at the following rate: a primer dose for 5 min at a rate of 0.6 mg per kg body weight per minute,
followed by a continuous infusion of 5.0 μmol per kg body weight per minute (0.73 mg per kg body weight per minute). Uncontrolled or poorly controlled diabetes and pregnancy were exclusion
criteria for the study. Demographic, clinical and pathological details are summarized in Supplementary Data Table 1. Once the specimens were removed from the body cavity, tissue samples were
acquired with the attending pathologist or pathology assistant. ANIMAL STUDIES All procedures were approved by UT Southwestern Medical Center’s Animal Care and Use Committee (protocol
2016-101360) or the University of Texas MD Anderson Cancer Center’s Animal Care and Use Committee (protocol 00001158) in accordance with the Guide for the Care and Use of Laboratory Animals.
Sample sizes were not pre-determined based on statistical power calculations but were based on our experience with these assays. All mice were given a numerical identifier, and tumour
measurements were recorded according to the numerical identifier and unblinded at the end of the study. Mouse experiments requiring pharmacological treatments were not blinded to monitor
mice for side effects. Mice were randomly allocated for injection and/or treatment. CELL LINES 786-O, Caki-1 and primary renal proximal tubule epithelial cells were purchased from the
American Type Culture Collection (ATCC; CRL-1932, HTB-46 and PCS-400-010, respectively) and were authenticated by the ATCC. HEK293FT cells were purchased from Thermo Fisher (R70007) and were
not authenticated after purchase. Metlow, Methigh, Methigh-50 and Methigh-26 were established from somatic mosaic genetically engineered mouse models (SM-GEMM) of kidney cancer36. Metlow
and Methigh cell lines were established from _Setd2__KO__;NF2__KO__;4q__9p21−_ mice, and Methigh-50 and Methigh-26 cell lines were established from _Setd2__KO__;Vhl__KO__;4q__9p21−_ mice.
The Metlow cell line originated from a SM-GEMM mouse with no metastases, and the Methigh, Methigh-50 and Methigh-26 lines originated from SM-GEMM mice with ten or more metastases. The
primary kidney tumours were dissociated with a combination of mechanical dissociation and enzymatic dissociation using a 2 mg ml−1 mixture of collagenase IV/dispase (17104-019 and 17105-041,
respectively, Invitrogen) resuspended in DMEM. Tissues were incubated for 1 h at 37 °C with trituration every 15 min. Cells were then plated on plates coated with 0.1% gelatin and cultured
in DMEM supplemented with 20% FBS and 1% penicillin–streptomycin. To confirm metastatic potential, cells were reinjected under the renal capsule of NU-_Foxn1__nu_ mice as described in the
‘Metastatic colonization experiments using mouse cell lines in mice’ section, and mice were analysed for metastatic burden after 21 days. Primary tumours with high or low metastatic burden
were dissociated and reinjected again under the renal capsule to select for differential metastatic capacity. Primary tumours that gave rise to a high number of metastatic nodules were
termed Methigh, and clones that gave rise to fewer metastases were termed Metlow. The Methigh, Methigh-50, Methigh-26 and Metlow cell lines reflected the metastatic potential of their
SM-GEMM of origin. Cells were kept in culture for five passages or less before re-implantations. All cell lines were confirmed to be mycoplasma free using a commercial kit (2523348, Bulldog
Bio). Cells were maintained in RPMI supplemented with 10% fetal bovine serum or 10% dialysed human serum and cultured at 37 °C in 5% CO2 and 95% air, unless otherwise noted. HIGH-RESOLUTION
MASS SPECTROMETRY (Q-TOF) Data acquisition from isolated mitochondria and patient tissues for metabolomics was performed by reverse-phase chromatography on a 1290 UHPLC liquid chromatography
system interfaced to a high-resolution mass spectrometry (HRMS) 6550 iFunnel Q-TOF mass spectrometer (Agilent Technologies). Frozen tissue fragments weighing 10–30 mg were added to ice-cold
80:20 methanol:water and extracted for metabolomics analysis. Samples were subjected to three freeze–thaw cycles, then centrifuged at 16,000_g_ for 20 min to precipitate macromolecules. The
supernatant was evaporated using a vacuum concentrator. Samples were resuspended in 100 μl of 0.1% formic acid in water, vortexed for 30 s and centrifuged at 16,000_g_ for 15 min.
Supernatant was transferred to an autosampler vial and then run on the mass spectrometer. The mass spectrometer was operated in both positive and negative (ESI+ and ESI−) modes. Analytes
were separated on an Acquity UPLC HSS T3 column (1.8 μm, 2.1 × 150 mm; Waters). The column was kept at room temperature. Mobile phase A composition was 0.1% formic acid in water, and mobile
phase B composition was 0.1% formic acid in 100% acetonitrile. The liquid chromatography gradient was 1% phase B (5 min), 5% phase B (10 min), 99% phase B (8 min), 99% phase B (1 min), 1%
phase B (1 min) and 1% phase B (1 min). The flow rate was 250 μl min−1. The sample injection volume was 5 μl. ESI source conditions were set as follows: dry gas temperature of 225 °C and
flow of 18 l min−1, fragmentor voltage of 175 V, sheath gas temperature of 350 °C and flow of 12 l min−1, nozzle voltage of 500 V and capillary voltage of +3,500 V in positive mode and
−3,500 V in negative mode. The instrument was set to acquire over the full _m/z_ range of 40–1,700 in both modes, with the mass spectrometer acquisition rate of 1 spectrum per second in
profile format. Raw data files (.d) were processed using Profinder B.08.00 SP3 software (Agilent Technologies) with an in-house database containing retention time and accurate mass
information from 600 standards from Mass Spectrometry Metabolite Library (IROA Technologies). The database was created under the same data acquisition conditions described above. The
in-house database matching parameters were: mass tolerance of 10 ppm and retention time tolerance of 0.5 min. Peak integration results were manually reviewed in Profinder and exported as a
spreadsheet (.csv). METABOLOMICS ANALYSIS The signal-to-noise ratio for each metabolite was calculated by dividing the median of the quality control samples by the median of the blank
samples. Following this, a run order correlation test was performed to determine the correlation between the run order and metabolite intensity for quality control samples injected at fixed
intervals, adjusting for multiple comparisons using the Benjamini–Hochberg procedure. A LOESS (locally estimated scatterplot smoothing) correction was then applied to adjust for trends in
the data that correlate with run order, which involved fitting a LOESS model to the quality control data and adjusting the sample data accordingly only if the trend in quality control
samples within the interquartile range was statistically significant. Normalization was then performed using total ion count, using a subset of stable metabolites with low coefficient of
variation and high signal-to-noise ratio to calculate a normalization factor based on their median intensities. This was used to adjust the intensity values of all metabolites in a sample.
After normalization, a log10 transformation was applied to obtain a normal distribution. In cases in which a metabolite was measured in both positive and negative modes, the measurement with
the lower signal-to-noise ratio was removed. We compared our metabolomics dataset to a previously reported ccRCC dataset14. The value of each metabolite was normalized to the minimum
observed value across the dataset. A log10 transformation was applied to the normalized values to stabilize variance and render the data more suitable for parametric analysis. Cohen’s _d_
was used to assess the differential abundance of metabolites between tumour and adjacent normal tissues. For integration and comparison with the Hakimi dataset, we standardized the
metabolite nomenclature by mapping the metabolite names to their respective Human Metabolome Database (HMDB) identifiers50. For the 152 metabolites that were common between both studies, the
Pearson correlation coefficient of the effect sizes was calculated to assess the concordance of datasets. Raw metabolomics files are available at the US National Institutes of Health Common
Fund’s National Metabolomics Data Repository website, the Metabolomics Workbench51 (https://www.metabolomicsworkbench.org/), where it has been assigned project ID PR001954. A direct link to
the data can be found in the ‘Data availability’ section. HRMS (ORBITRAP) [1,2-13C]acetate-infused tissue samples were analysed using an Orbitrap Fusion Lumos 1M Tribrid Mass Spectrometer.
HILIC chromatographic separation of metabolites was achieved using a Millipore ZIC-pHILIC column (5 μm, 2.1 × 150 mm) with a binary solvent system of 10 mM ammonium acetate in water, pH 9.8
(solvent A), and acetonitrile (solvent B) with a constant flow rate of 0.25 ml min−1. For gradient separation, the column was equilibrated with 90% solvent B. After injection, the gradient
proceeded as follows: 0–15 min of linear ramp from 90% B to 30% B; 15–18 min of isocratic flow of 30% B; 18–19 min of linear ramp from 30% B to 90% B; 19–27 column regeneration with
isocratic flow of 90% B. HRMS data were acquired with two separate acquisition methods. Individual samples were acquired with an HRMS full scan (precursor ion only) method, switching between
positive and negative polarities. For data-dependent, high-resolution tandem mass spectrometry methods, precursor ion scans were acquired at a resolving power of 120,000 full width at
half-maximum (FWHM) with a mass range of either 50–750 or 70–1,050 Da. The AGC target value was set to 1 × 10⁶ with a maximum injection time of 100 ms. Pooled samples were generated from an
equal mixture of all individual samples and analysed using individual positive-polarity and negative-polarity spectrometry data-dependent, high-resolution tandem mass spectrometry
acquisition methods for high-confidence metabolite ID. Product ion spectra were acquired at a resolving power of 15,000 FWHM without a fixed mass range. The AGC target value was set to 2 ×
105 with a maximum injection time of 150 ms. Data-dependent parameters were set to acquire the top ten ions with a dynamic exclusion of 30 s and a mass tolerance of 5 ppm. Isotope exclusion
was turned on, and a normalized collision energy value of 30% was used or a stepped normalized collision energy applied with values of 30%, 50% and 70%. Settings remained the same in both
polarities. Metabolite identities were confirmed in three ways: (1) precursor ion _m_/_z_ was matched within 5 ppm of theoretical mass predicted by the chemical formula; (2) fragment ion
spectra were matched within a 5 ppm tolerance to known metabolite fragments; and (3) the retention time of metabolites was within 5% of the retention time of a purified standard run with the
same chromatographic method. Metabolites were relatively quantitated by integrating the chromatographic peak area of the precursor ion searched within a 5 ppm tolerance. Acetyl-CoA
fractional enrichment was determined with a selected ion monitoring (SIM) scan event on an Orbitrap Fusion Lumos 1M Tribrid Mass Spectrometer. The SIM scan event targeted the theoretical
mass for the positive ion of acetyl-CoA in positive ionization mode (_m_/_z_ 810.1330) with a 4.5-Da window. Data were collected with a resolving power of 60,000 FWHM with an AGC target of 4
× 105 ions. To calculate fractional enrichment of m+2 acetyl-CoA, the SIM scan integrated the m+0, m+1 and m+2 peaks and the full-scan data to integrate the remaining naturally abundant
isotopes. Isotope enrichment was corrected for natural abundance. MASS SPECTROMETRY FOR ISOTOPOMER ANALYSIS Samples were analysed on an AB Sciex 6500 QTRAP liquid chromatography/mass
spectrometer (Applied Biosystems SCIEX) equipped with a vacuum degasser, quaternary pump, autosampler, thermostatted column compartment and triple quadrupole/ion trap mass spectrometer with
electrospray ionization interface, and controlled by AB Sciex Analyst 1.6.1 Software. SeQuant ZIC-pHILIC 5-µm polymer (150 × 2.1 mm) columns were used for separation. Solvents for the mobile
phase were 10 mM ammonium acetate aqueous (pH 9.8 adjusted with NH3•H2O (A) and pure acetonitrile (B). The gradient elution was: 0–20 min, linear gradient of 90–65% B; 20–23 min, linear
gradient of 65–30% B; 23–28 min, 30% B; and 28–30 min, linear gradient of 30–90% B, then reconditioning the column with 90% B for 5 min. The flow rate was 0.2 ml min−1 and the column was
operated at 40 °C. Glutamate isotopomers were analysed using a published method17. GAS CHROMATOGRAPHY–MASS SPECTROMETRY Gas chromatography–mass spectrometry was used to analyse infused
patient tissue and plasma samples, as well as tracing assays in cell lines and slice cultures. Blood was obtained before and approximately every 30 min during infusion, when congruent with
surgical workflow, until tissue was removed from the patient. Whole blood was chilled on ice and centrifuged (at 1,500_g_ for 15 min at 4 °C, with acceleration and deceleration rates set to
5) to separate and freeze the plasma. Aliquots (50 µl) of plasma were added to ice-cold 80:20 methanol:water for extraction. Frozen tissue fragments weighing roughly 10–30 mg were added to
ice-cold 80:20 methanol:water and extracted to analyse 13C enrichment. Samples were subjected to three freeze–thaw cycles, then centrifuged at 16,000_g_ for 20 min to precipitate
macromolecules. The supernatant was evaporated using a vacuum concentrator and resuspended in 30 μl of methoxyamine (10 mg ml−1) in pyridine. Samples were transferred to autoinjector vials
and heated at 70 °C for 15 min. A total of 70 μl of tert-butyldimethylsilyl was added, and the samples were briefly vortexed and heated for another 60 min at 70 °C. Injections of 1 μl were
analysed on an Agilent 7890A gas chromatograph coupled to an Agilent 5975C mass selective detector. The observed distributions of mass isotopologues were corrected for natural abundance52.
MTDNA:NUCLEAR DNA QUANTITATIVE PCR Genomic DNA was isolated using the DNeasy Blood & Tissue Kit (69504, Qiagen). Samples were run using the Luna Universal One-Step qPCR Kit (M3003, New
England Biolabs) on a CFX384 machine (Bio-Rad). The following primers were used for human _COX2_ as representative of mtDNA: CCGTCTGAACTATCCTGCCC (forward), (GCCGTAGTCGGTGTACTCGT (reverse).
The following primers were used for human histone 3 (_H4C3_) as representative of nuclear DNA: GGGATAACATCCAGGGCATT (forward), CCCTGACGTTTTAGGGCATA (reverse). RNA ISOLATION RNA was isolated
using TRIzol (15596018, Thermo Fisher) and an RNeasy Mini Kit (74106, Qiagen). Total RNA was quantified using a Qubit fluorometer (Invitrogen) and the Invitrogen Qubit RNA High Sensitivity
kit (Q32852, Invitrogen). Samples were diluted in ultrapure water before sequencing. _NDI1_ RT–QUANTITATIVE PCR RNA was isolated as described above and samples were run using the Luna
Universal One-Step RT–qPCR Kit (E3005, New England Biolabs) on a CFX384 machine (Bio-Rad). The following primers were used for _NDI1_: GCCGAAGAAGTCCAAATTCAC (forward), CGACAGCCGTTCTCAGAT
(reverse). The following primers were used for _ACTB_ (encoding β-actin): CTAAGGCCAACCGTGAAAAG (forward), ACCAGAGGCATACAGGGACA (reverse). RNA SEQUENCING RNA sequencing libraries were
prepared using the NEBNext Ultra II directional RNA library prep kit with the NEBNext poly(A) mRNA magnetic isolation module (E7490L and E7760L, New England Biolabs) according to
manufacturer’s instructions. Libraries were stranded using standard NEB indices according to the manufacturer’s instructions (E7730L, E7335L and E7500L, New England Biolabs). Sequencing
reads were aligned to the human reference genome (_hg19_) by STAR 2.7.3.a with default parameters in the two-pass mode. Counts for each gene were generated using htseq-count v0.6.1.
Differentially expressed genes were identified by DESeq2 v1.14.1. The ends of sequences were trimmed with remaining adapter or quality scores of less than 25. Sequences less than 35 bp after
trimming were removed. The trimmed Fastq files were aligned to GRCh38 using HiSAT2 (ref. 53) and duplicates were marked with SAMBAMBA. Features (genes, transcripts and exons) were counted
using featureCounts54. Differential expression analysis was performed using EdgeR55 and DESeq56. Raw sequencing files are deposited on the Gene Expression Omnibus (GSE251905). Extended Data
Fig. 1a compares RNA sequencing data from the TCGA cohort and this study, emphasizing genes related to the ETC and glycolysis. The Cohen’s effect size (_d_) between tumour and adjacent
kidney for each of 15,642 genes was correlated between TCGA data and data from the current cohort. ETC genes were selected from the gene ontology cellular component library, including genes
related to complexes I–IV of the ETC. The glycolysis genes include the following four gene sets: KEGG_GLYCOLYSIS_GLUCONEOGENESIS, REACTOME_GLYCOLYSIS, HALLMARK_GLYCOLYSIS and
WP_GLYCOLYSIS_AND_GLUCONEOGENESIS. ESTIMATE ANALYSIS The ESTIMATE R package57 was used to derive stromal and immune scores and a tumour purity ESTIMATE score from RNA sequencing data. OXPHOS
SCORE CALCULATION A list of OxPhos genes from the MSigDB database58 was created by combining the genes in the KEGG_OXIDATIVE_PHOSPHORYLATION gene set with the genes encoding subunits of the
PDH complex (_PDHA1_, _PDHB_, _DLAT_, _DLD_ and _PDHX_). Principal component analysis was performed on log2-transformed, mean-centred and _z_-transformed data, and the first principal
component (PC1) was extracted and used as the OxPhos score. ORGANOTYPIC SLICE CULTURES After surgery, kidney cortex and tumour fragments were embedded in 0.1% agarose (BP1356, Thermo Fisher)
and sliced into approximately 300-μM thick sections using a microtome (Compresstome, VF-300, Precisionary Instruments). These tissues were then transferred and maintained on hydrophilic
polytetrafluoroethylene cell culture inserts (PICM0RG50, Millipore) in human plasma-like medium supplemented with 10% dialysed human serum. Before tracing assays, tissues were washed twice
with 0.9% saline, and medium was replaced with human plasma-like medium without unlabelled glucose and replaced with an equivalent concentration of [U-13C]glucose for 3 h. Slices were
maintained in an incubator with 5% CO2, 5% O2 and 90% N2 at 37 °C. HUMAN SERUM DIALYSIS Human serum was purchased from Sigma-Aldrich (H3667) and dialysed using SnakeSkin dialysis tubing, 3.5
K MWCO, 35 mm (PI88244, Thermo Fisher). Serum was dialysed against a 20X volume of PBS. Dialysis was performed for 48 h at 4 °C with a complete PBS exchange every 9–12 h. Dialysed serum was
then sterile filtered using bottle-top vacuum filters with a pore size of 0.22 μm (431097, Corning). MITOCHONDRIAL ISOLATION AND RESPIRATION MEASUREMENTS OCRs were measured using a Seahorse
Xfe96 Analyzer (Agilent Technologies) as previously described59,60. Fresh kidney and tumour samples were homogenized with 40 strokes of a Dounce homogenizer in mitochondrial isolation
buffer consisting of 5 mM HEPES, 70 mM sucrose, 220 mM mannitol, 5 mM MgCl2, 10 mM KH2PO4 and 1 mM ethylene glycol-bis(β-aminoethyl ether)-_N_,_N_,_N_′,_N_′-tetraacetic acid (EGTA), pH 7.2;
H4034, S0389, M4125, 208337, P9541 and E3889, respectively, Sigma-Aldrich) and isolated via differential centrifugation at 4 °C. Nuclei and cell debris were removed by centrifuging five
times at 600_g_. Mitochondria were pelleted with a 10,000_g_ spin and washed twice. Mitochondria were quantified using a detergent compatible assay (5000112, Bio-Rad). Outer mitochondrial
membrane fidelity was tested using a proteinase K assay as previously described61. In brief, 50 μg mitochondria were incubated on ice for 10 min with proteinase K (AM2542, Thermo Fisher) at
a final concentration of 10 μg ml−1. The reaction was stopped by pelleting mitochondria and resuspending in lysis buffer (2% SDS and 25 mM Tris. pH 6.8) with 1 mM phenylmethylsulfonyl
fluoride (PMSF; 36978, Thermo Fisher) and immediately snap frozen in liquid nitrogen. Immunoblots were then run on the proteinase K-treated mitochondria as described in the ‘Immunoblotting’
section below for both an outer mitochondrial membrane protein (anti-Tom20, 1:2,000 dilution; 11802, Proteintech) and a mitochondrial matrix protein (anti-HSP60, 1:2,000 dilution; 12165S,
Cell Signaling Technology). For experiments reported in this paper, we only used respiration and tracing data from mitochondria with an intact outer mitochondrial membrane (as evidenced by
an intact, non-smeared HSP60 band after proteinase K treatment). Of mitochondria, 5 µg was plated in an Xfe96 plate on ice and centrifuged at 2,700_g_ for 2 min at 4 °C. Isolation buffer
containing ETC complex substrates was added to cells and measurements were started immediately. The following ETC complex substrates were used: complex I–pyr/mal (10 mM pyruvate and 1 mM
malate), complex I—glu/mal (10 mM glutamate and 1 mM malate), complex II (5 mM succinate and 4 μM rotenone) and complex IV (10 mM ascorbate, 100 μM TMPD and antimycin A 2 μM). At indicated
times, 4 mM ADP, 2 μM oligomycin A, 2 μM carbonyl cyanide 3-chlorophenylhydrazone (CCCP) and either 4 μM antimycin A or 40 μM sodium azide were injected. All chemicals were purchased from
Sigma-Aldrich (P2256 (pyruvate), 240176 (malate), 49621 (glutamate), S3674 (succinate), R8875 (rotenone), A4403 (ascorbate), T7394 (TMPD), A8674 (antimycin A), A5285 (adenosine diphosphate),
75351 (oligomycin A), C2759 (CCCP) and S2002 (sodium azide)). All indicated concentrations are final concentrations. Respiratory control ratios were calculated by state III/state IV
respiration. For cells expressing the pMXs-EV or pMXs-NDI1 retroviral vector, cells were plated in a 96-well plate at a concentration of 2 × 10⁴ cells per well in 80 μl RPMI-1640 media with
4 mM glutamine and 10% FBS. Cells were incubated in a CO2-free incubator at 37 °C for 1 h before Xfe96 measurements to allow temperature and pH equilibration. Seahorse assays consisted of
three mix (3 min) and measurement (3 min) cycles, allowing determination of OCR and the extracellular acidification rate every 6 min. NDI1, _LB_NOX AND DSRED LUCIFERASE EXPRESSION pMXs-EV,
pMXs-mito-_Lb_NOX and pMXs-cyto-_Lb_Nox were a gift from J. Garcia-Bermudez62. pMXs-NDI1 was a gift from D. Sabatini (plasmid 72876, AddGene)63. pMXs-EV, pMXs-NDI1, pMXs-mito-_Lb_NOX or
pMXs-cyto-_Lb_NOX was transfected into 293FT cells with gag-pol and VSVG using Lipofectamine 3000 (L3000015, Thermo Fisher) or PolyJet (SL100688, SignaGen) according to the manufacturer’s
instructions. Viral supernatants were collected 48 h after transfection and filtered through a 0.45-μm filter. Cells were cultured with virus containing media and 4 µg ml−1 polybrene
(TR-1003-G, Sigma-Aldrich) for 24 h, after which fresh medium was added. Cells were then exposed to 10 µg ml−1 blasticidin selection until uninfected cells died. A bi-cistronic lentiviral
construct carrying dsRed2 and luciferase (dsRed2-P2A-Luc) was a gift from S.J. Morrison. dsRed2-P2A-Luc with pMD2G and psPAX2 were transfected into 293FT cells using Polyjet (SL100688,
SignaGen) according to the manufacturer’s instructions. Viral supernatants were collected 48 h after transfection and filtered through a 0.45-μm filter. Cells with either pMXs-EV, pMXs-NDI1,
pMXs-cyto-_Lb_NOX or pMXs-mito-_Lb_NOX were cultured with virus containing media and 4 µg ml−1 polybrene (TR1003, Sigma-Aldrich) for 8 h, after which the medium was changed to fresh medium.
The top 10% of live cells expressing dsRed were sorted using fluorescence-activated cell sorting (FACS). 786-O and Caki-1 cells expressing dsRed were trypsinized and filtered through a
40-μm cell strainer to obtain a single-cell suspension and stained with 4′,6-diamidino-2-phenylindole (DAPI; 62248, Thermo Fisher). Cells were gated to exclude dead cells, cell debris and
doublets based on FSC/SSC, then gated on live cells (DAPI-negative cells). The top 10% of dsRed-positive cells were sorted, collected and used for experiments. Example FACS plots
exemplifying the gating strategy are provided in Supplementary Fig. 2. Data were analysed using BD FACSDiva 8.0 and FlowJo V10. IMMUNOFLUORESCENCE AND CONFOCAL MICROSCOPY Coverslips were
coated with 10 µg ml−1 fibronectin (F1141, Sigma-Aldrich) for 1 h at 37 °C and rinsed once with PBS. Cells were immediately seeded on the coverslips and fixed the next day with fresh warm 4%
paraformaldehyde solution in PBS for 15 min followed by permeabilization using 0.1% (v/v) Triton X-100 in PBS at room temperature for 10 min. Cells were blocked in filtered PBS containing
1% BSA for at least 30 min at room temperature before incubation with primary antibodies to FLAG (1:200 dilution; F1804, Sigma-Aldrich) and HSP60 (1:500 dilution; 12165S, Cell Signaling
Technology) for 1 h at room temperature. Cells were washed three times for 5 min with PBS and incubated with fluorophore conjugated secondary antibodies (1:500 dilutions; 111-545-144,
Jackson ImmunoResearch Laboratories and A31570, Thermo Fisher) for 1 h at room temperature in the dark. Coverslips were washed with PBS three times for 5 min and Mili-Q water once before
being mounted on Profade-Antifade (P36935, Invitrogen) slides overnight in the dark. Cells were imagined using a Zeiss LSM 880 confocal laser scanning microscope with Z-stacks acquired. All
representative images were processed using ImageJ. KI67 STAINING After removal of tumour-bearing organs, tissues were fixed in 10% formalin, sectioned and stained for Ki67-positive nuclei
(1:500 dilution; MA5-14520, Thermo Fisher). Slides were imaged using an inverted Zeiss LSM780 confocal microscope. Ki67-positive nuclei were quantified using ImageJ. IMMUNOBLOTTING Cells
were lysed in RIPA buffer (BP-115, Boston BioProducts) containing protease and phosphatase inhibitors (78444, Thermo Fisher), then centrifuged at 4 °C for 10 min at approximately 20,160_g_.
Supernatants were transferred to new pre-chilled 1.5-ml tubes, and protein concentrations were quantified using a BCA Assay Kit (23225, Thermo Fisher). Protein lysates were resolved via
SDS–PAGE and transferred to PVDF membranes. Membranes were blocked in 5% BSA in Tris buffered saline with Tween-20 (TBST; 20 mM Tris (pH 7.5), 150 mM NaCl and 0.1% Tween-20) and then
incubated with primary antibody (anti-FLAG M2, 1:2,000 dilution; F1804, Sigma-Aldrich) in TBST supplemented with 5% BSA at 4 °C overnight. The primary antibody was detected with a
horseradish peroxidase-conjugated secondary antibody (1:2,000 dilution; 7076S, Cell Signaling Technology) for 1 h followed by exposure to ECL reagents (PI32106, Fisher Scientific). After
imaging, membranes were stripped with Restore Striping Buffer (21059, Thermo Fisher), washed with TBST three times and blocked with 5% BSA in TBST for 1 h. Membranes were then incubated with
primary antibody (β-actin, 1:2,000 dilution; 8457S, Cell Signaling Technology) in TBST supplemented with 5% BSA at 4 °C overnight. The primary antibody was detected with a horseradish
peroxidase-conjugated secondary antibody (1:2,000 dilution; 7074S, Cell Signaling Technology) for 1 h followed by exposure to ECL reagents (PI32106, Thermo Fisher). [U-13C]GLUCOSE TRACING IN
CELL LINES [U-13C]glucose tracing data from non-small-cell lung cancer cell lines were previously reported41. Similar assay conditions described below were used for tracing experiments in
this study. Before tracing experiments, cells expressing either empty vector or NDI1 were washed twice with 0.9% saline, and medium was replaced with RPMI-1640 containing [U-13C]glucose
supplemented with 5% dialysed FBS for 6 h. Cells were rinsed in ice-cold 0.9% saline and lysed with three freeze–thaw cycles in ice-cold 80% methanol. Samples were then prepared for gas
chromatography–mass spectrometry analysis. SUBCUTANEOUS IMPLANTATION OF HUMAN CELL LINES IN MICE Cell suspensions were prepared for injection in a 1:1 mixture of Matrigel (354234, Corning)
to staining medium (Leibovitz’s L15 medium (21083027, Thermo Fisher), 1 mg ml−1 BSA (A2153, Sigma-Aldrich), 1% penicillin–streptomycin (P0781, Sigma-Aldrich) and 10 mM HEPES (pH 7.4)).
Subcutaneous injections were performed in NOD.CB17-_Prkdc__scid_ _Il2rg__tm1Wjl_/SzJ (NSG) mice in a final volume of 100 μl. Four-to-eight-week-old male and female NSG mice were transplanted
with 1,000,000 cells subcutaneously in the right flank. Both male and female mice were used. For all subcutaneous experiments, the maximum permitted tumour diameter was 2.0 cm, which was
not exceeded in any experiment. METASTATIC COLONIZATION EXPERIMENTS USING HUMAN CELL LINES IN MICE Cell suspensions were prepared for injection in staining medium described above. Tail-vein
injections were performed in NOD.CB17-_Prkdc__scid__Il2rg__tm1Wjl_/SzJ (NSG) mice in a final volume of 50 μl. Four-to-eight-week-old male and female NSG mice were transplanted with 250,000
cells. Both male and female mice were used. Metastatic burden was assessed weekly by bioluminescence. Five minutes before performing luminescence imaging, mice were injected
intraperitoneally with 100 μl of PBS containing 40 mg ml−1 d-luciferin monopotassium salt (L8220, Biosynth) and mice were anaesthetized with isoflurane 2 min before imaging. The mice were
imaged using an IVIS Imaging System 200 Series (Caliper Life Sciences) or an Ami HTX (Spectral Instruments Imaging). The exposure time ranged from 10 to 60 s, depending on the maximum signal
intensity, with the 60-s timepoint used for greater range only if the 30-s timepoint was not saturated. The bioluminescence signal (total photon flux) was quantified with ‘region of
interest’ measurement tools in Living Image software (Perkin Elmer) or Aura Imaging software (Spectral Instruments Imaging). The maximal tumour burden was defined as a bioluminescent signal
saturated after 30 s, which was not exceeded during any experiment. METASTATIC COLONIZATION EXPERIMENTS USING MOUSE CELL LINES IN MICE Maximal tumour burden was not exceeded according to the
IRB guidelines. For orthotopic tumours, mice were euthanized 21 days after implantation or after they developed symptoms of distress. Both male and female mice were used. Mice were kept in
a 12-h light–12-h dark cycle as commonly used, and housed at 18–23 °C with humidity of 50–60%. To establish orthotopic tumours, 10,000 cells were resuspended in a 2:1 solution of OPTI-MEM
(31985062, Gibco) and Matrigel (354234, Corning). Six-to-nine-week-old NU-_Foxn1__nu_ (Jackson Laboratories) mice were anaesthetized using isoflurane. Buprenorphine slow release (0.1 mg kg−1
two times daily) was subcutaneously injected, and shaved skin was disinfected with 70% ethanol and betadine (1425, Dynarex). A 1-cm incision was performed on the left flank through the
skin/subcutaneous and muscular/peritoneal layers. The left kidney was exposed and 20 μl of the cell suspension was injected under the kidney capsule. The kidney was repositioned into the
abdominal cavity, and muscular/peritoneal planes were closed individually by absorbable sutures. The skin/subcutaneous planes were closed using metal clips. Mice were monitored daily for the
entire duration of the experiment. Twenty-one days after orthotopic kidney implantation, mice were imaged for primary tumour burden in the kidney and metastatic tumour burden in the lungs.
A 7T Bruker Biospec (BrukerBioSpin), equipped with a 35-mm inner-diameter volume coil and 12-cm inner-diameter gradients, was used for MRI. A fast acquisition with relaxation enhancement
sequence with 2,000/39-ms TR/TE (repetition time/echo time), 256 × 192 matrix size, r156-µM resolution, 0.75-mm slice thickness, 0.25-mm slice gap, 40 × 30-cm2 field of view, 101-kHz
bandwidth and 4 number of excitation was used to acquire multislice T2-weighted images in coronal and axial planes. At end point, mice were euthanized by exposure to carbon dioxide followed
by cervical dislocation. A necropsy form was filled in with mouse information, tumour size, and metastasis location and number. Fluorescent and brightfield images were acquired through a
Leica MZ12s stereo microscope. TdTomato-positive lesions were quantified using LAS v4.13 software (Leica Microsystems). IACS-010759 TREATMENT Mice were allowed to recover from implantation
surgery. The following day, mice were treated with either 100 μl of vehicle or IACS-010759 (S8731, Selleckchem) dissolved in vehicle via oral gavage on a 5-day on, 2-day off schedule. The
vehicle was composed of 5% DMSO, 40% PEG300, 5% Tween-80, and 50% ddH2O. IACS-010759 was dosed at 5 mg kg−1. Mice were euthanized after 21 days in accordance with IRB guidelines. CRISPR
SCREENING IN METHIGH AND METLOW CELLS Lentiviral particles of the mouse genome-wide CRISPR library (mTKOv3) were generated by the University of Michigan Biomedical Research Lentiviral Core
and concentrated 100×. Cells were transduced with the mouse genome-wide CRISPR library in 500-cm2 square dishes with 8 μg ml−1 polybrene at a multiplicity of infection of 0.3 and an
estimated 400× coverage. The medium was replaced 24 h after infection, and puromycin selection started at 48 h. At 72 h, cells were trypsinized, pooled and counted. As a reference, 30 × 106
cells were immediately collected. Every passage of 15 × 106 cells (approximately 200× coverage) was maintained in culture until the end point (20 doublings) when 30 × 106 cells
(approximately 400× coverage) were collected. Cell pellets were suspended in 2 ml of buffer P1/RNAse A and lysed by adding 1/20 volume of 10% SDS. Genomic DNA was sheared by passing the
lysate 10–15 times through a 22-gauge syringe needle after 10 min. One volume of phenol:chloroform:isoamyl alcohol (25:24:1) was added to the lysate, and the samples were centrifugated at
17,000_g_ for 10 min, and the upper phase was transferred to a new tube. The second extraction step was done with chloroform:isoamyl alcohol (24:1), and the upper phase was transferred to a
new tube and mixed with 0.1 volumes of 3 M NaCl and 0.8 volumes of 2-propanol to precipitate genomic DNA. Samples were centrifuged at 17,000_g_ for 20 min at 4 °C, and the DNA pellet was
washed in 70% ethanol and centrifuged for 5 min at 17,000_g_ at 4 °C. The DNA pellet was then dried and resuspended overnight in UltraPure distilled water. The genomic DNAs were quantified
using a NanoDrop 2000 (Thermo Fisher). For the generation of next-generation sequencing libraries, barcodes were amplified in two rounds of PCR using the Titanium Taq DNA polymerase (639208,
Clontech-Takara). The first PCRs contained 10 µg of genomic DNA per PCR, and the total reactions resulted in targeted amplification from one-third of the total genomic DNA. The first 16
cycles targeted PCR amplification and utilized the following primer set: mTKOv3-PCR1-F: ATTAGTACAAAATACGTGACGTAGAA (forward) and mTKOv3-PCR1-R: ACCTTCTCTAGGCACCGGATCA (reverse). The second
PCRs were performed for 14 cycles using the following primers with adapters optimized to introduce the specific adapters for Illumina next-generation sequencing technology specific for the
Hiseq4000: mTKO-P2: AATGATACGGCGACCACCGAGATCTACACGAGATCGGACTATCATATGCTTACCGTAACTTGAA (forward) and mTKO-P7##-IND:
CAAGCAGAAGACGGCATACGAGATGCACGACGAGACGCAGACGAAnnnnnAGAGCAACTTCTCGGGGACTGTGGGCGA. Amplified PCR products from two replicates of the second PCR were pooled together and extracted from the
agarose gel with the QIAquick gel extraction kit (28704, Qiagen). Samples were quantified using Qubit 2.0 DNA HS Assay (Q32851, Thermo Fisher), QuantStudio 5 System (Applied Biosystems) and
Tapestation High Sensitivity D1000 Assay (5067-5582, Agilent Technologies). Six samples were pooled equilmolar to be run on a Nextseq 500 high-output 75-bp SR with 10% PhiX. Custom primers
were required for read 1 (20 nt): mTKO-Seq-26bp TCTTGGCTTTATATATCTTGTGGAAAGGACGAAACACCG; and to obtain the sample index, read 2 (6 nt): mTKO-Seq-Index-7 AGATGCACGACGAGACGCAGACGAA. CRISPR
SCREEN ANALYSIS Bowtie63 was used to obtain raw read-counts with 1 mismatch allowance, thus taking the best-matching single guide RNA per read. Bayesian Analysis of Gene EssentiaLity 2
(BAGEL2) software64 was then used to calculate normalized read counts, and log2 fold change was obtained by comparing the reference timepoint of the corresponding cell line. Next, genes were
determined as vulnerabilities by applying the standard BAGEL2 pipeline and excluding core-essential genes. The top 500 gene vulnerabilities ranked by BAGEL score were used as an input for
enrichment pathway analysis using the WEB-based GEne SeT AnaLysis Toolkit (WebGestalt)65,66. The following parameters were used for WebGestalt: minimum number of genes per category = 5;
maximum number of genes per category = 2,000; and test performed = Benjamini–Hochberg. STATISTICAL ANALYSIS AND REPRODUCIBILITY Samples were analysed as described in the figure legends. Data
were considered significant if _P_ < 0.05. No statistical methods were used to predetermine sample size. For randomization and blinding details, please see the Reporting Summary. Most
experiments were not randomized because they did not have an intervention that required randomization. Statistics were calculated using Graphpad Prism v9.0.1 software or RStudio 4.0.2 unless
described otherwise in the Methods; statistical details can be found in the legends for each figure. The box for all box and whisker plots represent the 25th to 75th percentiles for minima
and maxima, the line in the middle of the box represents the median, and the whiskers represent minimum and maximum values. Adobe Illustrator v26.3.1 was used to create the schematics and
figures. REPORTING SUMMARY Further information on research design is available in the Nature Portfolio Reporting Summary linked to this article. DATA AVAILABILITY The Human Metabolome
Database can be accessed at https://hmdb.ca/. The mSigDB database can be accessed at https://www.gsea-msigdb.org/gsea/msigdb/. Supplementary table 3 from Hakimi et al.14 has the metabolomics
data associated with their publication and can be downloaded from: https://www.ncbi.nlm.nih.gov/pmc/articles/PMC4809063/#SD2. Supplementary table 1 from Chen et al.41 was used for NSCLC
cell line labelling data and can be found at: https://www.ncbi.nlm.nih.gov/pmc/articles/PMC6898782/. TCGA KIRC data can be accessed at https://portal.gdc.cancer.gov/projects/TCGA-KIRC. No
original code was reported in this paper. Clinical information, analysed RNA sequencing data and isotopologue data are included as supplementary tables. Raw sequencing files are deposited on
the Gene Expression Omnibus (GSE251905). Raw metabolomics files are available at the NIH Common Fund’s National Metabolomics Data Repository website, the Metabolomics Workbench
(https://www.metabolomicsworkbench.org), where it has been assigned project ID PR001954. The data can be accessed directly via its project (https://doi.org/10.21228/M84X6Q)67. Restrictions
are in place in accordance with the IRB for providing patient samples. All other requests should be directed to the corresponding author (R.J.D.). Source data are provided with this paper.
REFERENCES * Courtney, K. D. et al. Isotope tracing of human clear cell renal cell carcinomas demonstrates suppressed glucose oxidation in vivo. _Cell Metab._ 28, 793–800.e2 (2018). Article
CAS PubMed PubMed Central Google Scholar * Davis, C. F. et al. The somatic genomic landscape of chromophobe renal cell carcinoma. _Cancer Cell_ 26, 319–330 (2014). Article CAS PubMed
PubMed Central Google Scholar * Ricketts, C. J. et al. The Cancer Genome Atlas comprehensive molecular characterization of renal cell carcinoma. _Cell Rep._ 23, 313–326.e5 (2018).
Article CAS PubMed PubMed Central Google Scholar * Linehan, W. M. et al. Comprehensive molecular characterization of papillary renal-cell carcinoma. _N. Engl. J. Med._ 374, 135–145
(2016). Article PubMed Google Scholar * Ivan, M. et al. HIFα targeted for VHL-mediated destruction by proline hydroxylation: implications for O2 sensing. _Science_ 292, 464–468 (2001).
Article ADS CAS PubMed Google Scholar * Iliopoulos, O., Levy, A. P., Jiang, C., Kaelin, W. G. Jr & Goldberg, M. A. Negative regulation of hypoxia-inducible genes by the von
Hippel–Lindau protein. _Proc. Natl Acad. Sci. USA_ 93, 10595–10599 (1996). Article ADS CAS PubMed PubMed Central Google Scholar * Hu, C.-J., Wang, L.-Y., Chodosh, L. A., Keith, B.
& Simon, M. C. Differential roles of hypoxia-inducible factor 1alpha (HIF-1α) and HIF-2α in hypoxic gene regulation. _Mol. Cell. Biol._ 23, 9361–9374 (2003). Article CAS PubMed PubMed
Central Google Scholar * Papandreou, I., Cairns, R. A., Fontana, L., Lim, A. L. & Denko, N. C. HIF-1 mediates adaptation to hypoxia by actively downregulating mitochondrial oxygen
consumption. _Cell Metab._ 3, 187–197 (2006). Article CAS PubMed Google Scholar * Mayr, J. A. et al. Loss of complex I due to mitochondrial DNA mutations in renal oncocytoma. _Clin.
Cancer Res._ 14, 2270–2275 (2008). Article CAS PubMed Google Scholar * Gasparre, G. et al. Clonal expansion of mutated mitochondrial DNA is associated with tumor formation and complex I
deficiency in the benign renal oncocytoma. _Hum. Mol. Genet._ 17, 986–995 (2008). Article CAS PubMed Google Scholar * Merino, M. J., Torres-Cabala, C., Pinto, P. & Linehan, W. M. The
morphologic spectrum of kidney tumors in hereditary leiomyomatosis and renal cell carcinoma (HLRCC) syndrome. _Am. J. Surg. Pathol._ 31, 1578–1585 (2007). Article PubMed Google Scholar *
Williamson, S. R. et al. Succinate dehydrogenase-deficient renal cell carcinoma: detailed characterization of 11 tumors defining a unique subtype of renal cell carcinoma. _Mod. Pathol._ 28,
80–94 (2015). Article CAS PubMed Google Scholar * Hensley, C. T. et al. Metabolic heterogeneity in human lung tumors. _Cell_ 164, 681–694 (2016). Article CAS PubMed PubMed Central
Google Scholar * Hakimi, A. A. et al. An integrated metabolic atlas of clear cell renal cell carcinoma. _Cancer Cell_ 29, 104–116 (2016). Article CAS PubMed PubMed Central Google
Scholar * Cantor, J. R. et al. Physiologic medium rewires cellular metabolism and reveals uric acid as an endogenous inhibitor of UMP synthase. _Cell_ 169, 258–272.e17 (2017). Article CAS
PubMed PubMed Central Google Scholar * Malloy, C. R., Sherry, A. D. & Jeffrey, F. M. Carbon flux through citric acid cycle pathways in perfused heart by 13C NMR spectroscopy. _FEBS
Lett._ 212, 58–62 (1987). Article CAS PubMed Google Scholar * Cai, F. et al. Comprehensive isotopomer analysis of glutamate and aspartate in small tissue samples. _Cell Metab._ 35,
1830–1843.e5 (2023). Article CAS PubMed PubMed Central Google Scholar * Reinfeld, B. I. et al. Cell-programmed nutrient partitioning in the tumour microenvironment. _Nature_ 593,
282–288 (2021). Article ADS CAS PubMed PubMed Central Google Scholar * Kaushik, A. K. et al. In vivo characterization of glutamine metabolism identifies therapeutic targets in clear
cell renal cell carcinoma. _Sci. Adv._ 8, eabp8293 (2022). Article CAS PubMed PubMed Central Google Scholar * Mullen, A. R. et al. Reductive carboxylation supports growth in tumour
cells with defective mitochondria. _Nature_ 481, 385–388 (2011). Article ADS PubMed PubMed Central Google Scholar * Metallo, C. M. et al. Reductive glutamine metabolism by IDH1 mediates
lipogenesis under hypoxia. _Nature_ 481, 380–384 (2011). Article ADS PubMed PubMed Central Google Scholar * Pachnis, P. et al. In vivo isotope tracing reveals a requirement for the
electron transport chain in glucose and glutamine metabolism by tumors. _Sci. Adv._ 8, eabn9550 (2022). Article CAS PubMed PubMed Central Google Scholar * Reznik, E. et al.
Mitochondrial DNA copy number variation across human cancers. _eLife_ 5, e10769 (2016). Article PubMed PubMed Central Google Scholar * Nilsson, H. et al. Primary clear cell renal
carcinoma cells display minimal mitochondrial respiratory capacity resulting in pronounced sensitivity to glycolytic inhibition by 3-bromopyruvate. _Cell Death Dis._ 6, e1585 (2015). Article
CAS PubMed PubMed Central Google Scholar * The Cancer Genome Atlas Research Network. Comprehensive molecular characterization of clear cell renal cell carcinoma. _Nature_ 499, 43–49
(2013). Article ADS PubMed Central Google Scholar * Brand, M. D. & Nicholls, D. G. Assessing mitochondrial dysfunction in cells. _Biochem. J._ 435, 297–312 (2011). Article CAS
PubMed Google Scholar * Joshi, S. et al. The genomic landscape of renal oncocytoma identifies a metabolic barrier to tumorigenesis. _Cell Rep._ 13, 1895–1908 (2015). Article CAS PubMed
PubMed Central Google Scholar * _Cancer Facts & Figures 2022_ (American Cancer Society, 2022). * LeBleu, V. S. et al. PGC-1α mediates mitochondrial biogenesis and oxidative
phosphorylation in cancer cells to promote metastasis. _Nat. Cell Biol._ 16, 992–1003 (2014). Article CAS PubMed PubMed Central Google Scholar * Piskounova, E. et al. Oxidative stress
inhibits distant metastasis by human melanoma cells. _Nature_ 527, 186–191 (2015). Article ADS CAS PubMed PubMed Central Google Scholar * Rossi, M. et al. PHGDH heterogeneity
potentiates cancer cell dissemination and metastasis. _Nature_ 605, 747–753 (2022). Article ADS CAS PubMed PubMed Central Google Scholar * Christen, S. et al. Breast cancer-derived
lung metastases show increased pyruvate carboxylase-dependent anaplerosis. _Cell Rep._ 17, 837–848 (2016). Article CAS PubMed Google Scholar * Basnet, H. et al. Flura-seq identifies
organ-specific metabolic adaptations during early metastatic colonization. _eLife_ 8, e43627 (2019). Article PubMed PubMed Central Google Scholar * Gaude, E. & Frezza, C.
Tissue-specific and convergent metabolic transformation of cancer correlates with metastatic potential and patient survival. _Nat. Commun._ 7, 13041 (2016). Article ADS CAS PubMed PubMed
Central Google Scholar * Davis, R. T. et al. Transcriptional diversity and bioenergetic shift in human breast cancer metastasis revealed by single-cell RNA sequencing. _Nat. Cell Biol._
22, 310–320 (2020). Article CAS PubMed Google Scholar * Perelli, L. et al. Interferon signaling promotes tolerance to chromosomal instability during metastatic evolution in renal cancer.
_Nat. Cancer_ 4, 984–1000 (2023). Article CAS PubMed PubMed Central Google Scholar * Hakimi, A. A. et al. Adverse outcomes in clear cell renal cell carcinoma with mutations of 3p21
epigenetic regulators BAP1 and SETD2: a report by MSKCC and the KIRC TCGA research network. _Clin. Cancer Res._ 19, 3259–3267 (2013). Article CAS PubMed PubMed Central Google Scholar *
Turajlic, S. et al. Tracking cancer evolution reveals constrained routes to metastases: TRACERx Renal. _Cell_ 173, 581–594.e12 (2018). Article CAS PubMed PubMed Central Google Scholar *
Seo, B. B. et al. Molecular remedy of complex I defects: rotenone-insensitive internal NADH-quinone oxidoreductase of _Saccharomyces cerevisiae_ mitochondria restores the NADH oxidase
activity of complex I-deficient mammalian cells. _Proc. Natl Acad. Sci. USA_ 95, 9167–9171 (1998). Article ADS CAS PubMed PubMed Central Google Scholar * Titov, D. V. et al.
Complementation of mitochondrial electron transport chain by manipulation of the NAD+/NADH ratio. _Science_ 352, 231–235 (2016). Article ADS CAS PubMed PubMed Central Google Scholar *
Chen, P.-H. et al. Metabolic diversity in human non-small cell lung cancer cells. _Mol. Cell_ 76, 838–851.e5 (2019). Article CAS PubMed PubMed Central Google Scholar * Reznik, E., Wang,
Q., La, K., Schultz, N. & Sander, C. Mitochondrial respiratory gene expression is suppressed in many cancers. _eLife_ 6, e21592 (2017). Article PubMed PubMed Central Google Scholar
* Bartman, C. R. et al. Slow TCA flux and ATP production in primary solid tumours but not metastases. _Nature_ https://doi.org/10.1038/s41586-022-05661-6 (2023). * Fischer, G. M. et al.
Molecular profiling reveals unique immune and metabolic features of melanoma brain metastases. _Cancer Discov._ 9, 628–645 (2019). Article CAS PubMed PubMed Central Google Scholar *
Shelton, S. D. et al. Pathogenic mitochondrial DNA mutations inhibit melanoma metastasis. Preprint at _bioRxiv_ https://doi.org/10.1101/2023.09.01.555986 (2023). * Viale, A. et al. Oncogene
ablation-resistant pancreatic cancer cells depend on mitochondrial function. _Nature_ 514, 628–632 (2014). Article ADS CAS PubMed PubMed Central Google Scholar * Farge, T. et al.
Chemotherapy-resistant human acute myeloid leukemia cells are not enriched for leukemic stem cells but require oxidative metabolism. _Cancer Discov._ 7, 716–735 (2017). Article CAS PubMed
PubMed Central Google Scholar * Dobson, S. M. et al. Relapse-fated latent diagnosis subclones in acute B lineage leukemia are drug tolerant and possess distinct metabolic programs.
_Cancer Discov._ 10, 568–587 (2020). Article CAS PubMed PubMed Central Google Scholar * Yap, T. A. et al. Complex I inhibitor of oxidative phosphorylation in advanced solid tumors and
acute myeloid leukemia: phase I trials. _Nat. Med._ 29, 115–126 (2023). Article CAS PubMed Google Scholar * Wishart, D. S. et al. HMDB 5.0: the Human Metabolome Database for 2022.
_Nucleic Acids Res._ 50, D622–D631 (2022). Article CAS PubMed Google Scholar * Sud, M. et al. Metabolomics Workbench: an international repository for metabolomics data and metadata,
metabolite standards, protocols, tutorials and training, and analysis tools. _Nucleic Acids Res._ 44, D463–D470 (2016). Article CAS PubMed Google Scholar * Fernandez, C. A., Des Rosiers,
C., Previs, S. F., David, F. & Brunengraber, H. Correction of 13C mass isotopomer distributions for natural stable isotope abundance. _J. Mass Spectrom._ 31, 255–262 (1996). Article
ADS CAS PubMed Google Scholar * Kim, D., Paggi, J. M., Park, C., Bennett, C. & Salzberg, S. L. Graph-based genome alignment and genotyping with HISAT2 and HISAT-genotype. _Nat.
Biotechnol._ 37, 907–915 (2019). Article CAS PubMed PubMed Central Google Scholar * Liao, Y., Smyth, G. K. & Shi, W. featureCounts: an efficient general purpose program for
assigning sequence reads to genomic features. _Bioinformatics_ 30, 923–930 (2014). Article CAS PubMed Google Scholar * Robinson, M. D., McCarthy, D. J. & Smyth, G. K. edgeR: a
Bioconductor package for differential expression analysis of digital gene expression data. _Bioinformatics_ 26, 139–140 (2010). Article CAS PubMed Google Scholar * Anders, S. &
Huber, W. Differential expression analysis for sequence count data. _Genome Biol._ 11, R106 (2010). Article CAS PubMed PubMed Central Google Scholar * Yoshihara, K. et al. Inferring
tumour purity and stromal and immune cell admixture from expression data. _Nat. Commun._ 4, 2612 (2013). Article ADS PubMed Google Scholar * Liberzon, A. et al. Molecular Signatures
Database (MSigDB) 3.0. _Bioinformatics_ 27, 1739–1740 (2011). Article CAS PubMed PubMed Central Google Scholar * Rogers, G. W. et al. High throughput microplate respiratory measurements
using minimal quantities of isolated mitochondria. _PLoS ONE_ 6, e21746 (2011). Article ADS CAS PubMed PubMed Central Google Scholar * Lesner, N. P. et al. Differential requirements
for mitochondrial electron transport chain components in the adult murine liver. _eLife_ 11, e80919 (2022). Article CAS PubMed PubMed Central Google Scholar * Mishra, P., Carelli, V.,
Manfredi, G. & Chan, D. C. Proteolytic cleavage of Opa1 stimulates mitochondrial inner membrane fusion and couples fusion to oxidative phosphorylation. _Cell Metab._ 19, 630–641 (2014).
Article CAS PubMed PubMed Central Google Scholar * Garcia-Bermudez, J. et al. Adaptive stimulation of macropinocytosis overcomes aspartate limitation in cancer cells under hypoxia.
_Nat. Metab._ 4, 724–738 (2022). Article CAS PubMed PubMed Central Google Scholar * Birsoy, K. et al. Metabolic determinants of cancer cell sensitivity to glucose limitation and
biguanides. _Nature_ 508, 108–112 (2014). Article ADS CAS PubMed PubMed Central Google Scholar * Kim, E. & Hart, T. Improved analysis of CRISPR fitness screens and reduced
off-target effects with the BAGEL2 gene essentiality classifier. _Genome Med._ 13, 2 (2021). Article CAS PubMed PubMed Central Google Scholar * Zhang, B., Kirov, S. & Snoddy, J.
WebGestalt: an integrated system for exploring gene sets in various biological contexts. _Nucleic Acids Res._ 33, W741–W748 (2005). Article CAS PubMed PubMed Central Google Scholar *
Liao, Y., Wang, J., Jaehnig, E. J., Shi, Z. & Zhang, B. WebGestalt 2019: gene set analysis toolkit with revamped UIs and APIs. _Nucleic Acids Res._ 47, W199–W205 (2019). Article CAS
PubMed PubMed Central Google Scholar * Bezwada, D. et al. PR001954. _Molecular Workbench_ https://doi.org/10.21228/M84X6Q (2022). Download references ACKNOWLEDGEMENTS We are grateful to
G. Guevara for his efforts on this project; K. Kernstine and B. Faubert for infusing patients with lung metastases; E. Reznik for help with mtDNA TCGA survival data; and A. Jaffe for
critiquing the manuscript. R.J.D. is supported by the Howard Hughes Medical Institute (HHMI) Investigator Program, grants from the US National Institutes of Health (NIH) (R35CA220449,
P50CA196516 and UL1TR003163) and the Cancer Prevention and Research Institute of Texas (RP180778), by the Moody Foundation (Robert L. Moody Sr. Faculty Scholar Award) and by Jerry and Emy
Lou Baldridge. D.B. was supported by grants from the NIH (F31CA239330, T32GM008203 and TL1TR001104). N.P.L. was supported by grants from the NIH (F31DK122676). S.Kelekar was supported by
grants from the NIH (F30CA254150). K.D.C. and K.P. are supported by P50CA196516. I.P. was supported by grants from the NIH (R01CA154475, U01CA207091 and P50CA196516). J.G.B. was supported by
grants from the NIH (R00CA248838). Resources from P30CA142543 and P41EB015908, including shared resources in tissue management and small animal imaging, were used to support this study.
This work is supported by the Metabolomics Workbench/National Metabolomics Data Repository (U2C-DK119886), the Common Fund Data Ecosystem (3OT2OD030544) and the Metabolomics Consortium
Coordinating Center (1U2C-DK119889). The content of this manuscript is solely the responsibility of the authors and does not necessarily represent the official views of the NIH. This article
is subject to HHMI’s Open Access to Publications policy. HHMI laboratory heads have previously granted a non-exclusive CC BY 4.0 license to the public and a sublicensable license to HHMI in
their research articles. Pursuant to those licenses, the author-accepted manuscript of this article can be made freely available under a CC BY4.0 license immediately upon publication.
AUTHOR INFORMATION AUTHORS AND AFFILIATIONS * Children’s Medical Center Research Institute, University of Texas Southwestern Medical Center, Dallas, TX, USA Divya Bezwada, Nicholas P.
Lesner, Ling Cai, Bailey Brooks, Zheng Wu, Hieu S. Vu, Varun Sondhi, Daniel L. Cassidy, Stacy Kasitinon, Sherwin Kelekar, Feng Cai, Arin B. Aurora, McKenzie Patrick, Ashley Leach, Yuanyuan
Zhang, Duyen Do, Phyllis McDaniel, Jessica Sudderth, Dennis Dumesnil, Sara House, Tracy Rosales, Alan M. Poole, Prashant Mishra, Javier Garcia-Bermudez & Ralph J. DeBerardinis *
Department of Genitourinary Medical Oncology, University of Texas MD Anderson Cancer Center, Houston, TX, USA Luigi Perelli & Giannicola Genovese * Quantitative Biomedical Research
Center, University of Texas Southwestern Medical Center, Dallas, TX, USA Ling Cai * Department of Urology, University of Texas Southwestern Medical Center, Dallas, TX, USA Rashed Ghandour,
Yair Lotan, Solomon Woldu, Aditya Bagrodia, Xiaosong Meng, Jeffrey A. Cadeddu, Ivan Pedrosa, Payal Kapur & Vitaly Margulis * Department of Pediatrics, University of Texas Southwestern
Medical Center, Dallas, TX, USA Alan M. Poole, Prashant Mishra & Ralph J. DeBerardinis * Department of Radiology, University of Texas Southwestern Medical Center, Dallas, TX, USA Ivan
Pedrosa & Craig R. Malloy * Kidney Cancer Program, University of Texas Southwestern Medical Center, Dallas, TX, USA Ivan Pedrosa, Payal Kapur & Kevin D. Courtney * Department of
Pathology, University of Texas Southwestern Medical Center, Dallas, TX, USA Payal Kapur * Department of Internal Medicine, University of Texas Southwestern Medical Center, Dallas, TX, USA
Kevin D. Courtney & Craig R. Malloy * Advanced Imaging Research Center, University of Texas Southwestern Medical Center, Dallas, TX, USA Craig R. Malloy * Howard Hughes Medical
Institute, University of Texas Southwestern Medical Center, Dallas, TX, USA Ralph J. DeBerardinis Authors * Divya Bezwada View author publications You can also search for this author
inPubMed Google Scholar * Luigi Perelli View author publications You can also search for this author inPubMed Google Scholar * Nicholas P. Lesner View author publications You can also search
for this author inPubMed Google Scholar * Ling Cai View author publications You can also search for this author inPubMed Google Scholar * Bailey Brooks View author publications You can also
search for this author inPubMed Google Scholar * Zheng Wu View author publications You can also search for this author inPubMed Google Scholar * Hieu S. Vu View author publications You can
also search for this author inPubMed Google Scholar * Varun Sondhi View author publications You can also search for this author inPubMed Google Scholar * Daniel L. Cassidy View author
publications You can also search for this author inPubMed Google Scholar * Stacy Kasitinon View author publications You can also search for this author inPubMed Google Scholar * Sherwin
Kelekar View author publications You can also search for this author inPubMed Google Scholar * Feng Cai View author publications You can also search for this author inPubMed Google Scholar *
Arin B. Aurora View author publications You can also search for this author inPubMed Google Scholar * McKenzie Patrick View author publications You can also search for this author inPubMed
Google Scholar * Ashley Leach View author publications You can also search for this author inPubMed Google Scholar * Rashed Ghandour View author publications You can also search for this
author inPubMed Google Scholar * Yuanyuan Zhang View author publications You can also search for this author inPubMed Google Scholar * Duyen Do View author publications You can also search
for this author inPubMed Google Scholar * Phyllis McDaniel View author publications You can also search for this author inPubMed Google Scholar * Jessica Sudderth View author publications
You can also search for this author inPubMed Google Scholar * Dennis Dumesnil View author publications You can also search for this author inPubMed Google Scholar * Sara House View author
publications You can also search for this author inPubMed Google Scholar * Tracy Rosales View author publications You can also search for this author inPubMed Google Scholar * Alan M. Poole
View author publications You can also search for this author inPubMed Google Scholar * Yair Lotan View author publications You can also search for this author inPubMed Google Scholar *
Solomon Woldu View author publications You can also search for this author inPubMed Google Scholar * Aditya Bagrodia View author publications You can also search for this author inPubMed
Google Scholar * Xiaosong Meng View author publications You can also search for this author inPubMed Google Scholar * Jeffrey A. Cadeddu View author publications You can also search for this
author inPubMed Google Scholar * Prashant Mishra View author publications You can also search for this author inPubMed Google Scholar * Javier Garcia-Bermudez View author publications You
can also search for this author inPubMed Google Scholar * Ivan Pedrosa View author publications You can also search for this author inPubMed Google Scholar * Payal Kapur View author
publications You can also search for this author inPubMed Google Scholar * Kevin D. Courtney View author publications You can also search for this author inPubMed Google Scholar * Craig R.
Malloy View author publications You can also search for this author inPubMed Google Scholar * Giannicola Genovese View author publications You can also search for this author inPubMed Google
Scholar * Vitaly Margulis View author publications You can also search for this author inPubMed Google Scholar * Ralph J. DeBerardinis View author publications You can also search for this
author inPubMed Google Scholar CONTRIBUTIONS D.B. and R.J.D. conceptualized the project, designed and interpreted the experiments, and wrote the manuscript. The project was supervised by
D.B., R.J.D. and V.M. All bioinformatic analyses, unless otherwise noted, were performed by L.C. with assistance and supervision by D.B. Patient mitochondria were collected and isolated by
D.B. and N.P.L. Most patient mitochondria Seahorse assays were performed by N.P.L. Seahorse instrumentation and Seahorse assay guidance were provided by P. Mishra. Organotypic cultures and
isolated mitochondria tracing were done by D.B. Mass spectrometry data were analysed by D.B., B.B., H.S.V. and F.C. with assistance from D.Do, J.S. and M.P. Sample preparation for RNA
sequencing and mass spectrometry was mostly done by D.B. with assistance from B.B., V.S., S.Kasitinon, S.Kelekar, M.P., Y.Z., D.Dumesnil and T.R. Mouse experiments, including tumour
implantations, monitoring and imaging, were performed by D.B., L.P., B.B., D.L.C., A.B.A. and A.L. The mouse cell lines reported in the paper were created by L.P. and G.G., who also
performed and analysed the CRISPR screen. Z.W. performed immunofluorescence and the Seahorse assays of cells in vitro. Immunoblots were done by D.B. Cells expressing NDI1 or _Lb_NOX
constructs were created by D.B. and J.G.-B. RNA sequencing libraries were prepared by D.B. with assistance from S.Kasitinon. S.H. ran the mtDNA–nuclear DNA quantitative PCR. Patient samples,
including both tissue and plasma, were collected by D.B. with assistance from R.G., P. McDaniel and X.M. Surgery was performed by R.G., Y.L., S.W., A.B., X.M., J.A.C. and V.M. Patient
recruitment and trial compliance was overseen by V.M. and K.D.C. P.K. reviewed haematoxylin and eosin slides for all patients and tissue sections. I.P. reviewed patient imaging. C.R.M.
provided guidance on isotopic data interpretation. Funding was obtained by R.J.D. All authors reviewed the manuscript. CORRESPONDING AUTHOR Correspondence to Ralph J. DeBerardinis. ETHICS
DECLARATIONS COMPETING INTERESTS R.J.D. is a founder and advisor at Atavistik Bio, and serves on the Scientific Advisory Boards of Agios Pharmaceuticals, Vida Ventures and Droia Ventures.
I.P. has served on Scientific Advisory Boards of Health Tech International, Merck and Otsuka, and is co-inventor of patents with Philips Healthcare. K.D.C. participated on an Advisory Board
for Novartis. G.G. serves on the Advisory Board of Medendi. PEER REVIEW PEER REVIEW INFORMATION _Nature_ thanks Christian Frezza, Joshua Rabinowitz, W. Kimryn Rathmell and the other,
anonymous, reviewer(s) for their contribution to the peer review of this work. ADDITIONAL INFORMATION PUBLISHER’S NOTE Springer Nature remains neutral with regard to jurisdictional claims in
published maps and institutional affiliations. EXTENDED DATA FIGURES AND TABLES EXTENDED DATA FIG. 1 CLINICAL COHORT REFLECTS HETEROGENOUS CCRCC BIOLOGY. Plasma m+6 glucose enrichment from
patients infused with [U-13C]glucose separated by (A) kidney cancer subtype or (B) continuous infusion rate. The number of patients per group is indicated on the graph. (C) Correlation of
RNA sequencing data from the TCGA KIRC cohort reporting ccRCC tumours versus ccRCC tumours infused with [U-13C]glucose reported in this study. Data are plotted as the effect size (Cohen’s d)
reflecting the increase (d > 0) or decrease (d < 0) in mRNA abundance in tumours relative to adjacent kidney. Genes involved in glycolysis and the electron transport chain (ETC) are
highlighted. (D) Matched citrate m+2/pyruvate m+3 ratio from patients infused with [U-13C]glucose. The x-axis indicates 28 patients in whom both tumour and kidney tissue were available.
Patients in whom the average citrate m+2/pyruvate m+3 ratio was higher in ccRCC tissue are highlighted in grey boxes; this difference reached statistical significance only in patient 28. (E)
Total labeling relative to plasma glucose m+6 and (F) plasma pyruvate m+3 for TCA cycle metabolites. (48 patients for adjacent kidney, 37 patients for ccRCC.) (G) Fractional enrichment in
m+1 TCA cycle isotopologues. (48 patients for adjacent kidney, 37 patients for ccRCC.) (H) Enrichment in glycolytic and TCA cycle intermediates associated with glucose oxidation for ccRCC
and papillary tumours. Labelling is normalized to the matched adjacent kidney (28 ccRCC patients, 9 papillary RCC patients). (I) Total malate labeling (1-[m+0]) from [U-13C]glucose in
patients or tissue slices after 3 h of labeling (48 patients for adjacent kidney, 37 patients for ccRCC, 6 patients for adjacent kidney and ccRCC slices). All data represent mean ± standard
deviation. Statistical significance was assessed using one way analysis of variance (ANOVA) with a multiple comparison adjustment using Tukey’s methods, (A) or two-sided unpaired t-tests (B,
D-I). A Benjamini-Hochberg’s multiple comparison adjustment was made for D-I. Significant _P_ values are indicated or ns = not significant (_P_ > 0.05) on panels (A, B, E-I). ns = not
significant (_P_ > 0.05), *_P_ < 0.05, **_P_ < 0.01. Adj Kid = adjacent kidney, ccRCC = clear cell renal cell carcinoma, Pap = papillary renal cell carcinoma, Chromo = chromophone
renal cell carcinoma, Onco = oncocytoma, FH def. RCC = FH deficient renal cell carcinoma. Gluc = glucose, 3PG = 3-phosphoglycerate, Lac = lactate, Pyr = pyruvate, Cit = citrate, Suc =
succinate, Mal = malate, Glu = glutamate, Asp = aspartate. Source Data EXTENDED DATA FIG. 2 MRNA ABUNDANCE OF ETC AND GLYCOLYSIS GENES IN PRIMARY CCRCC TUMOURS. (A) mRNA abundance for genes
related to glycolysis and the electron transport chain (ETC) in the TCGA KIRC cohort and the cohort infused with [U-13C]glucose in this study. The ETC genes were selected from the gene
ontology cellular component (cc) library combining complex I-IV genes. The glycolysis genes are shared genes among the following four gene sets: KEGG_GLYCOLYSIS_GLUCONEOGENESIS,
REACTOME_GLYCOLYSIS, HALLMARK_GLYCOLYSIS, WP_GLYCOLYSIS_AND_GLUCONEOGENESIS. Source Data EXTENDED DATA FIG. 3 CONSISTENCY OF METABOLOMICS DATA BETWEEN THIS COHORT AND A PUBLISHED COHORT FROM
A DIFFERENT CENTER. (A) Correlation of metabolomics data from a published cohort with metabolomics from this study. Data are plotted as the effect size (Cohen’s d) reflecting the increase
(d > 0) or decrease (d < 0) in metabolite abundance in ccRCC tumours relative to the adjacent kidney. Source Data EXTENDED DATA FIG. 4 GLUTAMATE ENRICHMENT IN [1,2-13C]ACETATE-INFUSED
PATIENTS. (A) Total labeling (1-[m+0]) of glutamate from ccRCC patients infused with [1,2-13C]acetate (18 fragments from 5 patients for adjacent kidney, 81 fragments from 12 ccRCC patients).
(B) Fractional enrichment of glutamate m+2 from ccRCC patients infused with [1,2-13C]acetate (15 fragments from 5 patients for adjacent kidney, 32 fragments from 12 ccRCC patients). All
panels show mean ± standard deviations. Statistical significance was assessed using two-sided unpaired t-tests (A,B). Significant _P_ values are indicated on figure panels. ns = not
significant (_P_ > 0.05). Adj Kid = adjacent kidney, ccRCC = clear cell renal cell carcinoma. Source Data EXTENDED DATA FIG. 5 METABOLITE LABELING IN PLASMA AND TISSUES OF PATIENTS
INFUSED WITH [U-13C]GLUTAMINE. (A) Citrate isotopologue distributions in [U-13C]glutamine-infused tissues (21 fragments from 7 patients for adjacent kidney, 54 fragments from 7 patients for
ccRCC). (B) Fractional abundance of citrate m+5 in plasma at the time of resection and in ccRCC tumour tissue samples (Plasma samples from 7 patients, 54 ccRCC tissue samples from 7
patients). (C) Malate isotopologue distributions in [U-13C]glutamine-infused tissues (21 fragments from 7 patients for adjacent kidney, 54 fragments from 7 patients for ccRCC). All data
reflect mean ± standard deviations. The mean is indicated in panel B. Statistical significance was assessed using unpaired t-tests with a Benjamini-Hochberg’s multiple comparison adjustment
(A-C). Significant _P_ values are indicated on figure panels. ns = not significant (_P_ > 0.05). ccRCC = clear cell renal cell carcinoma. Source Data EXTENDED DATA FIG. 6 RESPIRATION OF
MITOCHONDRIA FROM PRIMARY HUMAN KIDNEY CANCERS. (A) Respiratory control ratio (RCR) for mitochondria from the adjacent kidney and ccRCCs. RCR is the ratio of the State III ADP-stimulated
oxygen consumption rate (OCR) to the State IV basal OCR. (49 adjacent kidney replicates from 12 patients, 17 ccRCC replicates from 5 patients). (B) State III ADP-stimulated OCR from
mitochondria isolated from primary human tissues, using glutamate and malate to stimulate complex I. (91 replicates from 21 patients for adjacent kidney, 74 replicates from 21 patients for
ccRCC, 21 replicates from 3 patients for chromophobe RCC, 16 replicates from 3 patients from oncocytoma, and 16 replicates from 3 patients for papillary RCC). (C) State IV basal OCR from
mitochondria isolated from primary human tissues. Injected substrates are indicated under each complex. (92 replicates from 21 patients for adjacent kidney, 74 replicates from 21 patients
for ccRCC, 21 replicates from 3 patients for chromophobe RCC, 16 replicates from 3 patients from oncocytoma, and 16 replicates from 3 patients for papillary RCC). (D) Respiratory control
ratio (RCR) for chromophobe RCCs and oncocytomas (52 adjacent kidney samples from 12 patients, 16 oncocytoma samples from 3 patients, 16 chromophobe samples from 3 patients). Panels A-C show
mean ± 95% confidence intervals, and panel D shows mean ± standard deviation. Statistical significance was assessed using an unpaired two-sided parametric t-test with a Benjamini-Hochberg’s
multiple comparison adjustment (A) or one way analysis of variance (ANOVA) with a multiple comparison adjustment using Tukey’s methods (B-D). Significant _P_ values are indicated on figure
panels. ns = not significant (_P_ > 0.05). pyr = pyruvate, mal = malate, glu = glutamate, asc = ascorbate, TMPD = N,N,N,N-tetramethyl-p-phenylenediamine. Source Data EXTENDED DATA FIG. 7
METABOLIC AND MOLECULAR CHARACTERISTICS OF PRIMARY AND METASTATIC CCRCCS. (A) Citrate m+2/pyruvate m+3 ratio from two patients infused with [U-13C]glucose who had a primary ccRCC and
synchronous metastasis to the adrenal gland removed during the same infusion and surgery. (B) Total citrate labeling (1-[m+0]) from a patient infused with [1,2-13C]acetate who had ccRCC
metastases at two organ sites. (15 fragments from 5 patients for adjacent kidney, 33 fragments from 12 patients for ccRCC, 6 fragments from two metastases from 1 patient). (C) Scaled
expression of genes in the HALLMARK_HYPOXIA gene set from the adjacent kidney (44 patients), primary ccRCC (25 patients), and metastatic ccRCC tumours (15 patients). (D) Log2(CPM) expression
of _VHL_ in the adjacent kidney (44 patients), primary ccRCC (25 patients), and metastatic ccRCC tumours (15 patients). (E) Estimation of STromal and Immune cells in MAlignant Tumour
tissues using Expression data (ESTIMATE) estimation of immune and (F) stromal infiltrate and (G) tumour cell purity (ESTIMATE score) in primary and metastatic ccRCC tumours from RNA
sequencing data. (22 patients for primary tumours, 15 patients for metastatic tumours). Statistical significance was assessed with a one-way analysis of variance (ANOVA) with a multiple
comparison adjustment using Tukey’s methods (A, D) or an unpaired two-sided parametric t-test (B, E-G). Significant _P_ values are indicated on figure panels. ns = not significant (_P_ >
0.05). Adj Kid = adjacent kidney, ccRCC = clear cell renal cell carcinoma, CPM = counts per million. Source Data EXTENDED DATA FIG. 8 ETC COMPLEX I DRIVES SPONTANEOUS METASTASIS OF RENAL
CELL CARCINOMA IN MICE. (A) and (B) Representative images of metastasis-bearing lungs from vehicle and IACS-010759-treated mice. (C) Oxygen consumption rate (OCR) of Metlow and Methigh
cells. 12 replicates per cell line. (D) BAGEL scores for Methigh and Metlow cell proliferation CRISPR screen. Mitochondrially associated genes are indicated in red (n = 102, 25 for Metlow,
77 for Methigh), and all other genes are indicated in black (n = 17,975). Genes selectively essential for Metlow proliferation are in the top left quadrant, and genes selectively essential
for Methigh proliferation are in the bottom right quadrant. (E) Representative images of orthotopic Methigh tumour-bearing kidneys treated with vehicle or IACS-010759. (F) Representative
images of Methigh metastasis-bearing lungs treated with vehicle or IACS-010759. (G) Number of cells with Ki67-positive nuclei per high powered field (HPF). Data are from 5 HPF per mouse (5
mice per group, total 25 quantified fields per group). (H) Representative Ki67 staining of Methigh lung metastases treated with vehicle or IACS-010759 from panel G. Red arrows indicate
Ki67-positive nuclei. (I) RT-qPCR of _NDI1_ expression in Metlow and Methigh cells. 3 replicates per group; control values were normalized to 1. (J) OCR of Metlow and (K) Methigh cells
expressing EV or NDI1. 30 replicates for Methigh EV, 32 replicates for Methigh NDI1, 8 replicates for Metlow EV, 11 replicates for Metlow NDI1. (L) Total citrate labeling of Metlow and
Methigh cells expressing EV or NDI1. 3 replicates per group. (M) Anti-FLAG western blot of Metlow cells expressing EV or FLAG-tagged cyto-_Lb_NOX or mito-_Lb_NOX. For gel source data, see
Supplementary Fig. 1. Immunoblots were repeated two additional times with similar results. (N) Representative immunofluorescence imaging of HSP60 (for mitochondria), FLAG (for _Lb_NOX), and
merged images of HSP60 and FLAG for Metlow cyto-_Lb_NOX and mito-_Lb_NOX cells. Representative images were taken from ten images that showed similar results. (O) Representative images of
Metlow metastasis-bearing lungs expressing EV, cyto-_Lb_NOX, or mito-_Lb_NOX. Statistical significance was assessed using unpaired two-sided t-tests (G, I, L). Original images for are
provided in Supplementary Data (A, B, E, F, N, O). Panels C, J, and K, show mean ± standard error of the mean (S.E.M.), and panels H, I, and L show mean ± standard deviations. Significant
_P_ values are indicated on figure panels. ns = not significant (_P_ > 0.05). EV = empty vector, cyto = cytosol, mito = mitochondria, OA = oligomycin, CCCP = carbonyl cyanide
3-chlorophenylhydrazone, R = rotenone. Source Data EXTENDED DATA FIG. 9 ETC COMPLEX I DRIVES METASTATIC COLONIZATION OF HUMAN CCRCC CELL LINES IN MICE. (A) RT-qPCR of _NDI1_ expression in
786-O and Caki-1 cells. 3 replicates per group; control values were normalized to 1. (B) OCR of 786-O and Caki-1 cells expressing EV or NDI1. 6 replicates for 786-O EV and NDI1, 8 replicates
for Caki-1 EV and NDI1. (C) OCR of renal proximal tubule epithelial cells (RPTEC) and 786-O and Caki-1 cells. 12 replicates for RPTEC, 8 replicates for 786-O, 8 replicates for Caki-1. (D)
Total citrate labeling of 786-O or (E) Caki-1 cells expressing EV or NDI1. 6 replicates for 786-O cells expressing EV or NDI1, 3 replicates for Caki-1 expressing EV or NDI1. (F) Total
citrate labeling (1-[m+0]) from cells cultured with [U-13C]glucose for 6 h in RPMI with 5% dialyzed FBS. Labelling from non-small cell lung cancer (NSCLC) cell lines was previously
published41. 786-O data points reflect the average of 6 replicates and Caki-1 data points reflect the average of 3 replicates. (G) Metastatic burden in mice assessed with bioluminescence six
weeks after tail vein injection of 786-O or (H) Caki-1 cells expressing EV or NDI1. 10 mice for 786-O EV, 7 mice for 786-O NDI1, 9 mice for Caki-1 EV, 10 mice for Caki-1 NDI1. Mice were
excluded if signal was limited to the tail (3 mice for 786-O NDI1, 1 mouse for Caki1-EV). (I) Subcutaneous tumour volume of 786-O or (J) Caki-1 cells expressing EV or NDI1. 10 mice for 786-O
EV, 9 mice for 786-O NDI1, 9 mice for Caki-1 EV, 9 mice for Caki-1 NDI1. Mice were excluded if euthanasia was required prior to endpoint or if mice died unexpectedly (1 per group for 786-O
NDI1, Caki-1 EV, Caki-1 NDI1). (K) Representative immunofluorescence imaging of HSP60 (for mitochondria), FLAG (for _Lb_NOX), and merged images of HSP60 and FLAG for 786-O cyto-_Lb_NOX and
mito-_Lb_NOX cells. Representative images were taken from ten images that showed similar results. Original images are in Supplementary Data. (L) Anti-FLAG western blot of 786-O cells
expressing EV or FLAG-tagged cyto-_Lb_NOX or mito-_Lb_NOX. For gel source data, see Supplementary Fig. 1. Immunoblots were repeated two additional times with similar results. (M)
Subcutaneous tumour volume of 786-O cells expressing EV, cyto-_Lb_NOX, or mito-_Lb_NOX. 10 mice per group. (N) Metastatic burden in mice assessed with bioluminescence after tail vein
injection with 786-O cells expressing EV, cyto-_Lb_NOX, or mito-_Lb_NOX. 10 mice per group. Panels A, D, E, G, H, and N show mean ± standard deviations and panels B and C show mean ±
standard error of the mean (S.E.M.). The NSCLC mean is indicated on panel F. Statistical significance was assessed using unpaired two-sided t-tests (A, D, E, G, H, N). Significant _P_ values
are indicated on figure panels. EV = empty vector, cyto = cytosol, mito = mitochondria, OA = oligomycin, CCCP = carbonyl cyanide 3-chlorophenylhydrazone, R = rotenone. Source Data EXTENDED
DATA FIG. 10 INCREASED MITOCHONDRIAL GENE SIGNATURES IN PRIMARY HUMAN CCRCC ARE ASSOCIATED WITH WORSE SURVIVAL. (A) OxPhos score from 7 matched ccRCC patients. OxPhos score calculations are
described in the Methods. (B) mtDNA:nDNA ratio from adjacent kidney (AK), primary ccRCC (P), and metastastic ccRCC (M) from 7 patients. (C) Expression of genes in the OxPhos gene set used to
calculate the OxPhos score. Samples are ordered according to the OxPhos score (highest to lowest). Statistical significance was assessed using one-way analysis of variance (ANOVA) with a
multiple comparison adjustment using Tukey’s methods (B). Significant _P_ values are indicated on figure panels. ns = not significant (_P_ > 0.05). Adj kid = adjacent kidney, ccRCC =
clear cell renal cell carcinoma. Source Data SUPPLEMENTARY INFORMATION SUPPLEMENTARY FIGURES Supplementary Fig. 1 contains the uncropped Western blots from Extended Data Figs 8m and 9l and
Supplementary Fig. 2 shows the FACS plots exemplifying the gating strategy used to sort dsRed positive cells. REPORTING SUMMARY SUPPLEMENTARY TABLE 1 Clinical information of
13C-nutrient-infused patients. SUPPLEMENTARY TABLE 2 RNA sequencing for indicated patient tissues. Gene expression is shown as log2(counts per million (CPM)). Genes with 0 values for more
than 75% of samples were removed. SUPPLEMENTARY TABLE 3 Metabolomics of patient tissues SUPPLEMENTARY TABLE 4 Isotopologue data from [U-13C]glucose-infused patients: 4.1 contains
isotopologue data from [U-13C]glucose-infused patient tissues; 4.2 contains isotopologue data from [U-13C]glucose-infused patient plasma and 4.3 contains plasma glucose m+6 at time of tissue
resection. SUPPLEMENTARY TABLE 5 Isotopologue data from [1,2-13C]acetate-infused patient tissues. SUPPLEMENTARY TABLE 6 Isotopologue data from [U-13C]glutamine-infused patients. Table 6.1
contains isotopologue data from [U-13C]glutamine-infused patient tissues. Table 6.2 contains isotopologue data from [U-13C]glutamine-infused patient plasma. SUPPLEMENTARY DATA Source data
for all images: a zipped file divided into three folders for original source data images for Ki67 images, mouse images, and immunofluorescence images. Subfolders are labeled with the
corresponding Figure number in which the image appears. SOURCE DATA SOURCE DATA FIG. 1 SOURCE DATA FIG. 2 SOURCE DATA FIG. 3 SOURCE DATA FIG. 4 SOURCE DATA FIG. 5 SOURCE DATA EXTENDED DATA
FIG. 1 SOURCE DATA EXTENDED DATA FIG. 2 SOURCE DATA EXTENDED DATA FIG. 3 SOURCE DATA EXTENDED DATA FIG. 4 SOURCE DATA EXTENDED DATA FIG. 5 SOURCE DATA EXTENDED DATA FIG. 6 SOURCE DATA
EXTENDED DATA FIG. 7 SOURCE DATA EXTENDED DATA FIG. 8 SOURCE DATA EXTENDED DATA FIG. 9 SOURCE DATA EXTENDED DATA FIG. 10 RIGHTS AND PERMISSIONS OPEN ACCESS This article is licensed under a
Creative Commons Attribution 4.0 International License, which permits use, sharing, adaptation, distribution and reproduction in any medium or format, as long as you give appropriate credit
to the original author(s) and the source, provide a link to the Creative Commons licence, and indicate if changes were made. The images or other third party material in this article are
included in the article’s Creative Commons licence, unless indicated otherwise in a credit line to the material. If material is not included in the article’s Creative Commons licence and
your intended use is not permitted by statutory regulation or exceeds the permitted use, you will need to obtain permission directly from the copyright holder. To view a copy of this
licence, visit http://creativecommons.org/licenses/by/4.0/. Reprints and permissions ABOUT THIS ARTICLE CITE THIS ARTICLE Bezwada, D., Perelli, L., Lesner, N.P. _et al._ Mitochondrial
complex I promotes kidney cancer metastasis. _Nature_ 633, 923–931 (2024). https://doi.org/10.1038/s41586-024-07812-3 Download citation * Received: 05 February 2023 * Accepted: 11 July 2024
* Published: 14 August 2024 * Issue Date: 26 September 2024 * DOI: https://doi.org/10.1038/s41586-024-07812-3 SHARE THIS ARTICLE Anyone you share the following link with will be able to read
this content: Get shareable link Sorry, a shareable link is not currently available for this article. Copy to clipboard Provided by the Springer Nature SharedIt content-sharing initiative