Play all audios:
ABSTRACT In the Arctic, the spatiotemporal variation of net methane uptake in upland soils depends on unresolved interactive controls between edaphic and microbial factors not yet included
in current models, underpinning the uncertainty of upscaling the Arctic methane budget. Here we show that upland soils in Greenland are consistent methane sinks (−1.83 ± 0.19 nmol methane
g−1 dw d−1) across a N-S (64–83 °N) pedoclimatic transect. We demonstrate that methane oxidizers abundance, soil pH, and available soil copper are important controls on the spatial variation
in methane oxidation. We revised a soil biogeochemical model with a high-resolution land classification and meteorological data for Greenland and tested it against our methane uptake
measurements. The model simulated well the magnitudes of observed methane uptake but not the spatial variation across all sites. This work provides novel insights into the controls of
methane uptake, which are critical for the accuracy of methane budgets. SIMILAR CONTENT BEING VIEWED BY OTHERS EMERGING MULTISCALE INSIGHTS ON MICROBIAL CARBON USE EFFICIENCY IN THE LAND
CARBON CYCLE Article Open access 13 September 2024 METHANE TRAPPING IN PERMAFROST SOILS: A BIOGEOCHEMICAL DATASET ACROSS ALASKAN BOREAL-ARCTIC GRADIENT Article Open access 20 January 2025
EVIDENCE FOR LARGE MICROBIAL-MEDIATED LOSSES OF SOIL CARBON UNDER ANTHROPOGENIC WARMING Article 15 June 2021 INTRODUCTION Determining the balance between the oxidation of atmospheric methane
(CH4) and CH4 production from Arctic ecosystems is critical for constraining the natural contribution to the global atmospheric CH4 budget. Currently, the Arctic is considered a net source
of CH4 (15–50 Tg CH4 year−1)1 with the largest biogenic contribution coming from organic carbon-rich and water-saturated soils. These ecosystems cover only 13% of the Arctic landscape2, but
their high CH4 emissions have raised concern on their positive feedback on the climate at present and future warming scenario. Hence, while a large portion of research has focused on these
ecosystems3, the CH4 dynamics in mineral upland soils have been overlooked in the context of the Arctic net CH4 budget. A number of field4,5,6,7,8 and laboratory studies8,9,10, instead, have
demonstrated that Arctic upland mineral soils are strong sinks for atmospheric CH4. These ecosystems, covering about 87% of the Arctic2 are likely to play an important, yet unquantified
role in determining the net Arctic CH4 budget. In line with this empirical evidence, a recent model study11 demonstrated that the activity of atmospheric methane-oxidising bacteria (MOB;
methanotrophs), ubiquitous in well-aerated upland soils9,10,12,13, mitigates a large portion (6.2–9.5 Tg CH4 year−1)11 of the current and projected increase in CH4 emissions from Arctic
wetlands. The importance of soil net CH4 uptake is poorly constrained, but it is widely recognised that soil temperature, soil moisture, and substrate availability (CH4 and O2) are the main
controls of the temporal variations of observed4,5 and predicted1,2,11,14 net CH4 fluxes. Only a few studies have focused on the spatial variations of net CH4 uptake in Arctic soils, and the
interactive effects of soil biogeochemical and microbial community drivers are not yet identified nor included in the current models11. The soil CH4 uptake is determined by the abundance
and potential (maximal) cell-specific activities of MOB, and in turn, these are regulated by the interaction with several abiotic parameters, which vary over time and space across different
pedoclimatic regions. Among others, soil pH exerts a strong control on microbial community composition15,16. Recent studies have highlighted how pH shapes the methanotrophic community
composition and its distribution17,18,19 at low and high pH. Low soil pH is also linked to an increase in the concentration of available soil copper (Cu), which is an essential
micro-nutrient for most organisms (especially aerobes)20. In addition, available Cu has a key regulatory function of the methane monooxygenase (MMO) enzyme, which catalyzes the first step of
the CH4 oxidative reaction21,22. Although different enzymes can take part in the bacterial oxidation of methane, the available literature suggests that the Cu-containing particulate MMO
(pMMO) is the most important one in terms of biogeochemical methane cycling21,22. Hence, almost all aerobic methanotrophs possess the pMMO enzyme, and expression of genes encoding other
enzymes (notably soluble MMO) is often repressed in these bacteria21,22. Consequently, in this study, we targeted the _pmoA_ gene encoding for the pMMO enzyme and used it as a proxy for the
presence and abundance of aerobic CH4 oxidizers, which are considered the dominant group for soil CH4 oxidation. Pure culture studies have demonstrated how MOB’s growth rate and carbon
conversion efficiencies are promoted by the expression of pMMO, which in turn is regulated by available Cu22,23. However, to date, the links between the natural concentrations of available
Cu, soil pH, and the presence and activity of MOB have not yet been reported. Hence, it is unclear if these factors also significantly contribute to determining the spatial variation of soil
CH4 uptake, alongside soil moisture, soil temperature, and soil diffusive properties. Specifically, there is a need to address in more detail the following key questions: which soil biotic
and abiotic parameters markedly influence the spatial variation of soil CH4 uptake in dry upland soils across different pedoclimatic regions? How are the spatial variation in soil pH and
available soil Cu related to the distribution and activity of MOB? To address these questions, during the month of July, we visited 11 upland sites covering a latitudinal transect
(64°N–83°N) along the coast of West and North Greenland. These areas are classified24 as well-aerated barren soils or soils with scattered presence of dwarf shrubs and are representative of
_ca_. 78% of the ice-free area of Greenland24, or _ca_. 1.5% of the total soil areal extension of the northern circumpolar permafrost region (17.8 × 10⁶ km2)2. At each site, we collected
nine intact soil cores (100 cm3) from the top (0–5 cm depth) and stored them at 5 °C until further analyses. During laboratory incubations, we measured net soil CH4 uptake rates at
atmospheric level (~2 ppm CH4 by volume). Subsequently, we analysed the soil edaphic properties and the abundances and diversities of both the methanotrophic and the total bacterial soil
communities. A structural equation model (SEM) was used to explore relationships between edaphic and biotic factors and their interactive effects on net CH4 uptake rates. Finally, we
compared the net CH4 uptake rates measured in this study to the estimates extrapolated from a revised version of the XPTEM-XHAM biogeochemical model11. As data on the natural distribution of
available Cu, soil pH and MOB abundance are not yet available to be implemented into the current model, we tested whether the XPTEM-XHAM model11 revised with a high-resolution land surface
classification24 and meteorological data from MAR v3.8 could simulate CH4 oxidation rates for Greenland consistent to our measured observations. RESULTS AND DISCUSSION EDAPHIC AND
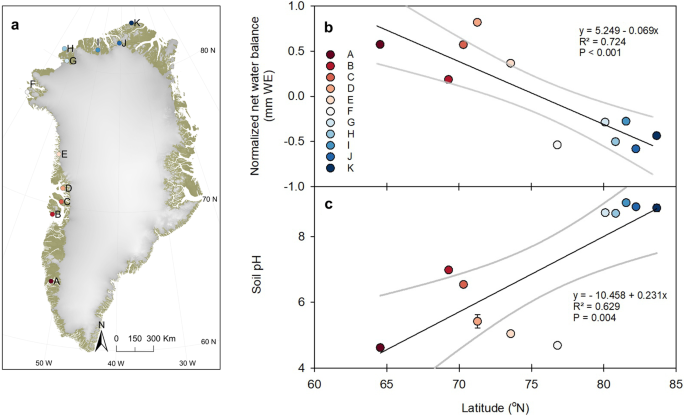
ENVIRONMENTAL CHARACTERISTICS ACROSS LATITUDES The sampling sites (Fig. 1a and Supplementary Table 1) were chosen to include the large variation in environmental conditions with respect to
climate and growing season length (Supplementary Fig. 1), net water balance (Fig. 1b), and parent material (Supplementary Table 1) found along the latitudinal transect. During the site
visits, the mean air temperature was comparable across the transect (6.5 ± 0.4 °C, based on monthly averages from MAR v3.8; see Supplementary Fig. 1). The southern sites (A–F; <80°N),
except site F, were characterised by a positive net water balance (Methods) during the growing season and had a soil water content (SWC) at the sampling time between 3 and 19 vol. % (Fig. 1b
and Table 1). The five northernmost sites (G–K, >80°N) were the driest with a top soil water content ranging between 1 and 11 vol. % and a negative net water balance (Fig. 1b and Table
1). This agrees well with the general known pattern of a shift from net positive to net negative water balance from South to North of Greenland25. A negative water balance leads to upward
water movement, higher salinity and even precipitation of salt on the surface. Accordingly, the northern sites were poorly weathered, nutrient-poor and the parent material was rich in
carbonates, e.g., lime and dolomite, and created a strong alkaline environment (Fig. 1c and Table 1). Along the latitudinal transect, we observed a large variation in soil pH concomitant
with the shift in net water balance and parent material (Fig. 1c; _P_ = 0.004). The soil pH variation spanned between pH 4.6 at site A and pH 9.0 at site I. In essence, this created two
distinct geographical groups, i.e., southern sites (south of 77°N; _n_ = 6) and northern sites (north of 77°N; _n_ = 5). The distribution of available soil Cu did not show any significant
relationship with latitude (Table 1; Methods) and is assumed to be controlled by site-specific characteristics such as parent material, soil organic matter and soil pH22. MICROBIAL COMMUNITY
STRUCTURE Microbial community structure differed significantly between sites (_P_ < 0.001) (Fig. 2). A total of 12011 operational taxonomic units (OTUs) belonging to 35 phyla, of which
11 accounted for >50% of the sequences from each site were identified by amplicon sequencing of the bacterial and archaeal V4 region of the 16S rRNA gene (Methods; Supplementary Note 1
and Supplementary Fig. 2). Based on distance-based redundancy analysis (db-RDA), 33.2% of the variance in the microbial community composition was explained by the factors included (Fig. 2
and Supplementary Table 2). In particular, soil pH (Mantel test: _r_ = 0.81, _P_ = 0.001) displayed the strongest association with community dissimilarities, which is consistent with other
studies16,26 including high latitudes27,28. This was also observed in the microbial distribution across our latitudinal transect, which was strongly shaped by soil pH and clustered in two
distinct groups corresponding to the southern and northern regions (Fig. 2). Within the southern sites (A–F, <80°N), the same set of parameters explained the observed microbial community
dissimilarities (Supplementary Fig. 3 and Supplementary Table 3). At the northern latitudes (>80°N), instead, soil pH (Mantel test: _r_ = 0.17, _P_ = 0.03) and EC (Mantel test: _r_ =
0.34, _P_ = 0.001) were overarching factors across sites (Supplementary Table 4). At these sites, the negative water balance, the site-specific geological characteristics (Supplementary
Table 1), and the proximity to the ocean led to high alkalinity and higher EC, which in turn resulted as strong controls over microbial communities’ dissimilarities. METHANE UPTAKE AND
METHANOTROPHS ABUNDANCE AND COMPOSITION The intact soil cores were sealed into glass jars and incubated for 5 h at 7 °C. During incubation, we withdrew five discrete gas samples from the
jar’s headspace and the changes in CH4 concentration over time were measured using an Ultraportable Greenhouse Gas Analyser (UGGA, Los Gatos, UK). All samples showed a consistent net CH4
uptake (here reported with a negative sign indicating a decrease in headspace concentration) with variations across and within sites (Fig. 3). The average rate per site ranged between −0.08
± 0.02 nmol CH4 g−1 dw d−1 at site E (73°N) and a maximum of −4.09 ± 1.28 nmol CH4 g−1 dw d−1 at site H (80°N). The average CH4 uptake rate across all the sites (−1.83 ± 0.19 nmol CH4 g−1 dw
d−1) fell within the range recorded in previous incubation studies5,6,9,10 focusing on comparable Greenlandic ecosystems (ca.1 nmol CH4 g−1 dw d−1 at 7 °C and 20–25 °C5,9; 1.24–2.14 nmol
CH4 g−1 dw d−1 at 10 °C9; 0.67 nmol CH4 g−1 dw d−1 at 10 °C10). We used intact soil cores to maintain the integrity of the soil structure and minimise indirect disturbances of microbial
activity during the incubations. This minimum disturbance may explain the high average rates (>−2.5 nmol CH4 g−1 dw d−1) observed at some sites, although this alone cannot explain the
higher (2-fold of site average) rates measured at site H, which may consequently be regarded as “high” for methanotrophic activity (Fig. 3). At each site, the qPCR-derived _pmoA_ gene
abundance that was used as a proxy for the presence of the MOB community significantly linked to the net CH4 uptake rates (linear regression _R_2 = 0.564; _P_ = 0.005), but it did not show
any clear distribution with latitude and varied largely both between and within sites (Table 1). The _pmoA_ gene abundance exhibited a three-order-of-magnitude range, and the average
abundance across sites of 7.5 ± 1.7 × 10⁶ copies g−1 dry sample (_n_ = 98 ± SE) was consistent with reported values for upland grasslands13, alpine glacier forefield29, and boreal and
temperate forest soils30,31,32. The average 16S rRNA gene copy number was 1.9 (±0.02 SE) using Ribosomal Database Project (RDP) Classifier33. Considering two copies of _pmoA_ per MOB
genome34, MOB represented approximately 4 ± 2.9% of the prokaryotic population along the transect (Table 1). This was positively and significantly correlated (_r_ = 0.279, _P_ < 0.01)
with the relative abundance of MOB extracted from 16S rDNA sequencing data (Supplementary Fig. 4), which varied between 0.06% and 4.04%. Diverse methanotrophic bacteria were identified based
on the 16S rDNA sequencing data. Type II mainly distributed in the southern sites and Type I mainly distributed in the northern sites (Supplementary Fig. 4). We further investigated the
composition of the methanotrophic community (Methods) through metagenomic analysis at six selected sites (A, B, D, H, J, K), representative of the transition in net water balance and soil pH
along the gradient (Supplementary Fig. 5). Compared to the qPCR approach (abundance of _pmoA_ genes, Table 1), three of the replicates analysed through metagenomics did not show detectable
MOB (replicates B4, D2 and D5). The mismatch between the two methodologies can be explained by different detection limits, as the metagenomic analysis has higher thresholds for detection as
compared to the qPCR method35. On average, 91.9% of the assembled _pmoA_ genes were annotated as belonging to Alphaproteobacteria (Type llb methanotrophs) or Gammaproteobacteria (Type ld
methanotrophs) lineages ubiquitous in moist-to-dry soils and known to oxidise CH4 at atmospheric concentrations17. The northern sites (H, J, K, >75°N), were dominated by the
Gammaproteobacteria Upland Soil Cluster (USC)-γ (Supplementary Table 5), which has previously been found in nutrient-poor environments such as upland soils13,36, temperate grasslands19,
karst caves18 and desert soils37. Whereas, the MOB affiliated with the USC-α, frequently found in upland dry soils9 and temperate forest soils19,31,38, represented 0–22% of the assembled
_pmoA_ genes among the selected northern sites (Supplementary Table 5). This result was consistent with the 16S rRNA gene sequencing result. The rather similar CH4 uptake rates measured at
the southern and northern sites (e.g., sites A and K), is a surprise considering the large spatial heterogeneity of MOB diversity and abundance, which in turn could be linked to the extreme
soil pH gradient measured across the latitudes (Fig. 1c), as well as to natural distributions of available soil Cu and SWC (Supplementary Fig. 6). Hence, our results point at the importance
of soil pH in shaping the diversity of the MOB’s community without directly affecting the soil’s potential to act as a CH4 sink. The MOB affiliated to USCγ have previously been found in
soils with neutral to alkaline pH12,13,17,30. On the contrary, those affiliated to the USCα are known to be well-adapted to acidic soil pH19, as observed at the most southern latitudes of
our transect. To date, the USCγ and USCα are uncultivated clades and there is still an incomplete understanding of their basic physiology. However, their affiliation to Type I (USCγ) and
Type II (USCα) MOB suggests different carbon fixation pathways, which could lead to different carbon use efficiencies, growth rates39, and cell-specific CH4 oxidation capacities. EFFECTS OF
EDAPHIC FACTORS ON SOIL CH4 UPTAKE RATES We used SEM to investigate the relationships between edaphic factors and their direct and indirect effects on the soil uptake of CH4 (Methods). SEM
was based on an a-priori model (Supplementary Note 2 and Supplementary Fig. 7) consisting of direct abiotic controls (pH, available Cu, soil water content and total nitrogen) on CH4 uptake
and their indirect effects through the abundance of MOB (Fig. 4). Our samples were collected during the summer season, with similar air temperatures across sites, and later they were
incubated at 7 °C and in situ water contents. Hence, we excluded potential seasonality-related effects, e.g., air temperature. Finally, we included CH4 uptake rates as the main response
variable. We tested this by allowing available Cu and MOB abundance to interact with soil pH. After excluding all the non-significant paths (Supplementary Table 6), the soil CH4 uptake for
all our sites along the latitudinal gradient was controlled by a direct and positive effect of the _pmoA_ gene abundance (_P_ = 0.03) as well as an indirect positive effect of available Cu,
through the abundance of MOB (_P_ < 0.001). Soil pH alone, did not show any significant relationship with the abundance of MOB, instead, it resulted in a direct and positive control on
CH4 uptake when interacting with available Cu (_P_ = 0.001). Based on our metagenomics and metabarcoding results, we observed a significant soil pH effect on the MOB community composition,
but not on the total abundance of MOB. This supports the missing link between soil pH and _pmoA_ abundance in the SEM, as only the MOB’s abundance and not the community composition is taken
into account in this analysis. Cu solubility is known to decrease with increasing soil pH22 and its low availability may constrain MOB to oxidise atmospheric CH4. On the contrary, the SEM
output suggests that the soil CH4 uptake rates observed along the latitudinal transect varied concordant with both soil pH and available Cu (as interaction). The site-specific microbial
sensitivity to changes in Cu seems to be the driver of this complex response, which hinges on the variable background concentrations of Cu (at our sites on average low 4–76 ng g−1), soil pH,
parent material and climate. Along the observed soil pH gradient from South to North Greenland, the soil CH4 uptake increased with increasing concentrations of available Cu, in particular
at Northern sites with alkaline soils. Although soil hydrology is among the main factors controlling soil CH4 uptake4, through its direct impact on gas diffusion as well as on the presence,
distribution and activity of MOB40,41, we did not find any significant relationship between SWC and the abundance of MOB or their function. Despite very low levels of SWC (Table 1), we
measured high CH4 uptake rates and this was in agreement with previous in situ measurements4 at dry barren soils in Disko Island (West Greenland). The SEM highlighted a significant positive
correlation between Cu and SWC (across all sites), indicating that the driest sites (Northern) were also the sites with the lowest Cu availability (Table 1). However, this was not reflected
in the absolute abundance of MOB (Table 1) or the net CH4 uptake rates (Fig. 3). Overall, _pmoA_ abundance and the interaction of pH and available Cu, as fixed factors, explained 47%
(marginal _R_2 = 0.47) of the observed variation in CH4 uptake rates. When taking into account also the spatial variation (the sampling sites were included as a random factor), the model
explained up to 56% of the observed CH4 uptake rates (conditional _R_2 = 0.56). METHANE UPTAKE AND NET CH4 FLUXES ACROSS GREENLAND The XPTEM-XHAM model, explicitly designed for High-Affinity
Methanotrophs, has been employed to simulate net CH4 budgets across the entire circumpolar region11. This model takes into account microbial physiology and dynamics of MOB, with optimised
parameters for various vegetation types. While several soil-related factors, including pH, are considered, there is currently no function related to Cu. Here, we used a high-resolution land
surface classification24 and meteorological data from MAR v3.8 to drive the XPTEM-XHAM model at a spatial resolution of 5-km across Greenland (59 to 82 °N; −73 to −11 °W; Methods). To assess
its suitability to simulate the spatial variability of the net CH4 sink of the ice-free Greenland, we compared the modelled estimates of CH4 uptake to the estimates of CH4 uptake based on
these laboratory incubations, after conversion to area-based units (see Methods). To ensure consistency with the period of soil samples collection, the comparison included only the modelled
estimates for July (for the years 2000–2016), extrapolated from the same locations included in this study. However, sites J and K were not included, as the model did not provide any
simulation above 82°N, which is the upper boundary of the land-cover map used. The model results (Fig. 5) matched the magnitude of the measured CH4 uptake rates in the incubation experiment
(in average: 0.06 ± 0.02 mg CH4 m−2 h−1 for the measured samples; 0.13 ± 0.03 mg CH4 m−2 h−1 for the modelled fluxes at the sites; 0.08 ± 0.0004 mg CH4 m−2 h−1 for the modelled fluxes over
Greenland). However, the soil incubations represent only the top 5 cm soil with uniform temperature, whereas the model provides an estimate integrated over 1 m soil depth taking into account
an increasing soil moisture and lower temperatures with depth. This is aligned with the results of depth-specific measurements suggesting that CH4 oxidation is mainly a near-surface
process5. The model was less good at capturing spatial trends observed between sites. We attribute this primarily to a lack of spatial information on soil edaphic factors related to parent
material, including the vertical distribution in soil profiles of these factors as Cu availability, which cannot be captured using vegetation-specific parameters. Our incubation experiment
suggests that spatial distribution of soil pH and available Cu are especially important to include in future models, as their combined effect regulates both the abundance and activities of
MOB responsible for atmospheric CH4 oxidation. The current simulation of XPTEM-XHAM model estimated an annual total CH4 oxidation of 65.6 ± 4.9 × 10³ Mg CH4 year−1 in dry mineral soils
across Greenland (Supplementary Fig. 8). This estimate is markedly higher than the spatially extrapolated mean annual CH4 emissions (9.12 ± 1.47 × 10³ Mg CH4 year−1) from the XPTEM-XHAM
simulations for Greenland for the years 2000–201611. In Greenland, wetlands cover only 1.4% of the total terrestrial ecosystems, as compared to the dry upland soils covering 78% of the
landscape24. The remaining area consists of dry to moist tundra and shrubs land, which have been shown to be additional but small sink areas for atmospheric methane4,5,7. Thus, with our
current best estimates of sources and sinks, the net CH4 budget reveals that Greenland is an overall sink of methane equal to 57 [50–63] × 103 Mg CH4 year−1 of atmospheric CH4, which is
similar to the previous regional assessment from NE Greenland5 and responsible for ~1% of the estimated regional CH4 soil uptake north of 50°N (_ca_. 5.5 Tg year−1)11. CONCLUSIONS Our
results suggest that large variations in the net soil CH4 uptake across Greenland depend on the complex interaction of MOB’s abundance and composition (e.g., USCα and USCγ) and the
interactions between natural concentrations of available Cu and soil pH, when not considering temporal effects of soil temperature and moisture. Therefore, we recommend that future research
should focus on determining the importance of these factors on the spatial variations in CH4 uptake across different pedoclimatic regions of the Arctic beyond Greenland. Our study highlights
how future models should include the interactions of these abiotic and biotic parameters, as well as other yet unidentified drivers, for a better simulation of the spatial variations in
soil CH4 oxidation capacity. This, in turn, will allow a more precise estimation of the actual contribution of the dry upland ecosystems to the Arctic CH4 budget. The net Greenland CH4 sink
comprises only 1‰ of the net sub-Arctic and Arctic (60-90°N) CH4 bottom-up budget of 42 Tg CH4 year[−11. This small contribution can be explained by the relatively small areal extent of
these Greenlandic ecosystems (_ca_. 1.8% of the northern circumpolar permafrost region), as a consequence of their geologically young age, hence limited soil development, combined with short
growing seasons and low precipitation. Nevertheless, as dry upland ecosystems cover 87% of the northern circumpolar region, our empirical and model findings highlight the need to consider
these vast, well-drained areas as important contributors to the Arctic CH4 budget. METHODS SITES DESCRIPTION AND SOIL SAMPLING Eleven sites were chosen along the ice-free areas of West and
North Greenland across a latitudinal transect from South (64˚N) to North (83˚N). Mean annual temperature varies from −4.8 °C in the South (sporadic permafrost) to −17 °C in the North (and
continuous permafrost). Apart from directly affecting the activities of MOB, this temperature gradient also influences the length of the plant-growing season, and thereby the water balance
(Supplementary Fig. 1). Precipitation measurements (including snow) are scarce in Greenland, but data from the Danish Meteorological Institute (DMI)24 suggest 100–150 mm year−1 in the driest
parts of North Greenland, and more than 700 mm year−1 in the Nuuk area. All sites were ice-covered during the last glacial maximum (21,000 years ago) and therefore represent relatively
young soil types42 (<10,000 years old) with a weak soil development. The following 11 sites (Supplementary Table 1) were all sampled during the growing season of 2016 (mid-July to
mid-August): Qoornoq (A), Disko Island (B), Nuussuaq (C), Qalatup Taserssua (D), Melville Bay (E), Nuulliit (F), Cass Fjord (G), Hans Island (H), Warming Land (I), Nunataq (J), Kap Morris
Jesup (K). At each site, we collected nine replicate soil cores (100 cm3) from the top 0–5 cm soil depth over an area of 100 m2. If present, we removed the top layer of gravel before
sampling to ensure sampling of the portion of soil material with likely biological activity. The samples were stored at 5 °C until further analyses, which took place within 30 days from the
sampling time. Thereby, sampling represented a snapshot during the peak growing season with an air temperature variation across sites of less than 8 degrees (15–23 °C) and soil temperatures
at 5 cm depth between 6 and 12 °C and a median of 7 °C. CLIMATIC WATER BALANCE CALCULATIONS The water balance is critical to both the overall water content level, but also the fate of
nutrients and soil pH following soil weathering and decomposition of soil organic matter. To describe quantitatively differences in summer water balance between sites, we used monthly
regional climate model data from the MAR model v3.8 tuned for Greenland43 with 1 km spatial resolution. The model was forced with climate data from the recently released ERA-5 reanalysis
climate data. We extracted MAR data from the nearest (Haversine distance) land-based cell for each site, using the surface type mask from Bamber44. We averaged rainfall and latent heat flux
data for each site during June-August in the climate normal period 1987 through 2016, and min-max-normalised rainfall and latent heat flux between sites. This allows a combined water and
energy budget for the entire region with a unique high resolution, which subsequently was used for simulating CH4 consumption across Greenland based on the XPTEM-XHAM model, which previously
has been used to simulate large-scale CH4 consumption in the Arctic11. LABORATORY INCUBATIONS OF INTACT SOIL CORES We placed the intact soil cores into glass jars (365 mL) and pre-incubated
them for 48 h at 7 °C. We covered the jars with perforated parafilm to avoid water loss and to ensure aerobic conditions. Afterward, we sealed each jar with a metal lid equipped with a
butyl rubber septum and over-pressurised with 10 mL atmospheric air (~1.9 ppm CH4). We withdraw discrete gas samples (2 mL) with a 2 mL plastic syringe from the jar’s headspace over 5 h
incubation time at 7 °C. In total, five gas samples were collected from each sample after 0, 1, 2, 3, and 5 h and the CH4 concentration was measured using an Ultraportable Greenhouse Gas
Analyzer (UGGA, ABB - Los Gatos Research, San Jose, CA). Immediately after sampling, we fully injected the 2 mL headspace sample into a stream of dinitrogen (N2) that was fed to the inlet of
the UGGA at 700 mL min−1, which matched the flow rate of the UGGA. The N2 stream ensured a stable baseline where the CH4 concentration was zero and consistent between every single
measurement. The readings from the 2 mL samples were converted to headspace CH4 concentrations in ppm based on a 4-step standard curve (1.9, 0.9, 0.45, 0.225 ppm). Gas standards were newly
prepared prior to each analysis by serial dilution of a certified gas standard containing approximately ambient CH4 concentration (1.9 ppm) and stored in gas-tight bags of Tedlar® film.
Quality control (QC) samples containing 0.75 ppm of CH4 were also prepared in a gas-tight bag and injected roughly every 26th headspace sample. Standards and QC samples were injected
similarly to the headspace samples and five technical replicates were injected for each standard or QC concentration. NET METHANE UPTAKE RATE CALCULATIONS Before CH4 flux rate calculation,
all the obtained CH4 concentrations were quality checked by plotting them against the time of sampling. The slopes of the regressions (ppm s−1) were estimated by fitting either linear and
non-linear models to the five data points (Supplementary Fig. 9). The model’s choice was based on visual inspection of each regression and the best fit (_R_2 value). In those samples where
we observed a sharp decrease in CH4 concentration during the first hour of incubation, the slope was estimated based on the first two data points to avoid an overestimation of the slope at
time zero (_t_ = 0). The slopes were accepted when significantly different from zero (_P_ ≤ 0.05) or otherwise set to zero. The rates (ppm s−1) were converted to the net CH4 uptake rate
(FCH4) as nmol CH4 g−1 dry soil d−1 using the ideal gas law as in Eq. (1). $${F}_{C{H}_{4}}=\,{S}_{C{H}_{4}}\times \frac{V}{{m}_{dry}}\times \frac{P}{R * T}\times 3600\times 24$$ (1) Where
_S__CH4_ is the rate in ppm s−1, _V_ is the volume of the headspace of the jar in m3, _m__dry_ is the dry weight of soil, _P_ is the pressure in the incubation system (assumed to be 1 atm,
as the effects of adding 10 mL of atm. air were considered negligible), _R_ is the gas constant (m3 atm K−1 mol−1), _T_ is the temperature in degrees Kelvin and the factor 24 × 3600 converts
the rate to daily flux. The final net CH4 uptake rates were reported as negative values. SOIL CHEMICAL ANALYSES After the incubations, we split the fresh intact samples for further chemical
and biological analyses. Half of each fresh soil sample was freeze-dried for 48 h and the difference between their fresh and dry weight used to calculate the volumetric water content (%).
The dry soil was further subsampled and a portion was finely homogenised by ball-milling and weighed (20 mg) into Ag-foil combustion capsules to measure total organic C and N contents.
First, we removed the inorganic C present in the soils as described in Harris et al.45. In brief, we moistened the samples with Milli-Q water until the samples reach a water content close to
the maximum water holding capacity (_ca_. 35 µL), placed in a vacuum desiccator and fumigated with 100 mL of hydrochloridric acid (HCl 12 M) for 24 h. The samples were then oven-dried at 60
°C for 24 h. Finally, we estimated the contents of C and N by dry combustion using an EA1110 elemental analyser (Thermo Scientific, Bremen, Germany). Soil standards (Elemental
Microanalysis, Okehampton, UK) were used for elemental analyser mass calibration. A portion of the fresh samples (10 g) was used for cold water extraction by suspension in Milli-Q water (10
g soil: 50 mL Milli-Q H2O) and gently shaken for 1 h at room temperature. The supernatant was used to measure pH and electric conductivity (EC) with a pH meter (pH 1100 L, VWR, Germany) and
a conductivity meter (CO 3100 L, VWR, Germany), respectively. To obtain information on the availability of chemical elements, elemental composition and available copper (Cu) were determined
in soil-water extracts (supernatants) generated from the remaining fresh soil samples as described in Brandt et al.46 (Supplementary Note 3 and Supplementary Fig. 10). In brief, 1 g of soil
was extracted with 5 mL Milli-Q water via horizontal shaking (2 h, 22 °C) and centrifugation (10,000 g, 10 min, 22 °C). Total elemental composition was determined by inductively coupled
plasma-mass spectrometry (ICP-MS; Agilent 7900, Agilent Technologies, Tokyo, Japan) after digesting ground samples under pressure with aqua regia and hydrofluoric acid according to EPA 3052
(USEPA, 1996) using a closed vessel microwave-assisted system (Multiwave 3000, Anton Paar GmbH, Graz, Austria). QUANTIFICATION OF TOTAL BACTERIAL AND METHANOTROPHS ABUNDANCE The Powersoil
DNA Extraction kit (MOBIO Laboratories, Carlsbad, CA, USA) was used to extract DNA from 0.5 g of the freeze-dried soil sample following the manufacturer’s directions. The quality and
concentration of the extracted DNA were measured by Nanodrop (Thermal) and Qubit kit (Life Technologies), respectively. Absolute abundances of bacteria and methanotrophs were quantified by
quantitative polymerase chain reaction (qPCR). Primer sets of 515f-806rB targeting bacterial and archaeal 16S rRNA gene and 189f-682r targeting _pmoA_ gene were used to assess the abundances
of bacteria/archaea and methanotrophs, respectively47,48. qPCR was conducted using Power SYBR Green PCR Master Mix (Applied Biosystems, Warrington, UK) in Applied Biosystems (ABI) 7900HT
sequence detection system. A total of 10 μL PCR reaction volume per well contained 5 μL SYBR Green mastermix, 0.4 μL forward and reverse primers (10 μM), 0.4 μL of bovine serum albumin (BSA;
20 mg mL−1), 3.3 μL PCR grade H2O and 0.5 μL soil DNA with a concentration of less than 10 ng μL−1. Standard curves were obtained with the serial dilutions of plasmid DNA containing the
target genes, which were amplified from soil DNA by 515f-806rB and 189f-682r, respectively. Then, the PCR amplified fragments were cloned using the pGEM-T vector (Promega Cor. Madison, WI
USA) according to the manufacturer’s instructions. Several positive clones were sequenced to make sure that correct fragments were amplified by these two primer sets. Standard PCR condition
was applied for 16S rRNA gene: 10 min of polymerase activation at 95 °C, followed by 40 cycles of 15 s at 95 °C, 1 min at 60 °C. The amplification efficiencies and _R_2 value of primer pair
of 515f-806rB were 81% and 0.996, respectively. The PCR condition for the _pmoA_ gene was 10 min of polymerase activation at 95 °C, followed by 40 cycles of 30 s at 95 °C, 45 s at 57 °C and
45 s at 72 °C. The amplification efficiencies and _R_2 value of primer pair of 189f-682r were 85% and 0.989, respectively. MICROBIAL COMMUNITY ANALYSIS Primer set 515f-806R was used to
amplify the bacterial and archaeal V4 region of 16S rRNA genes49. All the amplicons were pooled together, cleaned and bi-directionally sequenced on the Illumina Miseq platform. Sequencing
was performed at Research Technology Support Facility in Michigan State University, East Lansing, Michigan, United States of America. Raw sequencing reads were sorted according to barcode
and assembled through the RDP modified pandaseq with low quality (_Q_ score <25) and short reads (length <200) removed. Primers were removed through RDP SeqFilters tool50. All the 16S
rRNA gene reads were classified using RDP naive Bayesian classifier after chimeras were filtered using UChime51,52. All samples of 16S rRNA gene reads were subsampled to the same sequence
depth before classification, with 11395 sequences for each sample. The clean 16S rRNA gene reads were clustered by using the UPARSE pipeline of the USEARCH V8 at 97% nucleotide
identity53,54. The produced OTU table and hierarchy table were further analysed using the VEGAN package in R (version 3.2.2). Bray–Curtis db-RDA was performed to illustrate the
beta-diversity between treatments. ASSEMBLY AND ANNOTATION OF PMOA GENE FROM SHOTGUN METAGENOMIC SEQUENCING DATA Shotgun metagenomic sequencing was also performed at Research Technology
Support Facility in Michigan State University. Libraries were prepared using the Illumina TruSeq Nano DNA Library Preparation Kit on a Perkin Elmer Sciclone G3 robot following the
manufacturer’s recommendations. Completed libraries were quality controlled and quantified using a combination of Qubit dsDNA HS and Agilent Bioanalyzer High Sensitivity DNA assays. Based on
these quantifications all libraries were pooled in equimolar amounts for multiplexed sequencing. The pool was quantified using the Kapa Biosystems Illumina Library Quantification qPCR kit.
This pool was then loaded onto six lanes of an Illumina HiSeq 4000 flow cell and sequenced in a 2 × 150 bp paired-end format using HiSeq 4000 SBS reagents. Base calling was done by Illumina
Real Time Analysis (RTA) v2.7.7 and the output of RTA was demultiplexed and converted to fastq format with Illumina Bcl2fastq v2.19.0. Raw reads in fastq files were firstly quality
controlled and adaptors were trimmed by the Trimmomatic software. The assembly and annotation of the _pmoA_ gene were then conducted by the target gene assembler, Xander55. The reference
file of each _pmoA_ gene group was built using well-known gene sequences, protein sequences and HMMER 3.0 program, following the Xander software instructions
(https://github.com/Bingbing1110/HMMs-of-pmoA-gene). Three _pmoA_ groups (_pmoA_1, _pmoA_2, and _pmoA_3) were clustered based on a review17 and recently identified methanotroph56. Therefore,
the _pmoA_ genes were assembled and annotated based on reference files and trimmed raw reads according to Xander’s user guide. The relative abundance of each _pmoA_ group was calculated
based on 10,000 similarly assembled _rplB_ gene sequences. The _rplB_ gene is a single-copy housekeeping gene and is used to normalise target gene data to the total prokaryotic population.
EVALUATION OF UNIVERSAL PRIMER PAIR FOR QUANTIFICATION OF PMOA GENE The coverage of primer pair 189f-682r was evaluated by the ProbeMatch tool developed by RDP49. All retrieved _pmoA_ gene
sequences from metagenomic data were used as the reference database. A maximum of two mismatches was allowed. Since the _amoA_ gene can be non-specifically amplified by primer pair
189f-682r, we analysed the _amoA_ gene from metagenomic data and potential ammonia oxidising bacteria (AOB) from 16S rDNA sequencing data to see the specificity of 189f-682r on Greenland
samples. In order to more accurately evaluate the abundances of _amoA_ and _pmoA_ genes, the Xander assembled _pmoA_ gene and _amoA_ gene sequences were reclassified by GFClassify software
(http://github.com/rdpstaff/gfclassify), which classifies sequences into discrete categories based on their relative performance on two (or more) probabilistic models (Interpolated Context
Models, ICM), in this case models built on training sets of _amoA_ and _pmoA_ sequences. Result showed that _amoA_ gene was not assembled in most samples. Just one _amoA_ contig was found.
The relative abundance of AOB was very low and the specificity of primer pair 189f-682r was high on Greenland samples. STRUCTURAL EQUATION MODEL We used multi-level path analysis or
piecewise SEM (a form of structural equation modelling) to evaluate the direct and indirect relationships between soil characteristics, the abundance of methanotrophs and methane uptake
rates based on 97 observations across 11 sites. Two samples (D2 and H5) were omitted due to missing data on the C/N analyses and _pmoA_ abundance, respectively. SEM is a group of statistical
methods employed to test the hypothesised causal relationships between variables in multifactorial systems57. Traditionally, SEMs are fitted using maximum likelihood methods to select
parameters that represent the relationships in the observed variance-covariance matrix. Alternatively, piecewise SEM has been developed to allow the evaluation of the individual paths in the
system by constructing separate models for each path. An advantage of this method is that it allows for more flexibility in the type of models that can be fitted. For instance, random
effects can be included to account for the lack of independence between observations in studies involving replicated sampling in multiple sites58. To assess the direct and interactive
effects, we constructed multi-level path models and included “site” as a random effect to account for the correlation in samples taken at the same site. Available Cu and _pmoA_ gene
abundance were log-transformed to comply with model assumptions. Furthermore, all variables were mean centred. We did this to reduce the multicollinearity between single and interaction
terms and to aid the interpretation of the interactions in our model. Complete model parameters can be found in Supplementary Table 6. We used standardised coefficients as they represent
relative effect sizes. In this way, the effects of the different variables in the model are directly comparable and indicate the relative importance of each path. The residuals of the models
were visually inspected for compliance with assumptions of normality and homoscedasticity. Model fit was assessed by calculating marginal and conditional R2 for general linear mixed
models59. All models were fitted with the lme4 1.1-21 package (Bates, 2015) within the piecewiseSEM 2.1.0 package58 in R version 3.5.3 (R Core Team, 2019). MODELLING APPROACH The XPTEM-XHAM
model based on the Terrestrial Ecosystem Model (TEM) has been used to simulate current and future methane uptake from Greenland11. The CH4 dynamics module of TEM simulates CH4 production,
oxidation, and three transport processes—diffusion, ebullition, and plant-mediated transport—between soil and atmosphere. XPTEM-XHAM further added microbial dynamics of MOB. In this study,
modelling was performed with the same parameters as described previously11 but at a higher resolution (from 50- to 5-km spatial resolution). This was possible due to a high-resolution land
surface classification reported for Greenland up to 82 °N24. We used meteorological inputs from the MAR v3.8 model and ran a simulation for the period from 1 January 2000 to 31 December
2016, with hourly-step for the microbial module and daily-step for other modules11 with a spin-up period of 15 years. Grid cells with more than 50% of the area of ice and ocean were
discarded, resulting in a total of 43,849 grid cells with 5-km resolution. Other input data, model parameters and setup remain the same as XPTEM-XHAM model11. The comparison between the
model estimates and the net CH4 uptake rates measured in our incubation experiment was done after harmonising all the units into area-based (mg CH4 m2 hr−1). The surface area of the soil
core used (Ø 5 cm) for collecting the intact soil samples was used to convert our measured rates from gram of dry weight soil into m2. REPORTING SUMMARY Further information on research
design is available in the Nature Portfolio Reporting Summary linked to this article. DATA AVAILABILITY All raw sequencing data, including 16S rRNA gene sequencing data and shotgun
sequencing data have been deposited in NCBI’s Sequence Read Archive under the BioProject accession number PRJNA728249. The datasets used in this study can be accessed here
https://sid.erda.dk/sharelink/fl7ko3IeRb. REFERENCES * Saunois, M. et al. The Global Methane Budget 2000–2017. _Earth Syst. Sci. Data_ 12, 1561–1623 (2020). Article Google Scholar *
Hugelius, G. et al. Estimated stocks of circumpolar permafrost carbon with quantified uncertainty ranges and identified data gaps. _Biogeosciences_ 11, 6573–6593 (2014). Article Google
Scholar * Kuhn, M. A. et al. BAWLD-CH4: a comprehensive dataset of methane fluxes from boreal and arctic ecosystems. _Earth Syst. Sci. Data_ 13, 5151–5189 (2021). Article Google Scholar *
D’Imperio, L., Nielsen, C. S., Westergaard-Nielsen, A., Michelsen, A. & Elberling, B. Methane oxidation in contrasting soil types: responses to experimental warming with implication for
landscape-integrated CH4 budget. _Glob. Change Biol._ 23, 966–976 (2017). Article Google Scholar * Jørgensen, C. J., Lund Johansen, K. M., Westergaard-Nielsen, A. & Elberling, B. Net
regional methane sink in High Arctic soils of northeast Greenland. _Nat. Geosci._ 8, 20–23 (2015). Article Google Scholar * Voigt, C. et al. Arctic soil methane sink increases with drier
conditions and higher ecosystem respiration. _Nat. Clim. Change_ https://doi.org/10.1038/s41558-023-01785-3 (2023). * St Pierre, K. A. et al. Drivers of net methane uptake across Greenlandic
dry heath tundra landscapes. _Soil Biol. Biochem._ 138, 107605 (2019). Article Google Scholar * Bárcena, T. G., Finster, K. W. & Yde, J. C. Spatial patterns of soil development,
methane oxidation, and methanotrophic diversity along a receding glacier forefield, Southeast Greenland. _Arct. Antarct. Alp. Res._ 43, 178–188 (2011). Article Google Scholar *
Christiansen, J. R. et al. Methane fluxes and the functional groups of methanotrophs and methanogens in a young Arctic landscape on Disko Island, West Greenland. _Biogeochemistry_ 122, 15–33
(2014). Article Google Scholar * Lau, M. C. et al. An active atmospheric methane sink in high Arctic mineral cryosols. _ISME J._ 9, 1880–1891 (2015). Article CAS Google Scholar * Oh,
Y. et al. Reduced net methane emissions due to microbial methane oxidation in a warmer Arctic. _Nat. Clim. Change_ 10, 317–321 (2020). Article CAS Google Scholar * Knief, C., Lipski, A.
& Dunfield, P. F. Diversity and activity of methanotrophic bacteria in different upland soils. _Appl. Environ. Microbiol._ 69, 6703–6714 (2003). Article CAS Google Scholar * Deng, Y.
et al. Upland Soil Cluster Gamma dominates methanotrophic communities in upland grassland soils. _Sci. Total Environ._ 670, 826–836 (2019). Article CAS Google Scholar * Kirschke, S. et
al. Three decades of global methane sources and sinks. _Nat. Geosci._ 6, 813–823 (2013). Article CAS Google Scholar * Kim, J. M. et al. Soil pH and electrical conductivity are key edaphic
factors shaping bacterial communities of greenhouse soils in Korea. _J. Microbiol._ 54, 838–845 (2016). Article CAS Google Scholar * Fierer, N. & Jackson, R. B. The diversity and
biogeography of soil bacterial communities. _Proc. Natl Acad. Sci. USA._ 103, 626–631 (2006). Article CAS Google Scholar * Knief, C. Diversity and habitat preferences of cultivated and
uncultivated aerobic methanotrophic bacteria evaluated based on pmoA as molecular marker. _Front. Microbiol._ 6, 1346–1346 (2015). Article Google Scholar * Zhao, R., Wang, H., Cheng, X.,
Yun, Y. & Qiu, X. Upland soil cluster γ dominates the methanotroph communities in the karst Heshang Cave. _FEMS Microbiol. Ecol._ 94, https://doi.org/10.1093/femsec/fiy192 (2018). *
Täumer, J. et al. Divergent drivers of the microbial methane sink in temperate forest and grassland soils. _Glob. Change Biol._ 27, 929–940 (2021). Article Google Scholar * Ridge, P. G.,
Zhang, Y. & Gladyshev, V. N. Comparative genomic analyses of copper transporters and Cu proproteomes reveal evolutionary dynamics of copper utilization and its link to oxygen. _PLOS ONE_
3, e1378 (2008). Article Google Scholar * DiSpirito, A. A. et al. Methanobactin and the link between copper and bacterial methane oxidation. _Microbiol. Mol. Biol. Rev._ 80, 387–409
(2016). Article CAS Google Scholar * Fru, E. C. Copper biogeochemistry: a cornerstone in aerobic methanotrophic bacterial ecology and activity? _Geomicrobiol. J._ 28, 601–614 (2011).
Article CAS Google Scholar * Semrau, J. D., DiSpirito, A. A. & Yoon, S. Methanotrophs and copper. _FEMS Microbiol. Rev._ 34, 496–531 (2010). Article CAS Google Scholar * Karami, M.
et al. A phenology-based approach to the classification of Arctic tundra ecosystems in Greenland. _ISPRS J. Photogramm. Remote Sens._ 146, 518–529 (2018). Article Google Scholar *
Westergaard-Nielsen, A., Hansen, B. U., Elberling, B. & Abermann, J. in _Encyclopedia of World’s Biomes_ (eds Goldstein, M. & Della Sala, D.) 3500 (Elsevier, 2020). * Lauber, C. L.,
Hamady, M., Knight, R. & Fierer, N. Pyrosequencing-based assessment of soil pH as a predictor of soil bacterial community structure at the continental scale. _Appl. Environ. Microbiol._
75, 5111–5120 (2009). Article CAS Google Scholar * Chu, H. et al. Soil bacterial diversity in the Arctic is not fundamentally different from that found in other biomes. _Environ.
Microbiol._ 12, 2998–3006 (2010). Article CAS Google Scholar * Ren, B. et al. Soil pH and plant diversity shape soil bacterial community structure in the active layer across the
latitudinal gradients in continuous permafrost region of Northeastern China. _Sci. Rep._ 8, 5619 (2018). Article Google Scholar * Chiri, E., Nauer, P. A., Rainer, E.-M., Zeyer, J. &
Schroth, M. H. High temporal and spatial variability of atmospheric-methane oxidation in Alpine Glacier forefield soils. _Appl. Environ. Microbiol._ 83, https://doi.org/10.1128/aem.01139-17
(2017). * Kolb, S. The quest for atmospheric methane oxidizers in forest soils. _Environ. Microbiol. Rep._ 1, 336–346 (2009). Article CAS Google Scholar * Kolb, S., Knief, C., Dunfield,
P. F. & Conrad, R. Abundance and activity of uncultured methanotrophic bacteria involved in the consumption of atmospheric methane in two forest soils. _Environ. Microbiol._ 7, 1150–1161
(2005). Article CAS Google Scholar * Bárcena, T. G. et al. Conversion of cropland to forest increases soil CH4 oxidation and abundance of CH4 oxidizing bacteria with stand age. _Appl.
Soil Ecol._ 79, 49–58 (2014). Article Google Scholar * Thompson, L. R. et al. A communal catalogue reveals Earth’s multiscale microbial diversity. _Nature_ 551, 457–463 (2017). Article
CAS Google Scholar * Kolb, S., Knief, C., Stubner, S. & Conrad, R. Quantitative detection of methanotrophs in soil by novel pmoA-targeted real-time PCR assays. _Appl. Environ.
Microbiol._ 69, 2423–2429 (2003). Article CAS Google Scholar * Crossette, E. et al. Metagenomic quantification of genes with internal standards. _mBio_ 12, e03173–e03120 (2021). CAS
Google Scholar * Martineau, C. et al. Atmospheric methane oxidizers are present and active in Canadian high Arctic soils. _FEMS Microbiol. Ecol._ 89, 257–269 (2014). Article CAS Google
Scholar * Angel, R. & Conrad, R. In situ measurement of methane fluxes and analysis of transcribed particulate methane monooxygenase in desert soils. _Environ. Microbiol._ 11, 2598–2610
(2009). Article CAS Google Scholar * Cai, Y., Zhou, X., Shi, L. & Jia, Z. Atmospheric methane oxidizers are dominated by upland soil cluster Alpha in 20 forest soils of China.
_Microb. Ecol._ 80, 859–871 (2020). Article CAS Google Scholar * Trimmer, M. et al. Riverbed methanotrophy sustained by high carbon conversion efficiency. _ISME J._ 9, 2304–2314 (2015).
Article CAS Google Scholar * Christiansen, J. R., Levy-Booth, D., Prescott, C. E. & Grayston, S. J. Microbial and environmental controls of methane fluxes along a soil moisture
gradient in a pacific coastal temperate rainforest. _Ecosystems_ 19, 1255–1270 (2016). Article CAS Google Scholar * Zhang, L. et al. Distinct methanotrophic communities exist in habitats
with different soil water contents. _Soil. Biol. Biochem._ 132, 143–152 (2019). * Fleming, K. & Lambeck, K. Constraints on the Greenland Ice Sheet since the Last Glacial Maximum from
sea-level observations and glacial-rebound models. _Quat. Sci. Rev._ 23, 1053–1077 (2004). Article Google Scholar * Noël, B., Fettweis, X., van de Berg, W. J., van den Broeke, M. R. &
Erpicum, M. Sensitivity of Greenland Ice Sheet surface mass balance to perturbations in sea surface temperature and sea ice cover: a study with the regional climate model MAR. _Cryosphere_
8, 1871–1883 (2014). Article Google Scholar * Bamber, J. L. et al. A new bed elevation dataset for Greenland. _Cryosphere_ 7, 499–510 (2013). Article Google Scholar * Harris, D.,
Horwáth, W. R. & van Kessel, C. Acid fumigation of soils to remove carbonates prior to total organic carbon or CARBON-13 isotopic analysis. _Soil Sci. Soc. Am. J._ 65, 1853–1856 (2001).
Article CAS Google Scholar * Brandt, K. K., Holm, P. E. & Nybroe, O. Evidence for bioavailable copper-dissolved organic matter complexes and transiently increased copper
bioavailability in manure-amended soils as determined by bioluminescent bacterial biosensors. _Environ. Sci. Technol._ 42, 3102–3108 (2008). Article CAS Google Scholar * Apprill, A.,
McNally, S., Parsons, R. & Weber, L. Minor revision to V4 region SSU rRNA 806R gene primer greatly increases detection of SAR11 bacterioplankton. _Aquat. Microb. Ecol._ 75, 129–137
(2015). Article Google Scholar * Holmes, A. J., Costello, A., Lidstrom, M. E. & Murrell, J. C. Evidence that particulate methane monooxygenase and ammonia monooxygenase may be
evolutionarily related. _FEMS Microbiol. Lett._ 132, 203–208 (1995). Article CAS Google Scholar * Kozich, J. J., Westcott, S. L., Baxter, N. T., Highlander, S. K. & Schloss, P. D.
Development of a dual-index sequencing strategy and curation pipeline for analyzing amplicon sequence data on the MiSeq illumina sequencing platform. _Appli. Environ. Microbiol._ 79,
5112–5120 (2013). Article CAS Google Scholar * Cole, J. R. et al. Ribosomal Database Project: data and tools for high throughput rRNA analysis. _Nucleic Acids Res._ 42, D633–D642 (2013).
Article Google Scholar * Wang, Q., Garrity, G. M., Tiedje, J. M. & Cole, J. R. Naïve Bayesian classifier for rapid assignment of rRNA sequences into the new bacterial taxonomy. _Appl.
Environ. Microbiol._ 73, 5261–5267 (2007). Article CAS Google Scholar * Edgar, R. C., Haas, B. J., Clemente, J. C., Quince, C. & Knight, R. UCHIME improves sensitivity and speed of
chimera detection. _Bioinformatics_ 27, 2194–2200 (2011). Article CAS Google Scholar * Edgar, R. C. Search and clustering orders of magnitude faster than BLAST. _Bioinformatics_ 26,
2460–2461 (2010). Article CAS Google Scholar * Edgar, R. C. UPARSE: highly accurate OTU sequences from microbial amplicon reads. _Nat. Methods_ 10, 996–998 (2013). Article CAS Google
Scholar * Wang, Q. et al. Xander: employing a novel method for efficient gene-targeted metagenomic assembly. _Microbiome_ 3, 32 (2015). Article CAS Google Scholar * Tveit, A. T. et al.
Widespread soil bacterium that oxidizes atmospheric methane. _Proc. Natl Acad. Sci. USA._ 116, 8515–8524 (2019). Article CAS Google Scholar * Grace, J. B. _Structural Equation Modeling
and Natural Systems_ (Cambridge University Press, 2006). * Lefcheck, J. S. piecewiseSEM: piecewise structural equation modelling in r for ecology, evolution, and systematics. _Methods Ecol.
Evol._ 7, 573–579 (2016). Article Google Scholar * Nakagawa, S. & Schielzeth, H. A general and simple method for obtaining R2 from generalized linear mixed-effects models. _Methods
Ecol. Evol._ 4, 133–142 (2013). Article Google Scholar Download references ACKNOWLEDGEMENTS This project was founded by the Danish National Research Foundation (CENPERM DNRF 100). Sampling
in North Greenland was made possible through the Mamont North Greenland expedition and the Leister Expedition around North Greenland. The portion of the study done in Michigan was funded by
the US Department of Energy Office of Science, awards DE-SC0010715 and DE-FG02-99ER62848 and the U.S. National Science Foundation Awards DBI-1356380 and DBI-1759892. All the samples were
collected and exported in agreement with the survey licence number G16-066 issued by the Ministry of Industry, Labour and Trade, Government of Greenland. AUTHOR INFORMATION AUTHORS AND
AFFILIATIONS * Center for Permafrost (CENPERM), Department of Geosciences and Natural Resource Management, University of Copenhagen, Øster Voldgade 10, DK-1350, Copenhagen, Denmark Ludovica
D’Imperio, Andreas Westergaard-Nielsen, Peiyan Wang, Per Ambus & Bo Elberling * Section of Forest and Landscape Ecology, Department of Geosciences and Natural Resource Management,
University of Copenhagen, Rolighedsvej 23, 1958, Frederiksberg C, Denmark Ludovica D’Imperio, Jesper Riis Christiansen & Sebastian Kepfer-Rojas * Department of Plant, Soil and Microbial
Sciences, Michigan State University, East Lansing, MI, 48824, USA Bing-Bing Li & James M. Tiedje * Center for Microbial Ecology, Michigan State University, East Lansing, MI, 48824, USA
Bing-Bing Li & James M. Tiedje * School of Life Sciences, Anhui Agricultural University, Hefei, 230036, China Bing-Bing Li * Global Monitoring Laboratory, NOAA, Boulder, CO, USA Youmi Oh
* Department of Plant and Environmental Sciences, University of Copenhagen, Thorvaldsensvej 40, 1871, Frederiksberg, Denmark Kristian Koefoed Brandt & Peter E. Holm Authors * Ludovica
D’Imperio View author publications You can also search for this author inPubMed Google Scholar * Bing-Bing Li View author publications You can also search for this author inPubMed Google
Scholar * James M. Tiedje View author publications You can also search for this author inPubMed Google Scholar * Youmi Oh View author publications You can also search for this author
inPubMed Google Scholar * Jesper Riis Christiansen View author publications You can also search for this author inPubMed Google Scholar * Sebastian Kepfer-Rojas View author publications You
can also search for this author inPubMed Google Scholar * Andreas Westergaard-Nielsen View author publications You can also search for this author inPubMed Google Scholar * Kristian Koefoed
Brandt View author publications You can also search for this author inPubMed Google Scholar * Peter E. Holm View author publications You can also search for this author inPubMed Google
Scholar * Peiyan Wang View author publications You can also search for this author inPubMed Google Scholar * Per Ambus View author publications You can also search for this author inPubMed
Google Scholar * Bo Elberling View author publications You can also search for this author inPubMed Google Scholar CONTRIBUTIONS B.E. conceived the study and collected all samples and
together with L.D., J.R.C., K.K. and J.T. designed the experiments; L.D. was responsible for incubations together with J.R.C., samples preparation for chemical analyses together with P.W.,
data analyses and interpretation; B.B. was responsible for molecular analyses and interpretations with help from J.T.; Y.O. made the process-based modelling; S.K.R. made the SEM model;
P.E.H. carried out the metal analyses; P.L.A. carried out the Total N and C analyses; K.K.B. was responsible for bioavailable Cu measurements and A.W.-N. for all climate data. L.D. compiled
the main dataset, drafted the MS with input from B.E., J.R.C., B.B. and K.K.B., and finalised the MS after comments from all authors. CORRESPONDING AUTHORS Correspondence to Ludovica
D’Imperio or Bo Elberling. ETHICS DECLARATIONS COMPETING INTERESTS The authors declare no competing interests. PEER REVIEW PEER REVIEW INFORMATION _Communications Earth & Environment_
thanks Sari Juutinen, Xiaofeng Xu and the other, anonymous, reviewer(s) for their contribution to the peer review of this work. Primary Handling Editors: Joshua Dean and Clare Davis. Peer
reviewer reports are available. ADDITIONAL INFORMATION PUBLISHER’S NOTE Springer Nature remains neutral with regard to jurisdictional claims in published maps and institutional affiliations.
SUPPLEMENTARY INFORMATION PEER REVIEW FILE SUPPLEMENTARY INFORMATION REPORTING SUMMARY RIGHTS AND PERMISSIONS OPEN ACCESS This article is licensed under a Creative Commons Attribution 4.0
International License, which permits use, sharing, adaptation, distribution and reproduction in any medium or format, as long as you give appropriate credit to the original author(s) and the
source, provide a link to the Creative Commons license, and indicate if changes were made. The images or other third party material in this article are included in the article’s Creative
Commons license, unless indicated otherwise in a credit line to the material. If material is not included in the article’s Creative Commons license and your intended use is not permitted by
statutory regulation or exceeds the permitted use, you will need to obtain permission directly from the copyright holder. To view a copy of this license, visit
http://creativecommons.org/licenses/by/4.0/. Reprints and permissions ABOUT THIS ARTICLE CITE THIS ARTICLE D’Imperio, L., Li, BB., Tiedje, J.M. _et al._ Spatial controls of methane uptake in
upland soils across climatic and geological regions in Greenland. _Commun Earth Environ_ 4, 461 (2023). https://doi.org/10.1038/s43247-023-01143-3 Download citation * Received: 07 March
2023 * Accepted: 23 November 2023 * Published: 07 December 2023 * DOI: https://doi.org/10.1038/s43247-023-01143-3 SHARE THIS ARTICLE Anyone you share the following link with will be able to
read this content: Get shareable link Sorry, a shareable link is not currently available for this article. Copy to clipboard Provided by the Springer Nature SharedIt content-sharing
initiative